This essay is based on the Premium Update posted on December 17th, 2010. Visit our archives for more gold & silver articles.
The past week has failed to provide clear signals in most markets worldwide. Perhaps the uncertainty of the financial stability of several European countries further compounded by normal holiday and year-end influences have thus far made December a difficult month to read.
As we have stated in our previous essay, even though the trend for the USD Index appears to be up, the impact that currencies have on gold, silver and mining stocks is quite unclear. However, this is only the only interesting thing as far as influences on the precious metals market are concerned. A major change could be in the cards regarding the relationship between stocks and precious metals. The situation is therefore complicated by stock market uncertainty as well as the changing relationship they have had with precious metals.
While uncertainty looms large over the state of the precious metals market, we analyze a few key indicators to comprehend fundamentals.

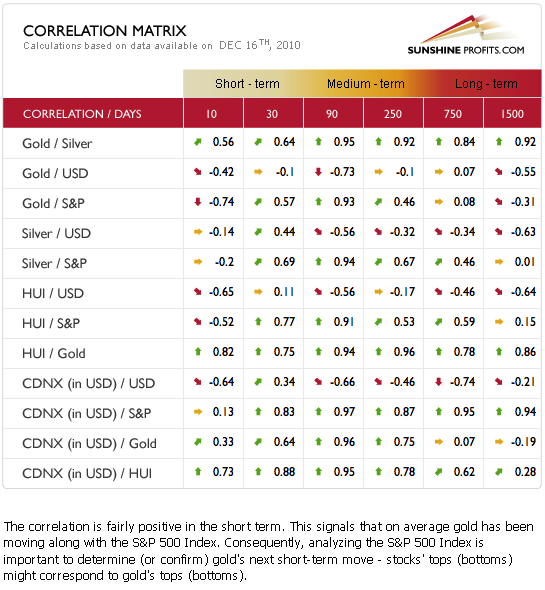
Namely, gold and the general stock market appear to have a strong positive relationship in the short-term or 30-day column. However, the 10-day column clearly shows a reversal of this relationship from positive to negative. This can also be seen for the relationship between HUI and silver with stocks as well.
If you didn't read our previous essays, and the above numbers appear perplexing, here's a short introduction - the greater the number (and more upward and green arrow accompanies it) the more positive influence a given market is likely to have on precious metals. The smaller the number (and more downward and red arrow accompanies it), the more negative influence a given market is likely to have on precious metals.
Simply put, there are no sure bets at this time as to how precious metals prices will move in relation to general stock market trends.
Much of the lack of clarity across the precious metals sector is related to risk/reward ratios. Sunshine Profits does not favor high risk moves regardless of the profit potential. We believe that speculative capital should be placed in the market when the risk/reward ratio is favorable.
The uncertainty of today is clearly visible when comparing the 10-day column with the 30-day column in this weeks matrix. It seems that an exact turnaround has taken place in how stocks relate to precious metals. This is quite unusual and increases the risk portion of the normal risk/reward ratio at least for the near-term.
So, at this point it might be best to turn directly to the chart of gold (charts courtesy of http://stockcharts.com).

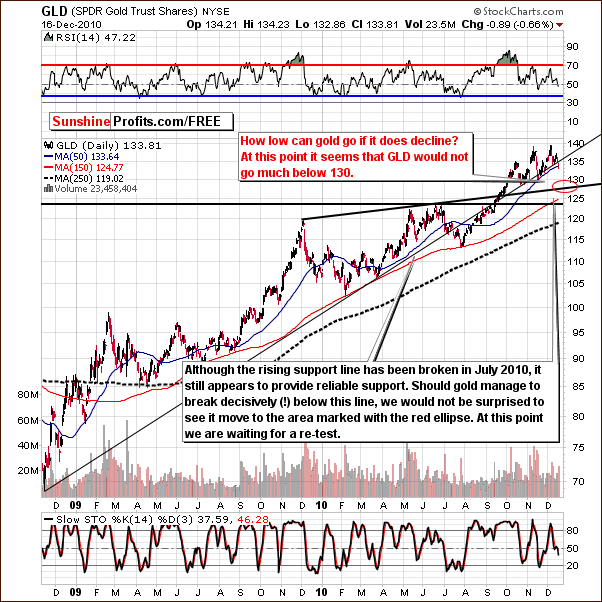
The long-term GLD ETF chart provides a closer look at the current position of golds price with respect to resistance and support levels. It can also be seen that when golds price declined several weeks ago, it was very quick and was ultimately stopped by the 50-day moving average and its rising support line.
History repeats itself to a considerable extent, so if we had a similar alignment of both support levels and price reached them after a sharp decline, with high probability of being correct we could state that the decline is over. However, at this time the 50-day moving average is below the rising support line, and even though broken though the latter it stopped at the former level (50-day MA). Moreover, the decline has not been rapid. Consequently, it is possible at this time that further declines may be seen.
Meanwhile, the big hero of the recent rally - silver - appears to have gotten ahead of itself. Of course, a correction in silvers price is healthy for the long-term strength of subsequent rallies. Furthermore, it provides investors an opportunity to add to long positions at lower price levels, long-term Investors should be on a constant lookout for such buying opportunities.

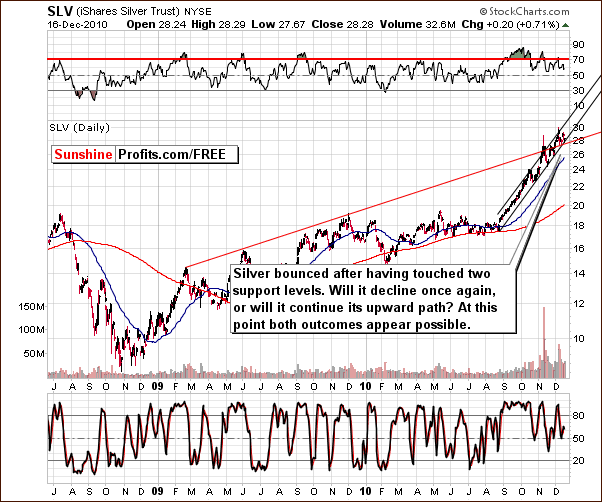
On the long-term above chart, some mixed signals are apparent. Silver has indeed held above the rising support level, the red line in our chart, and it remains within the rising trend channel. The latter is illustrated by the two parallel black lines in this weeks chart.
Conversely, note that silver has not been trading above the November intra-day high in recent days. It is perhaps likely that a decline below previous local bottoms could be seen in the near-term. Should that take place, the 50-day moving average will likely once again provide support.

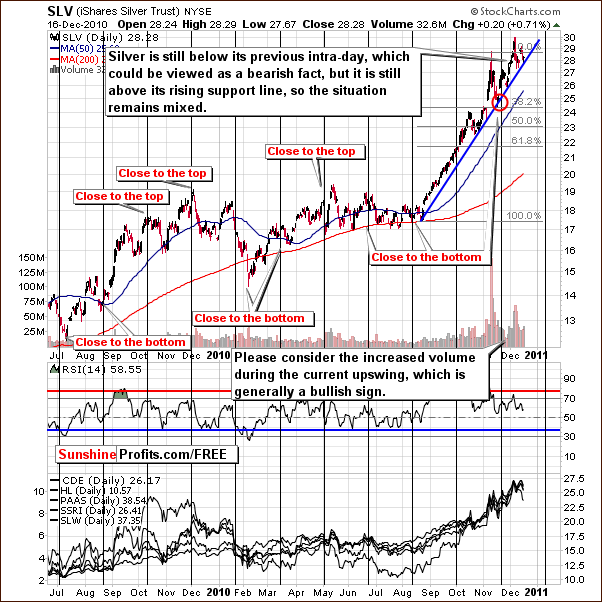
In the short-term chart this week, we see mixed signals one more time. Current price levels are slightly below previous intra-day highs (which is bearish for silver) and slightly above the rising support line (which is bullish).
Gold, silver and mining stocks normally tend to move in similar fashions, frequently reaching local tops and local bottoms together. It is important to watch gold and the other precious metals markets when investing in silver as they frequently impact silvers price directly.
Summing up, the long-term outlook for the white metal is bullish although the short-term appears unclear and very much mixed at this time - with a slight bearish bias. As the saying goes when in doubt, stay out. Any speculative positions in silver should be opened only by the most risk-tolerant Traders.
To make sure that you are notified once the new features are implemented, and get immediate access to my free thoughts on the market, including information not available publicly, I urge you to sign up for my free e-mail list. Sign up today and you'll also get free, 7-day access to the Premium Sections on my website, including valuable tools and charts dedicated to serious PM Investors and Speculators. It's free and you may unsubscribe at any time.
Thank you for reading. Have a great and profitable week!
P. Radomski
--
It takes some courage to go out on a limb and predict precious metal prices for 2011. This week we look at some of the predictions by brave analysts, examine some of the pitfalls that could await gold and its crazy little brother silver in the upcoming year, and make some predictions of our own.
Meanwhile, the short-term situation is still tense, and we feature many charts this week, in order to put it into proper perspective. We have analyzed the Euro and USD Indices (including the 20-year chart, which provides information relevant at this point), general stock market (whose rally did not correspond to analogous action in the metals), gold and silver (possible downside targets), and mining stocks (from both: short- and long-term perspective). We also comment on the recent changes in the correlation matrix and on yesterday's signal coming from one of our unique indicators.
Additionally, we explain the similarity between 2008 and today in silver (is this a double top?), PHPP precious metals fund, and junior's policy regarding pink sheets "listing". We encourage you to Subscribe to the Premium Service today and read the full version of this week's analysis right away.

