Visit our archives for more gold & silver articles.
We’re getting whiplash from all the political changes in Europe, neo-Nazis in an unstable government in Greece and a changing of the guard in France-- "adieu" to Nicolas Sarkozy. We see plenty of reasons for holding on to our long-term gold positions despite the clobbering the yellow metal got on Wednesday down to a four-month low. The euro tumbled this week against the dollar in the worst run since 2008. There is an intense resurgence of political risk in Europe and a couple of months of weak jobs numbers in the U.S. All that has put stimulus back on the table. Another item on the table is the risk of a Greek euro exit, which has risen to as high as 75 percent; according to Citigroup Inc. We also see a rising anti-austerity tide gaining ground in Europe and the abolishing of a gold excise duty in India, all favorable for gold.
Francoise Hollande has been elected France’s president, the first socialist president in almost two decades, on the promise that he would deliver an alternative to the austerity diet. The French have been wondering who had moved their high-calorie cheese. They have become tired of the message reiterated by Nicolas Sarkozy that painful choices and belt tightening will bring jobs and growth. Hollande takes power at a critical juncture for both France and Europe and he will have to deliver fast --no honeymoon vacation. France has a ten per cent unemployment rate and its labor costs are among the highest in the OECD. With a budget deficit for almost 40 years, France lost its triple A credit rating this year. The day after Hollande takes power next Tuesday, France must raise €12 billion on the markets. He then will have to convince German chancellor,Angela Merkel, who was cozy with Sarkozy, to renegotiate the European budget austerity pact to add measures on growth. Investors are worried about potential tension between Germany and France, the two eurozone heavyweights.
It is not likely that Germany will be willing to foot the bill for Hollande’s campaign promises.
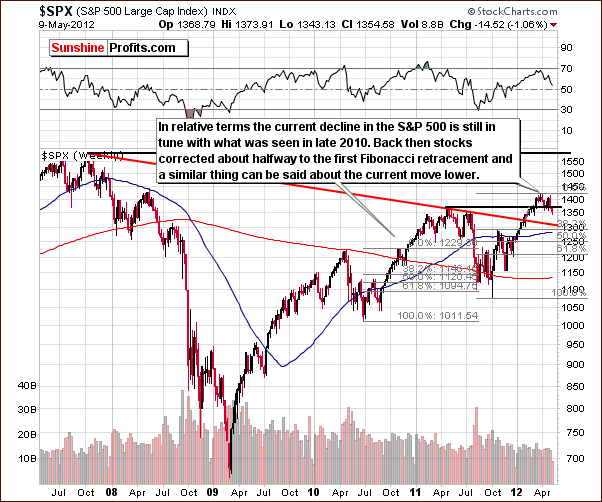
Having discussed the political factors driving the price of gold, let us now see how the markets can influence the yellow metal’s behavior in the days to come. We will start today’s technical part with analysis of the S&P 500 Index and begin with the long-term chart (charts courtesy by http://stockcharts.com.)

In the chart, we see that prices have moved below the support line created by the 2011 highs, which looks bearish. Taking a relative comparison to the similar rally that we saw in the second half of 2010 (more on that topic can be found in last week’s commentary) with the current price patterns, it seems quite possible that we could have simply seen a correction with a rally now to follow.
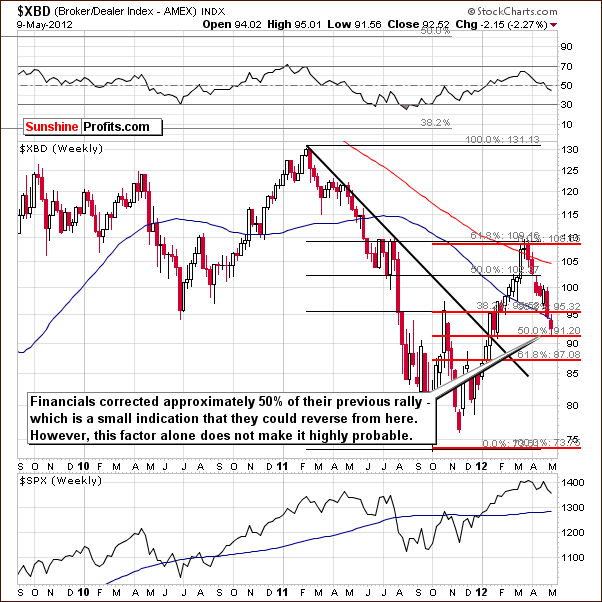
Let us now take a look at the financial sector.

In the Broker Dealer Index chart (a proxy for the financial sector), we do not have any clear “buy now” signals (based on this chart alone) but may have some confirmation here that a bottom has formed in the general stock market. This index bottomed at the 50% retracement level of its previous rally, something that could be expected during a correction (just like a bottom being formed with financial at other Fibonacci retracement levels, so, again, this is not a crystal clear buy signal).
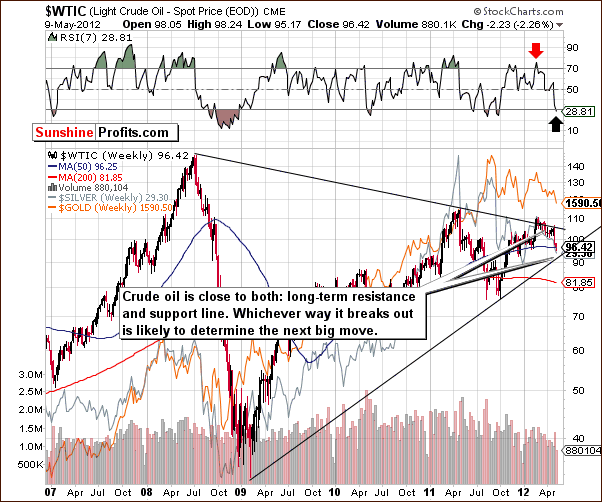
Let us now move on to the crude oil market and try to find out whether the black gold will have an impact on the real one’s future price.

Looking at the chart we see that prices have moved lower after trying to break out above the declining resistance line. Since that attempt, prices have declined and are now actually close to the long-term support line. RSI levels suggest that a rally is likely to begin sooner rather than later. Another small move to the downside may be seen, and a powerful upturn could follow. The situation will become clearer once oil price finally confirms either a breakout or a breakdown.
Overall, the signs here are blurry but favorable for gold in the short term, as the gold market has been generally aligned with the crude oil market this year. This is not necessarily true for the very short term, but the two markets were generally positive correlated lately and their overall directions are similar. The implications from the crude oil price chart are a bit more bullish for gold than not as the support line is closer than the resistance line and the RSI says “buy”.
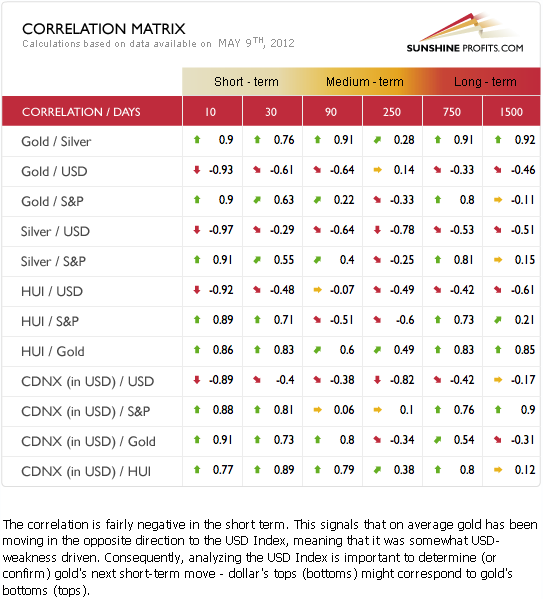
To finish off today’s essay let’s have a glance at our in-house developed tool that traces the intermarket dependencies.

The Correlation Matrix is a tool, which we have developed to analyze the impact of the currency markets and the general stock market upon the precious metals sector. This week we see that precious metals are negatively correlated with the USD Index and positively correlated with the general stock market. The outlook for the general stock market is more bullish than not, and the implications for precious metals are therefore more bullish than not as well.
Summing up, the situation in the general stock market is mixed for the long term and a bullish scenario seems a bit more likely than the bearish one for crude oil. The implications for gold based on the outlook for crude oil and the general stock market seem to be a bit more bullish than not at this time.
Thank you for reading.
P. Radomski
--
In yesterday's Market Alert we wrote that the closing prices will be very important in determining precious metals' next move. Today's Premium Update includes our latest comments on the extremely tense situation in gold, silver and mining stocks. We also mentioned that we received a lot of questions - consequently, today's issue includes a record number of replies. The end result is one of the most comprehensive and biggest Premium Updates in history. Among other things it includes the analysis of following issues:
- The political situation in Europe
- Long- and short-term USD picture (breakout?)
- S&P 500 Index
- DIA ETF (significant volume)
- The financial sector
- Crude oil price
- Precious metals correlations
- Long-term gold price chart (2008-like situation?)
- Short-term GLD ETF price chart (breakdown?)
- Gold:bonds ratio
- Non-USD gold price
- Gold priced in the Japanese yen
- Long-term silver chart
- SLV ETF chart (symmetrical pattern)
- Silver:gold ratio
- Long-term HUI Index chart
- Short-term GDX ETF chart
- Ratios featuring juniors (relative to other stocks and to senior miners)
- SP Gold Stock Extreme Indicator
- SP Gold Stock Extreme #2 Indicator
- Fundamental vs. technical aspects of mining stock investments
- Gold market sentiment
- SLV options
- Increased trading frequency
- "conservatism" and "loss aversion" biases
- CDNX H&S pattern
- Fed, JP Morgan and gold
- Chinese futures platform and silver
- 300-day MA breakdown
- Stop-loss orders in gold
- Price & time targets for gold, silver and mining stocks
We encourage you to Subscribe to the Premium Service today and read the full version of this week's analysis right away.

