Based on the September 30th, 2011 Premium Update. Visit our archives for more gold & silver articles.
Although we had described the fall in precious metals prices, we can understand the shock for those who had gotten used to the idea that gold prices only go in one directionup. A good metaphor here would be gold taking the stairs to go up, but the elevator to do down. Last Friday it was more like gold falling headlong down the elevator shaft with the worse one day drop in five years. It definitely got ugly, but thats normal. Its part of the game, part of the ride. Investors fled to the U.S. (fiat) dollar and to U.S. Treasuries (that just got downgraded last month by Standard & Poors.) Go figure! They have to settle their debt in dollars. The sharp decline was difficult to digest especially since we had come off a period in August where it seemed that gold could do no wrong. It shot up when markets plummeted, and shot up when markets soared.
On September 16th, 2011, we wrote the following regarding the following gold and silver correction:
( ) the situation in gold is bearish for the short term and is certainly more bearish than it [has] appeared [before]. Such a sentiment is now confirmed by the gold market. The current situation for silver is very much the same as it is for gold, which is quite bearish for the short term. Additional confirmation comes from the recent action in both the Euro Index and in the U.S. Dollar Index.
So just how far did gold fall? The high earlier in the month was $1,920 and on Monday morning gold touched $1,530, almost a $400 drop. Lets keep in mind that at the beginning of July gold was at $1,480, so even at the drop we were higher than we were at the beginning of July. Gold is still up about 14% YTD.
The plunge brought the Gold Bubble crowd out of the wood work and with much joy, glee and self-satisfaction they proclaimed that they were right all along and the gold bubble is over.
They have said this every time that precious metals corrected.
There is no doubt that like everything else, the bull run in gold will eventually come to an end, but were still a long way off. We see the sharp decline as an opportunity rather than a warning. It is a good time, for those who wished all along that they had bought gold, to do it on dips. Nothing that has taken place over the past weeks lessens our long-term optimism about gold. The same fundamentals are still in place. The situation in Europe continues to deteriorate daily. Greece is on the cusp of default and larger EU members look sure to follow. Meanwhile, political gridlock is the situation in Washington and QE III is coming, and with it, further decline in the purchasing power of the dollar (not necessarily right away, of course). The Swiss National Bank just instituted a peg with the Euro to slow down inflows of global investors seeking a safe haven costing franc holders 25% of their position in the course of a week. Central banks are still buyers and not sellers of gold.
So to see what kind of a roller coaster ride we can anticipate in the near future, we will now take you to this week's technical part. We will start with analysis of the long-term Euro Index chart (charts courtesy by http://stockcharts.com.)

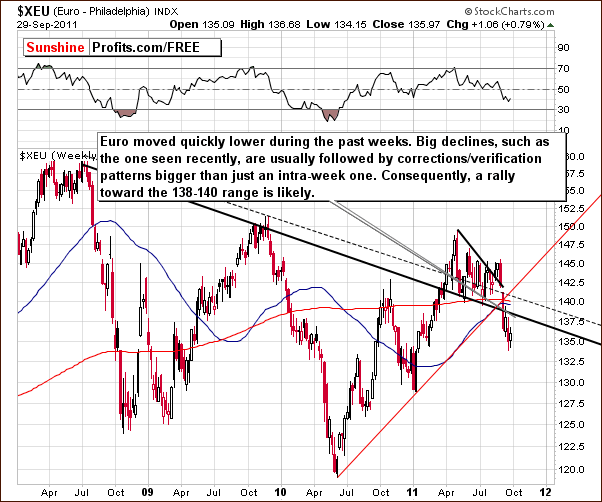
In this weeks long-term Euro Index chart, we clearly see that drastic declines have taken place in the past few weeks following a failed breakout attempt. Now the Index has paused and the breakdown below several support levels is likely to be verified. These levels will then provide resistance.
The intraday pullback that weve seen a few weeks ago does not appear to be enough to cool the emotions of Investors and Traders given the size of the previous decline. It seems likely that the index will retest the previous support levels and a rally to the 138 to 140 trading range is possible.

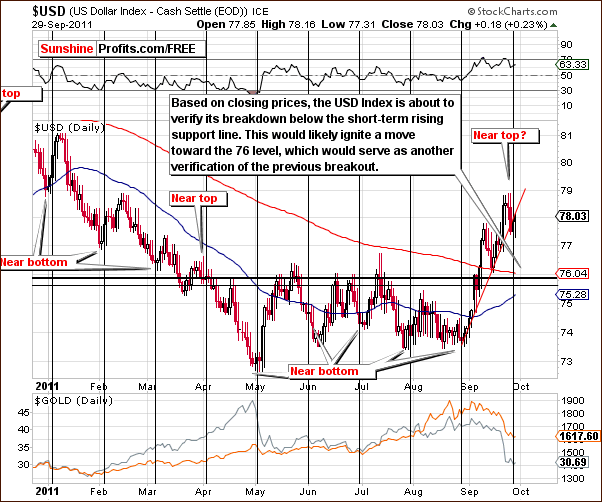
In the short-term USD Index chart, we see that a consolidation has begun and lower values will likely be seen over the next week or so. This appears particularly likely if we study the cyclical tendencies of this index. With a turning point in play, the suggestion is that the dollar will likely move lower for a short period of time before moving higher once again.
Concerning the rising short-term support level, we see a breakdown which is now being verified. Again, if and when this verification is complete, further declines could be seen for a short time with a likely downside target level close to 76. A continuation of the rally then appears probable.

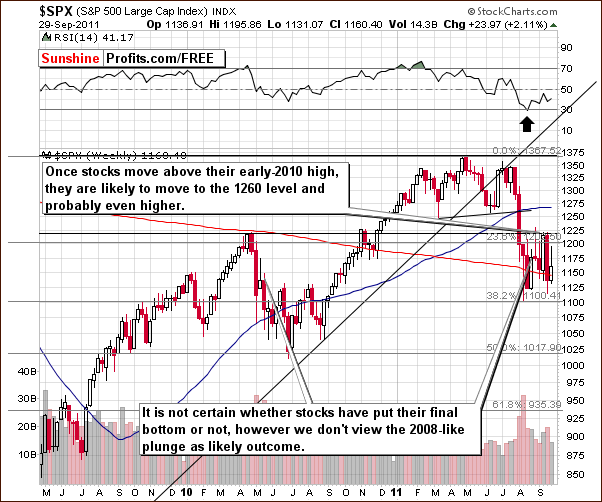
In the medium-term S&P 500 Index chart, the situation remains unchanged. For the past few weeks, weve seen the main stock indices basically trade sideways and at this time it is uncertain if the final bottom is in. This does appear likely to be the case, but even if its not, additional declines from here will not likely be major.

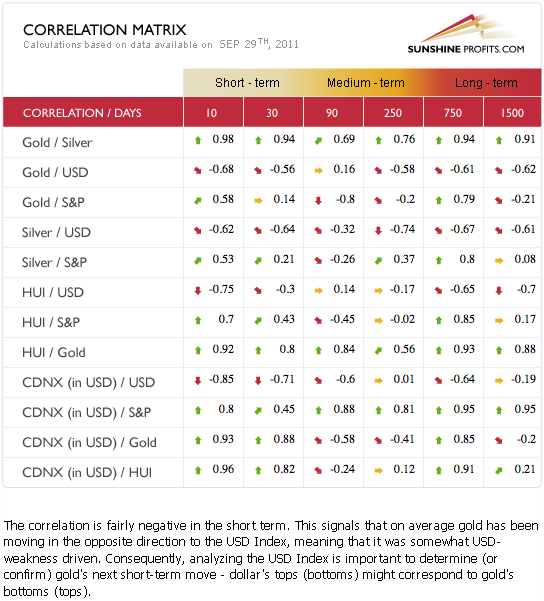
In this weeks Correlation Matrix, we can see that stocks do not appear to have much influence on the precious metals sector in the short term anymore. The long-term impact of the USD Index with respect to gold, silver and the gold mining stocks is beginning to be seen in the short term section as well. This tendency is visible in the coefficient values. Consequently, what we stated in the currency section this week is quite important for precious metals Investors and has bullish implications for the sector overall.
Summing up, a short-lived correction in the dollar is likely to be seen. This would likely have positive implications across the precious metals sector. The situation appears slightly more bullish for stocks than not, although this does not have to negatively influence precious metals as the correlation between stocks and precious metals is rather weak at the moment.
To make sure that you are notified once the new features are implemented, and get immediate access to my free thoughts on the market, including information not available publicly, we urge you to sign up for our free e-mail list. Sign up for our gold & silver mailing list today and you'll also get free, 7-day access to the Premium Sections on my website, including valuable tools and charts dedicated to serious PM Investors and Speculators. It's free and you may unsubscribe at any time.
Thank you for reading. Have a great weekend and profitable week!
P. Radomski
--
Today' Premium Update includes an extensive (26 charts/tables) discussion of the current situation in the precious metals sector. What should Traders do? How should Investors position themselves? Answers to both questions are supported by multiple factors and charts. In this week's issue we covered the following:
- Long-term bond yields
- Euro's breakdown
- Cyclical tendencies for USD and silver
- Gold vs. USD
- General stock market
- Precious metals correlations
- Gold, silver and mining stocks bottoms?
- Gold seen from non-USD and yen perspectives
- Gold:Silver Ratio
- Platinum
- XAU and HUI Indices
- Gold Miner's Bullish Percent Index
- SP Gold Bottom Indicator
- SP Gold Stock Extreme Indicator
- SP Gold Stock Extreme Indicator
- SP Short Term Gold Stock Bottom Indicator
- SP Junior Long-term Indicator
- GDXJ:GDX ratio
- Is 2008-like crash in the cards?
- ... and more
Additionally, this week's Premium Update includes our up-to-date top gold & silver junior rankings
We encourage you to Subscribe to the Premium Service today and read the full version of this week's analysis right away.

