Based on the December 2nd, 2011 Premium Update. Visit our archives for more gold & silver articles.
It may take some time for people to figure this out, but the problem in Europe is not liquidity. The problem in Europe is sovereign debt. If we are over our heads with debt because we have spent more than we make, giving us a line of credit will not get us out of the hole. One wonders if any amount of funding support and bailouts will be enough to restore confidence as long as there are lingering doubts about the solvency of Italy, Spain and some of the other eurozone economies.
The EU crisis seems to have reached a worrying new stage, with the flop of the German bond auction and the alarming rise in short-term rates in Spain and Italy. This is a massive erosion of trust, a veritable creeping crisis of credibility, as it spread to France, Belgium, the Netherlands and Austria. Many took Italys disastrous bond auction on November 25th as a signal that time is running out. Italy sold 6-month bills at a rate of 6.504%, a 14-year high and nearly double the 3.535% rate it received from a similar auction last month.
If you recall what we wrote in our last essay on gold and the stock market on December 2nd, 2011 youll surely appreciate the gravity of the situation:
( ) the Fed will be handing money to other global central banks at a lower rate than in the past and those central banks, in turn, will be able to lend the dollars to banks in their own countries. The hope behind this move is that it will prevent Europes financial woes from undermining the stability of the global banking system.
The importance of the EU crisis was underlined last week when the Organization for Economic Cooperation and Development said the euro crisis remained a key risk to the world economy. The Paris-based research group sharply cut its forecasts for wealthy Western countries and cautioned that growth in Europe could come to a standstill. It warned that the problems that started in Greece almost two years ago would start to infect even rich European countries.
Some international companies are already preparing contingency plans both financial and legal for a possible eurozone breakup, according to the Financial Times.
The general opinion of dozens of business executives interviewed by the Financial Times this month is that although a eurozone break-up would be both undesirable and fiendishly difficult to plan for, to cross ones fingers and hope for the best is emphatically no longer an option.
Apocalyptic visions considered in boardrooms across Europe range from bank failures and the collapse of credit to the destruction of the EUs single market, mass social unrest and a recession or worse. Even the most benign of that range of outcomes would have repercussions well beyond the eurozone making the issue one of consequence to businesses and government officials worldwide.
Having considered these apocalyptic long-term visions, lets focus on gold in the short term (charts courtesy by http://stockcharts.com.)
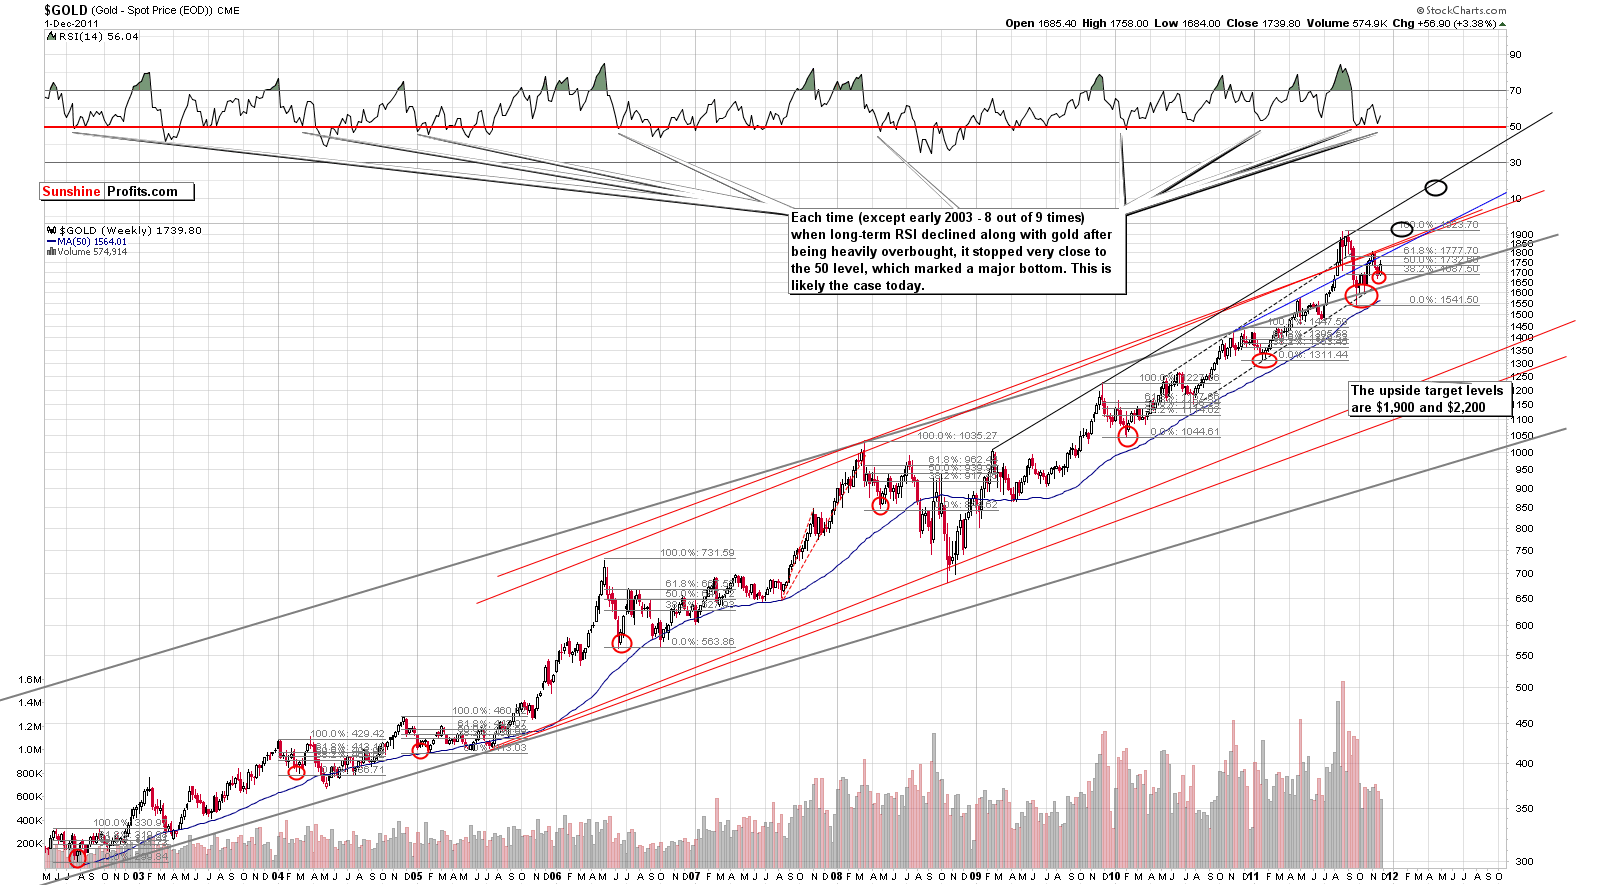
We begin with a look at the long-term gold chart (if youre reading this essay at www.sunshineprofits.com you may click on the above chart to enlarge it). RSI levels have bottomed close to the 50 level and are now on the way back up. In 8 of the 9 previous times this level was reached, it coincided with an important bottom for gold, and a significant rally followed. The long-term implications here are bullish based on this.
Two upside target levels appear to be valid at this time. One is at the $1,900 level and could be reached late this year or early in 2012. The second target level could be described as a rough estimate or best guess at this time. It is at the $2,200 level and could be reached sometime around May of next year. Note that the situation may change before these targets are reached we report what we believe is likely based on the information available today.
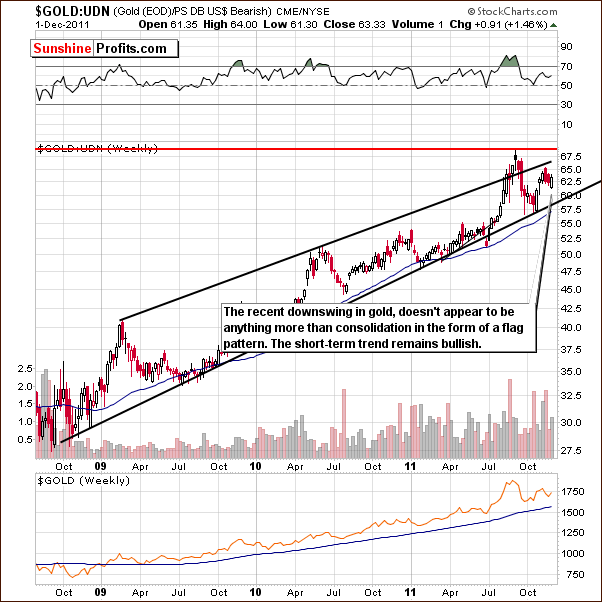
In the long-term chart of gold from a non-USD perspective, we see that prices have rallied sharply over the past few weeks and recently corrected in a sort of flag pattern. The rally appears ready to continue with a likely target level in the range of the previous high. This level could be surpassed, but its likely that first a pause will be seen when this trading range is reached.
Now, lets discuss the possible action in silver.
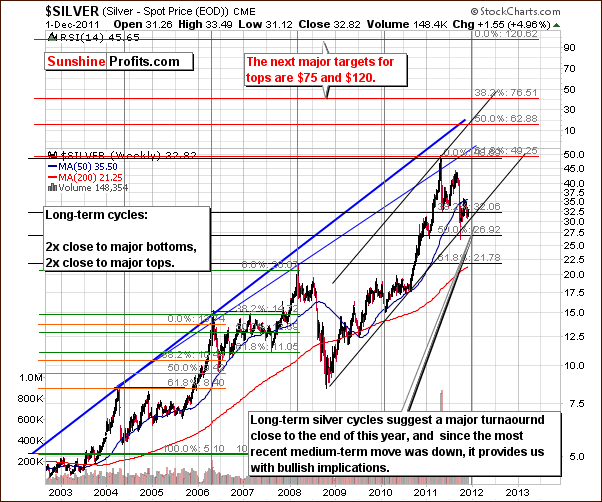
We begin with a look at the very long-term chart. The five vertical grey lines represent cyclical turning points roughly 2 years apart and they correspond to major tops or bottoms. The tops were seen in 2006 and 2008 with bottoms reached in 2004 and 2010. The cyclical turning point in play now is more likely to coincide with another bottom. This means that a major rally could be just ahead.
Long-term target levels for silver based on the phi number (1.618) are at $75 and $120. These are long-term target levels, however. Please examine how reliable were the previous tops estimates based on analogous approach. Again, much can change before these levels are approached, but right now, they appear quite probable in the coming years.
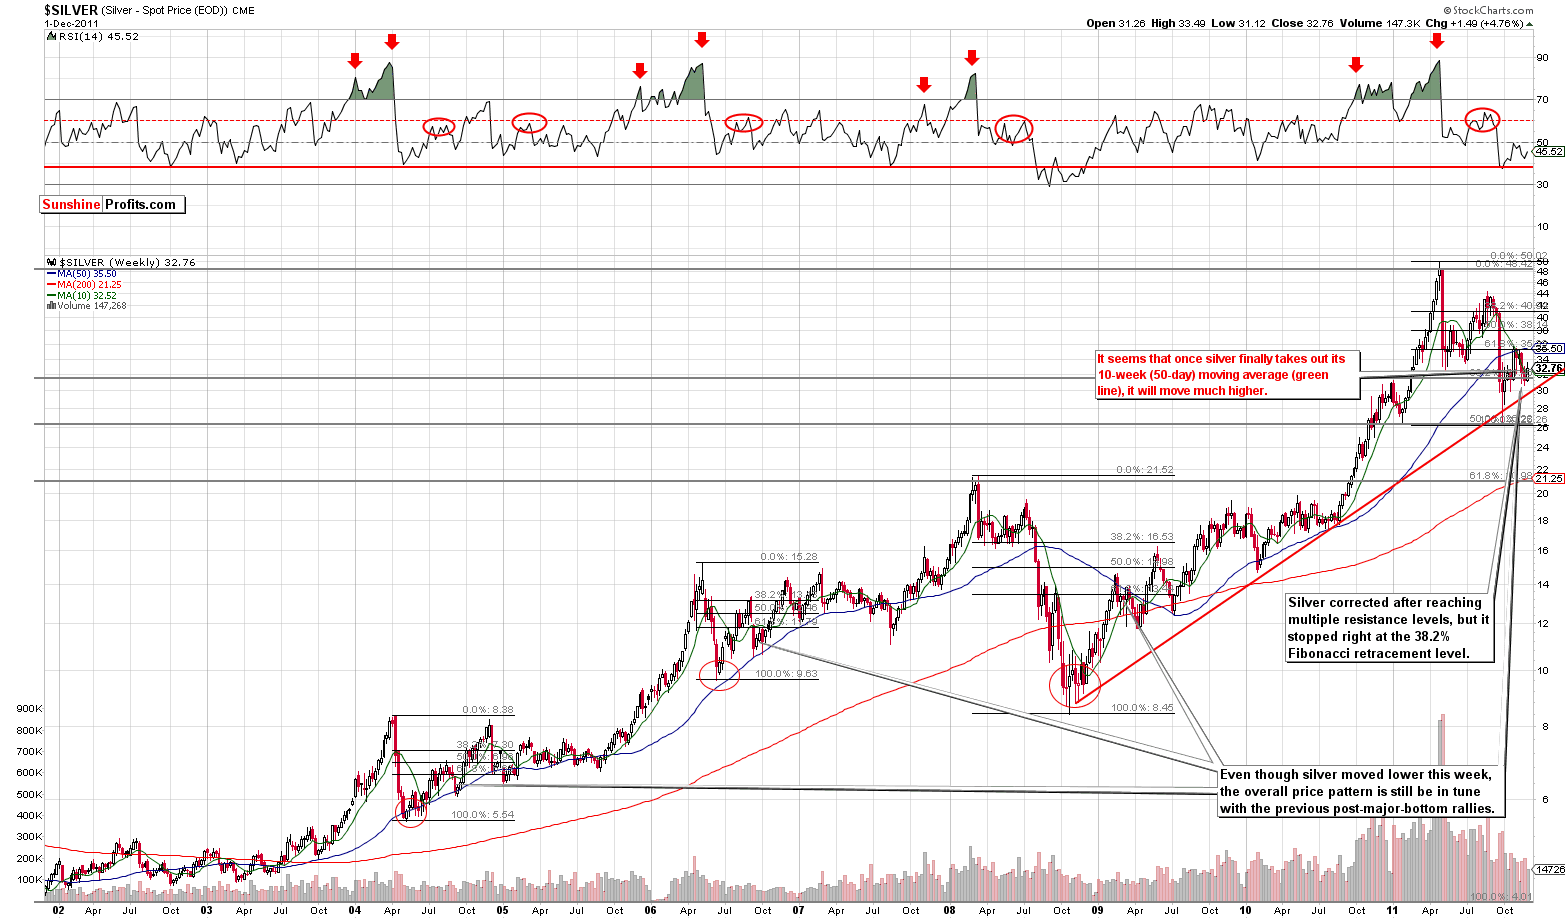
In the long-term chart for silver (if youre reading this essay at www.sunshineprofits.com you may click on the above chart to enlarge it), we can see a struggle to move above the 50-day (10-week) moving average. This level has previously provided both support and resistance, and once it is taken out and the breakout verified, a considerable move to the upside is likely.
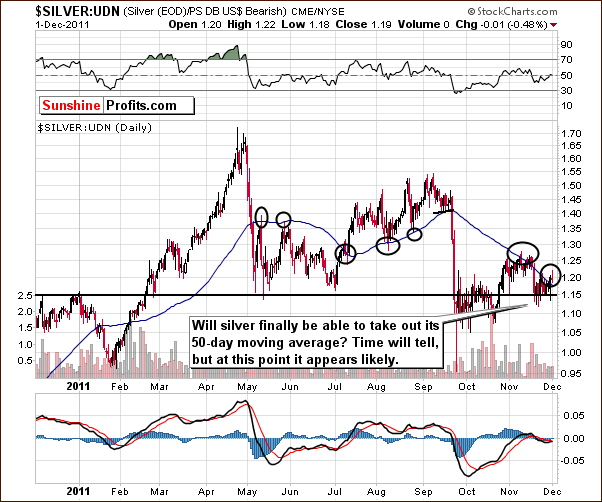
We now look at silver from a non-USD perspective. The 50-day moving average is once again in play here and has provided both support and resistance in the past. The index level is now slightly above this resistance line but we would prefer the move to be a bit more visible before concluding that the breakout is verified. It seems likely that significantly higher prices will follow such a confirmation.
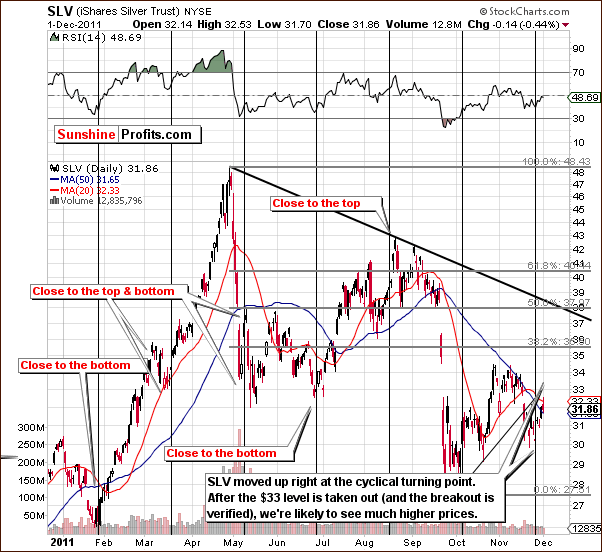
In the short-term SLV ETF chart, we can see that silver rallied sharply right at the recent cyclical turning point. The 50-day moving average is once again in play here, and a verified move above it will make a significant move to the upside quite probable. Target levels at this time appear to be at the $38, which corresponds to around $40 for spot silver.
Summing up, the situation remains bullish for gold and silver in the short, medium and long term. At this time, analysis of the long-term cycles for the white metal strongly supports a bullish scenario.
In order to make sure that you are notified as soon as anything changes - related to the long- and short-term targets for gold and silver, please join our Subscribers, who already receive immediate updates (Market Alerts) as often as the situation requires and in-depth Premium Updates every week. Once you proceed, you will also gain access to all of our interactive tools and proprietary indicators.
Thank you for reading. Have a great week!
P. Radomski

