Earlier this week, the Australian dollar extended losses against its U.S. counterpart, which pushed AUD/USD under the lower border of the rising wedge. How will this drop affect the exchange rate future moves?
In our opinion the following forex trading positions are justified - summary:
- EUR/USD: short (a stop-loss order at 1.1505; the initial downside target at 1.1009)
- GBP/USD: short (a stop-loss order at 1.3232; the initial downside target at 1.2375)
- USD/JPY: long (a stop-loss order at 111.67; the initial upside target at 114.87)
- USD/CAD: none
- USD/CHF: none
- AUD/USD: short (a stop-loss order at 0.7724; the initial downside target at 0.7473)
EUR/USD
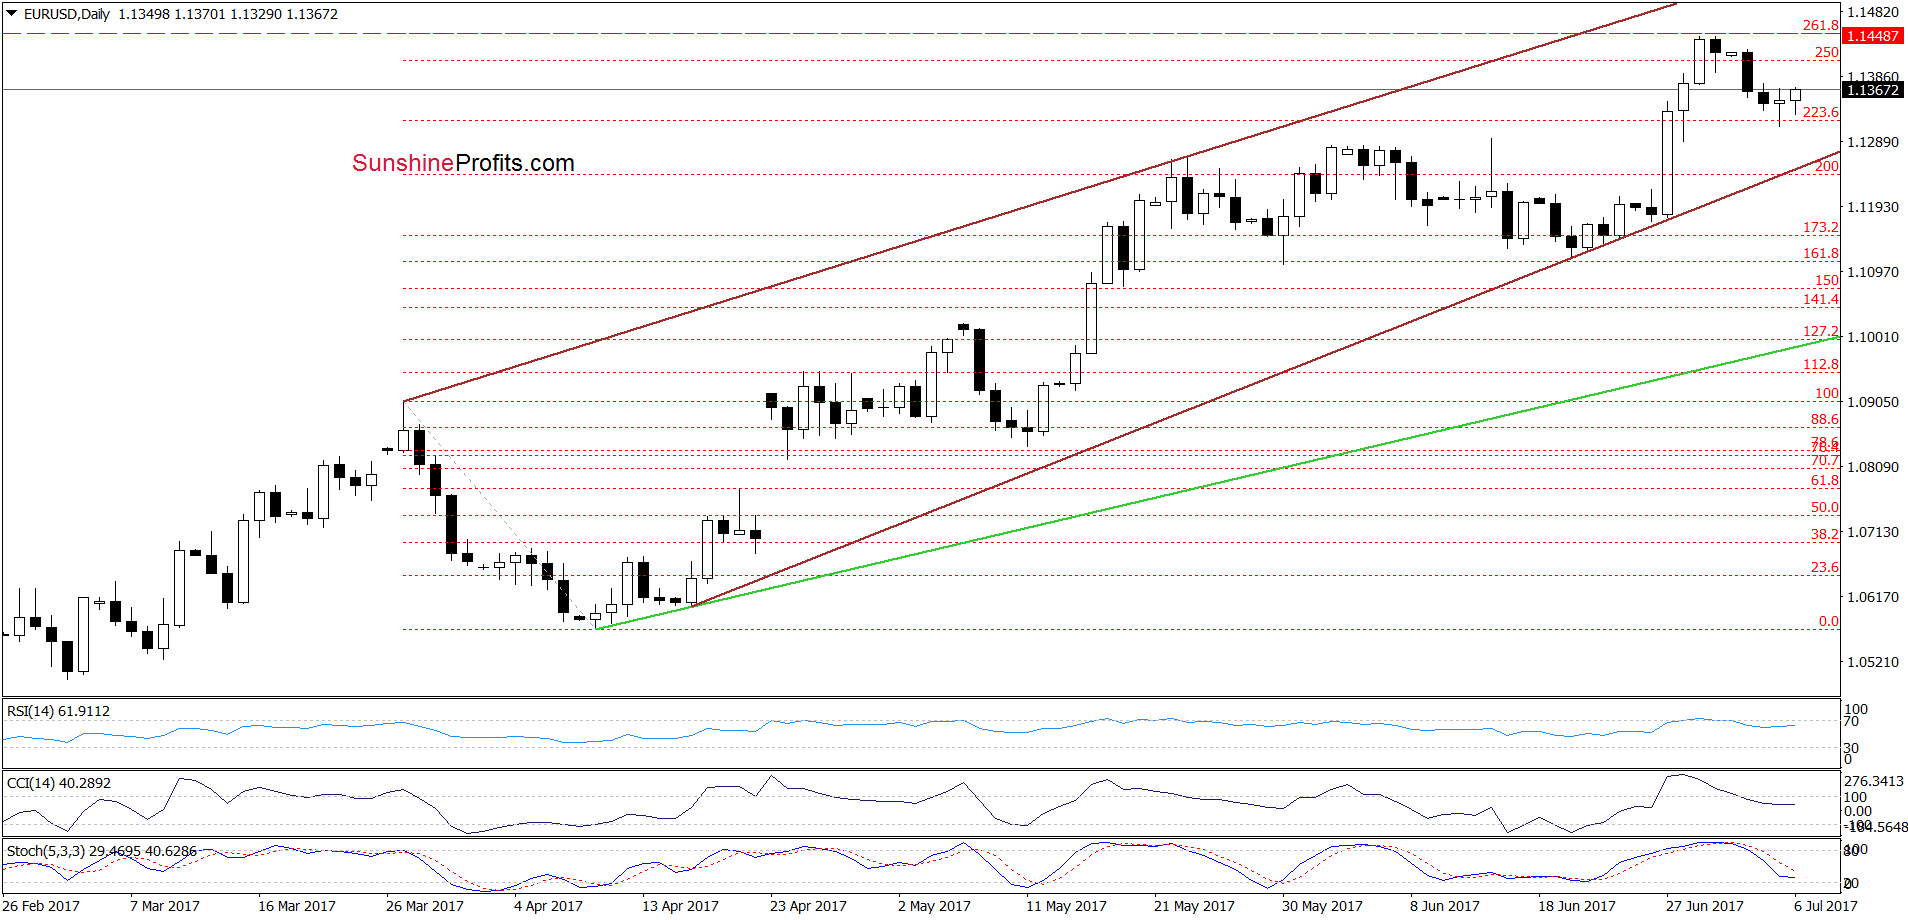
Looking at the daily chart, we see that EUR/USD moved a bit higher earlier today. But did this increase change anything in the short-term picture of the exchange rate? In our opinion, it didn’t. Why? Firstly, the sell signals generated by the daily indicators remain in play, supporting currency bears. Secondly, the pair is still trading under the 261.8% Fibonacci extension. Thirdly, when we take a look at the weekly chart below, we’ll see that the long-term red resistance line based on the August 2015 and May 2016 peaks continues to keep gains in check. Additionally, EUR/USD remains below the red horizontal resistance line, which means that what we wrote yesterday remains up-to-date also today:
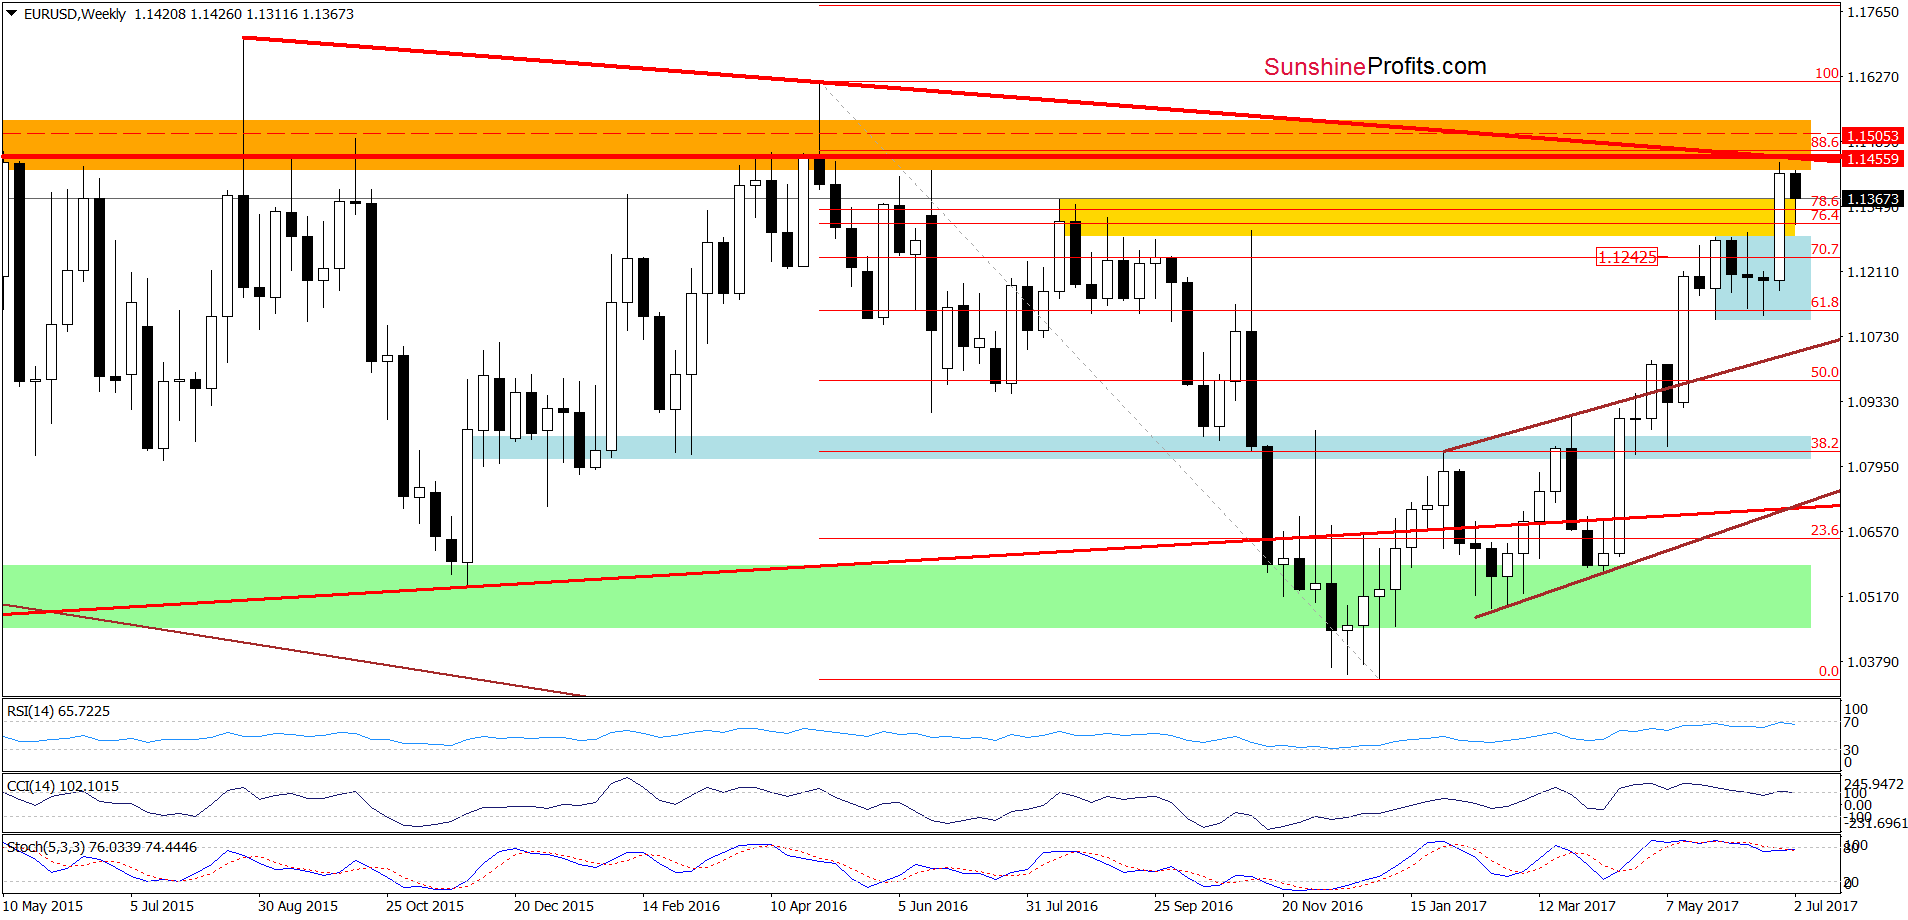
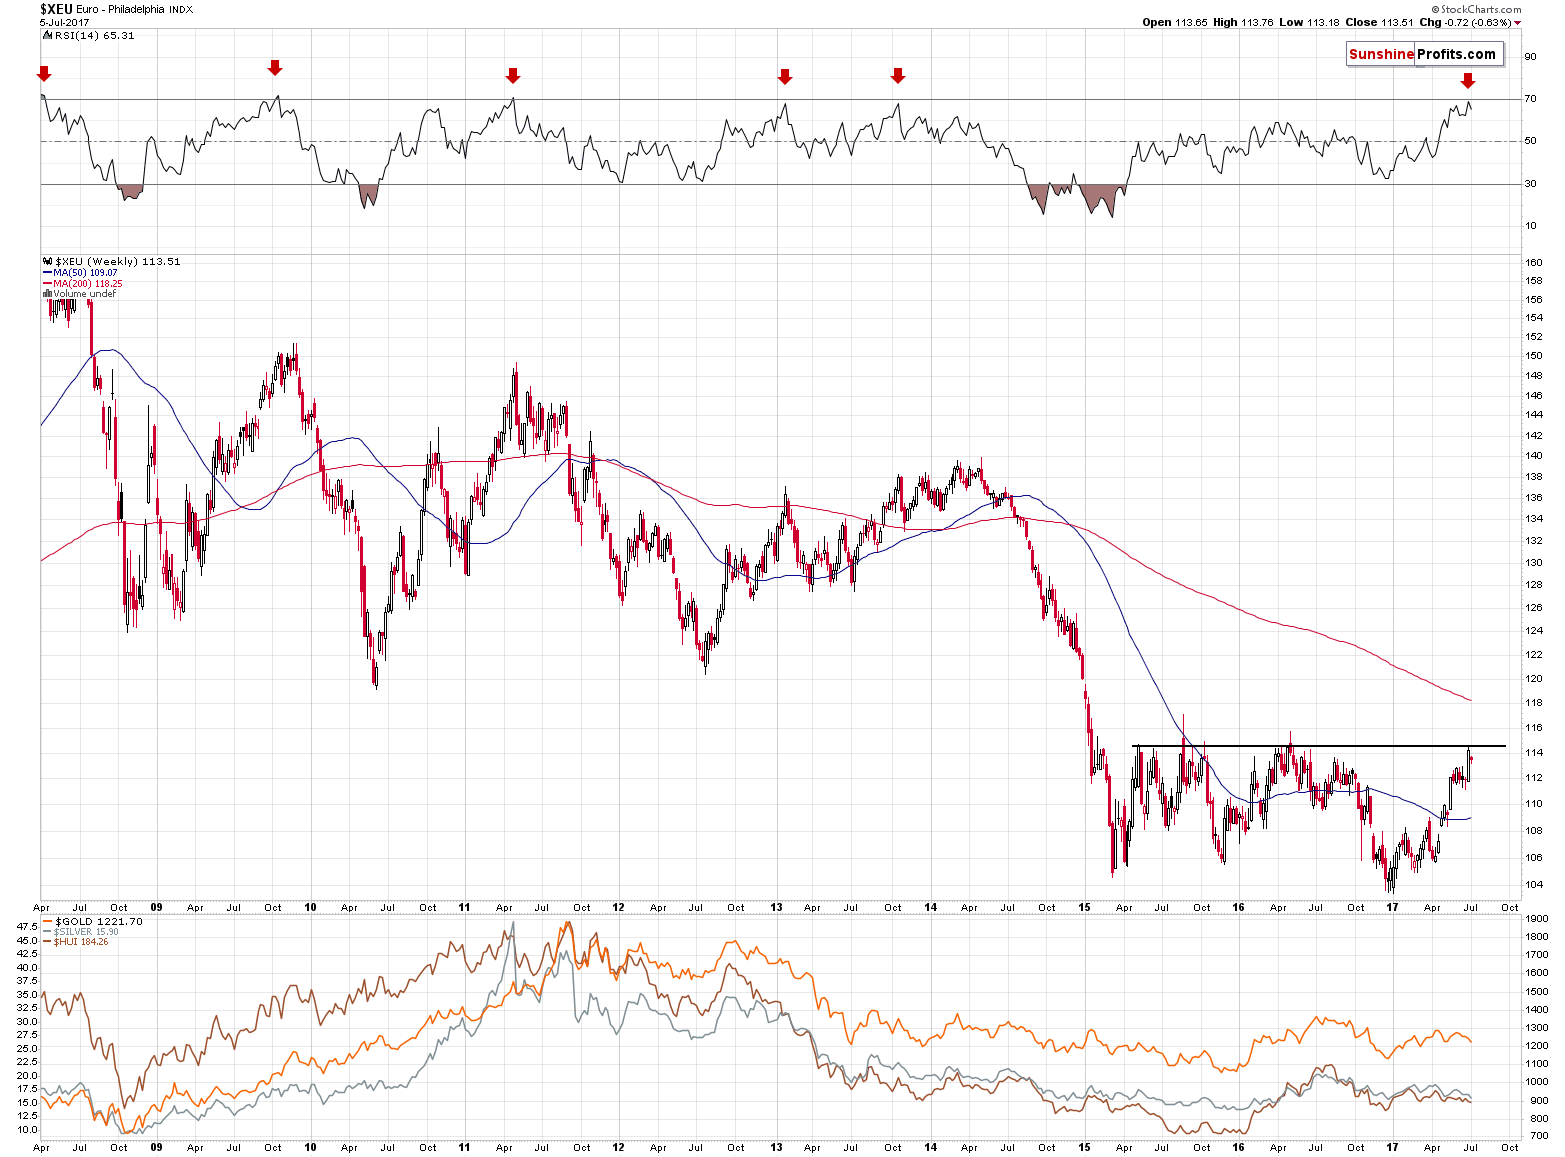
(…) it strongly appears that the euro has either reached its top or is about to do so shortly (perhaps today). The horizontal resistance line that you can see on the above chart is based on the highest weekly closes of the previous years. The weekly closing prices are the key closes to keep in mind in the case of bigger trends and the level that was just reached stopped the rally twice. There were temporary moves above it, but they all were very temporary. Since the week is ending today, it appears that the top is in or that we will see only a temporary upswing and a weekly close back at/below the resistance line.
A strong bearish confirmation comes from the RSI indicator – practically in all recent cases (the last 9 years), the readings of the RSI that were as high as the current ones meant that the euro was going to reverse shortly.
So, despite the bullish action [last] week, the outlook for the euro is actually very bearish and the chart is quite clear about that.
Monday’s session seems to have confirmed the above – the Euro Index declined, just like it did previously when it approached similar price levels in terms of the weekly closing prices. The outlook remains strongly bearish – it seems that another sizable decline has already started.
Very short-term outlook: bearish
Short-term outlook: mixed with bearish bias
MT outlook: mixed
LT outlook: mixed
Trading position (short-term; our opinion): Short positions with a stop-loss order at 1.1505 and the initial downside target at 1.1009) are justified from the risk/reward perspective. We will keep you informed should anything change, or should we see a confirmation/invalidation of the above.
GBP/USD
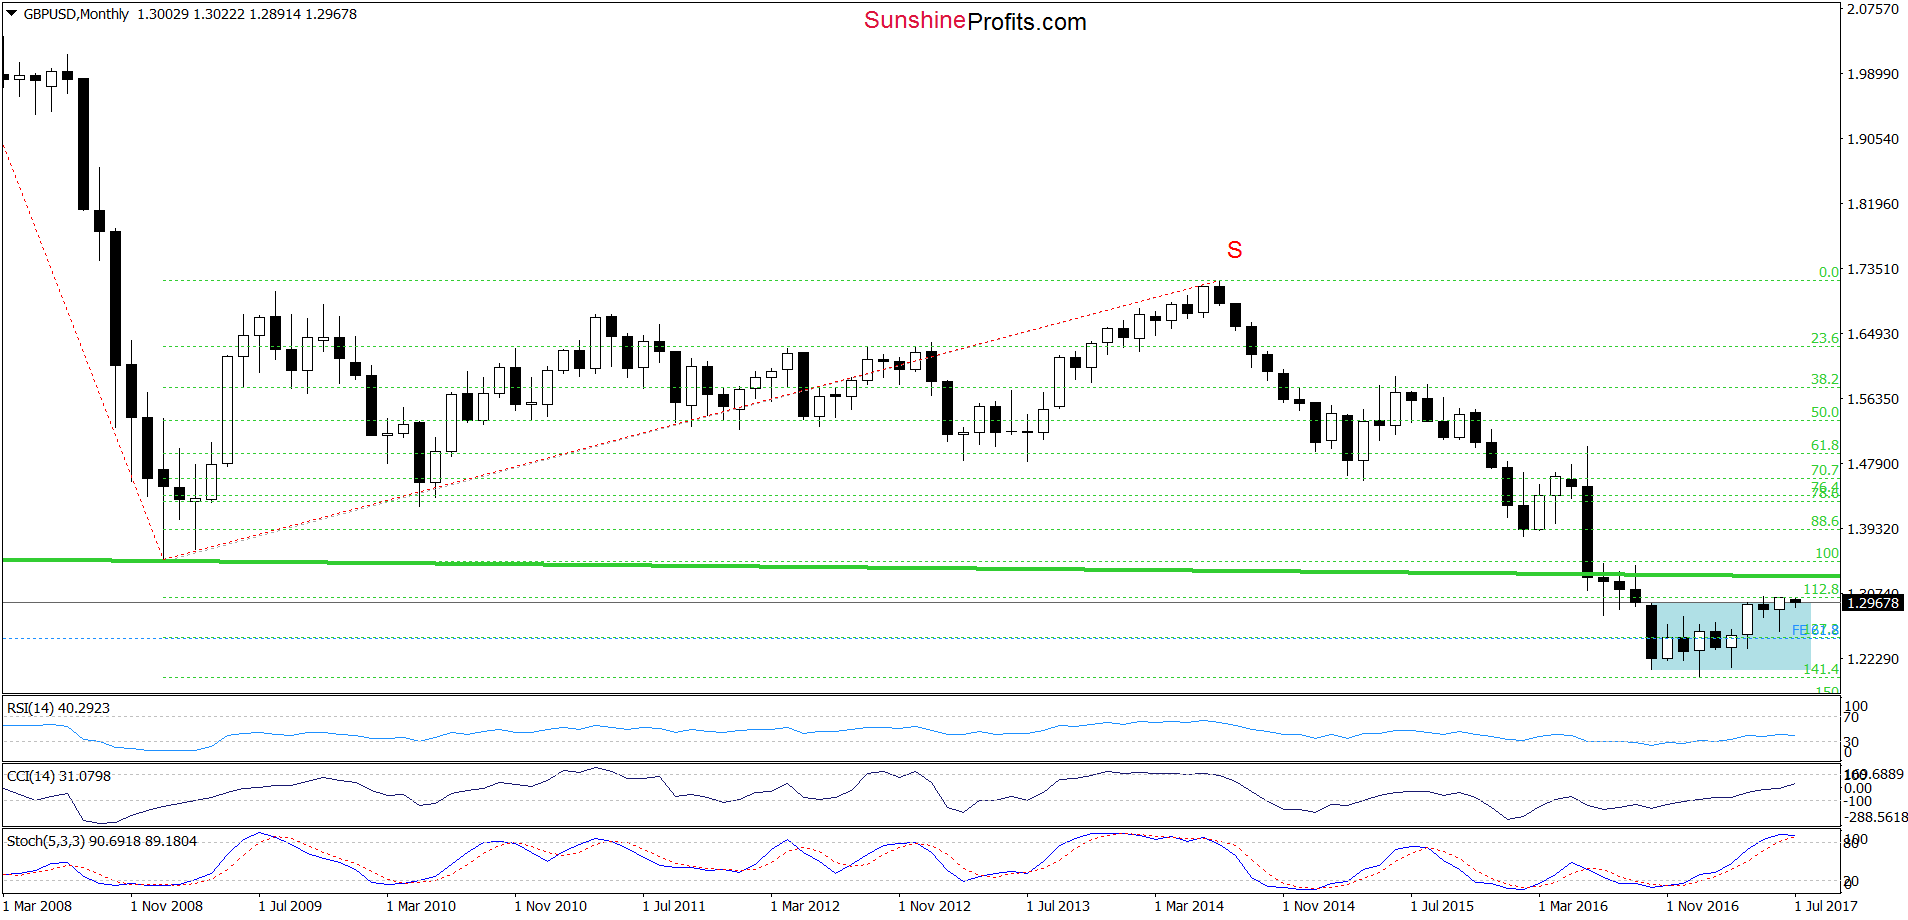
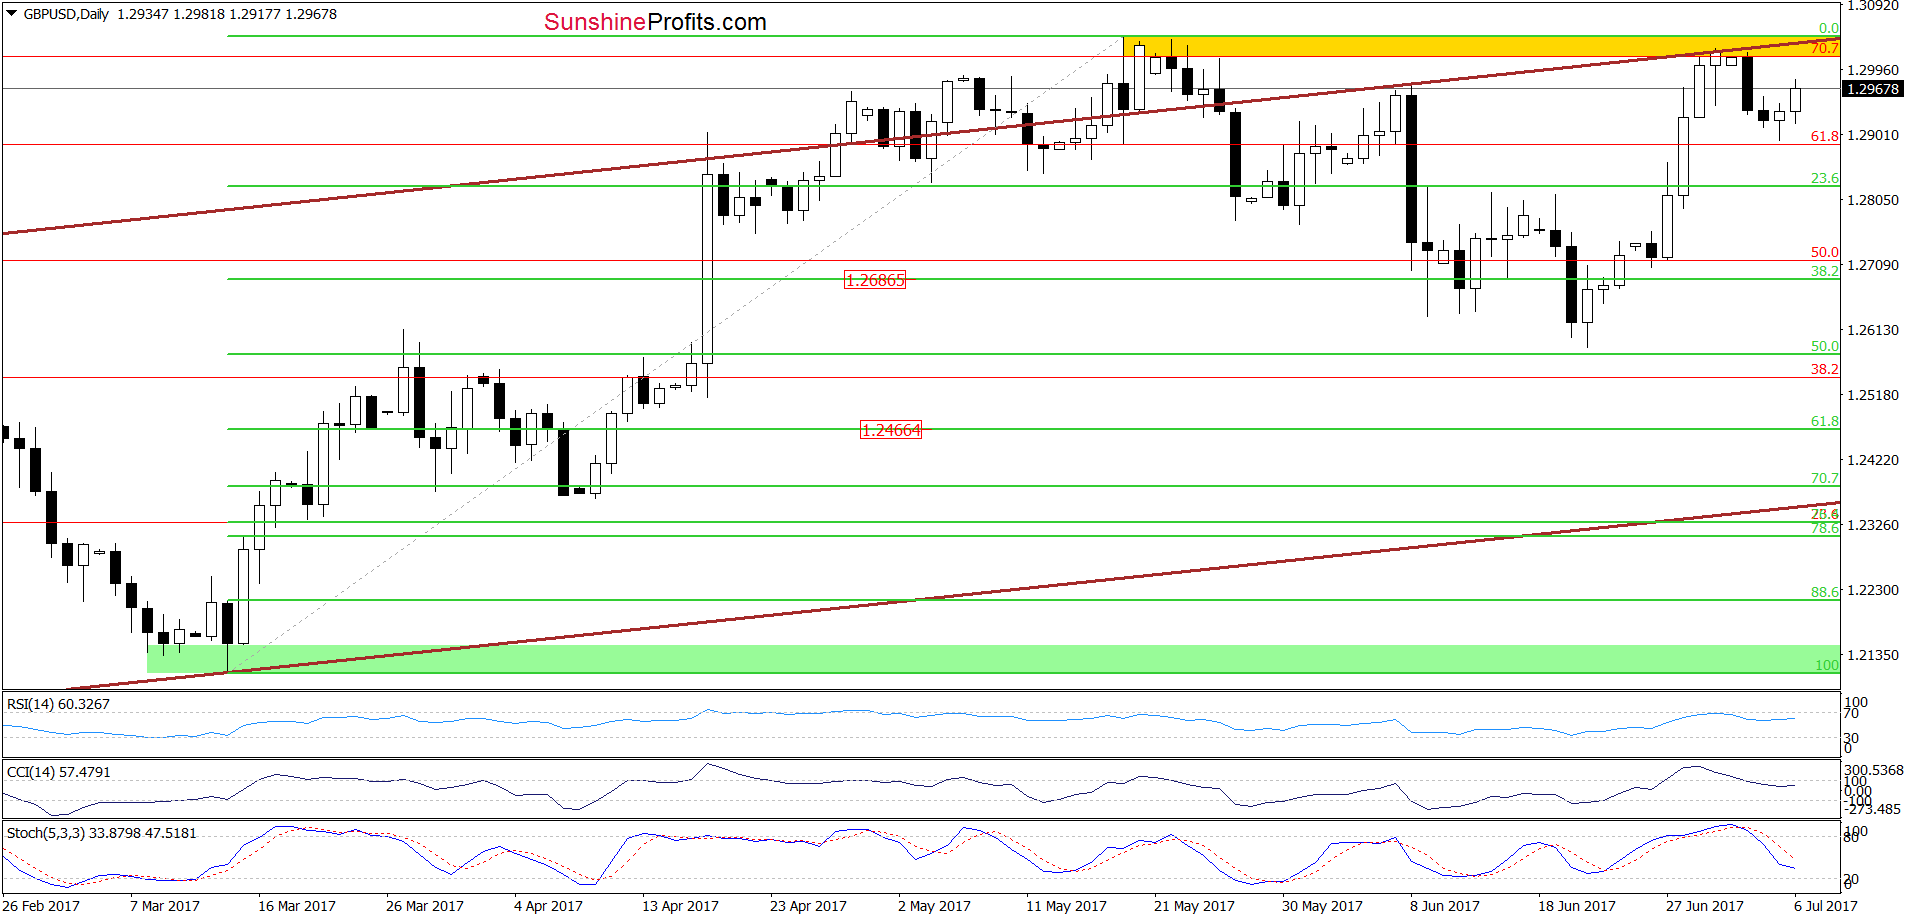
From today’s point of view, we see that the upper border of the brown rising trend channel together with the yellow resistance zone encouraged currency bears to act, which resulted in a pullback. Additionally, the sell signals generated by the CCI and the Stochastic Oscillator remain in cards, supporting currency bears and suggesting lower values of GBP/USD. If this is the case and GBP/USD declines from current levels, we’ll see a drop to around 1.2686 (the 38.2% Fibonacci retracement) in the coming week.
Very short-term outlook: bearish
Short-term outlook: mixed with bearish bias
MT outlook: mixed with bearish bias
LT outlook: mixed
Trading position (short-term; our opinion): Short positions (with a stop-loss order at 1.3232 and the initial downside target at 1.2375) are justified from the risk/reward perspective. We will keep you informed should anything change, or should we see a confirmation/invalidation of the above.
AUD/USD
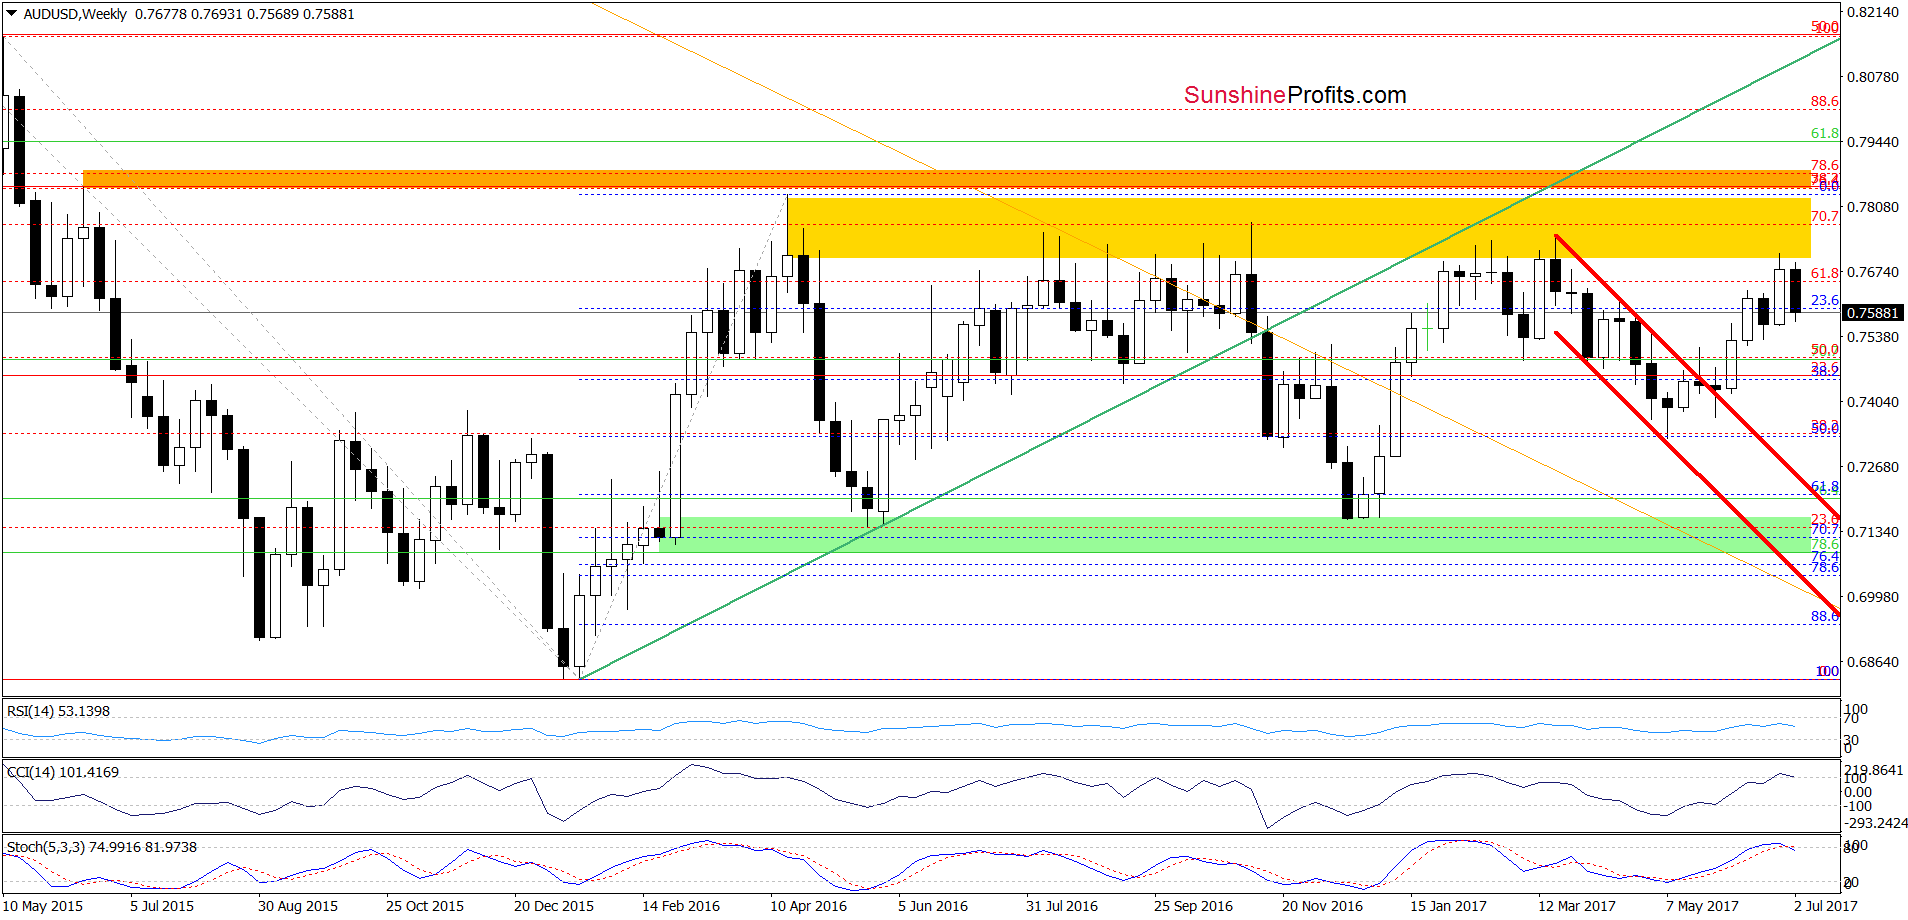
Looking at the weekly chart, we see that the yellow resistance zone stopped currency bulls once again and triggered a pullback earlier this week. Additionally, the Stochastic Oscillator generated the sell signal, while the CCI is very close to doing the same, which suggests further deterioration in the coming week(s).
How did this week’s decline affect the very short-term picture? Let’s examine the daily chart and find out.
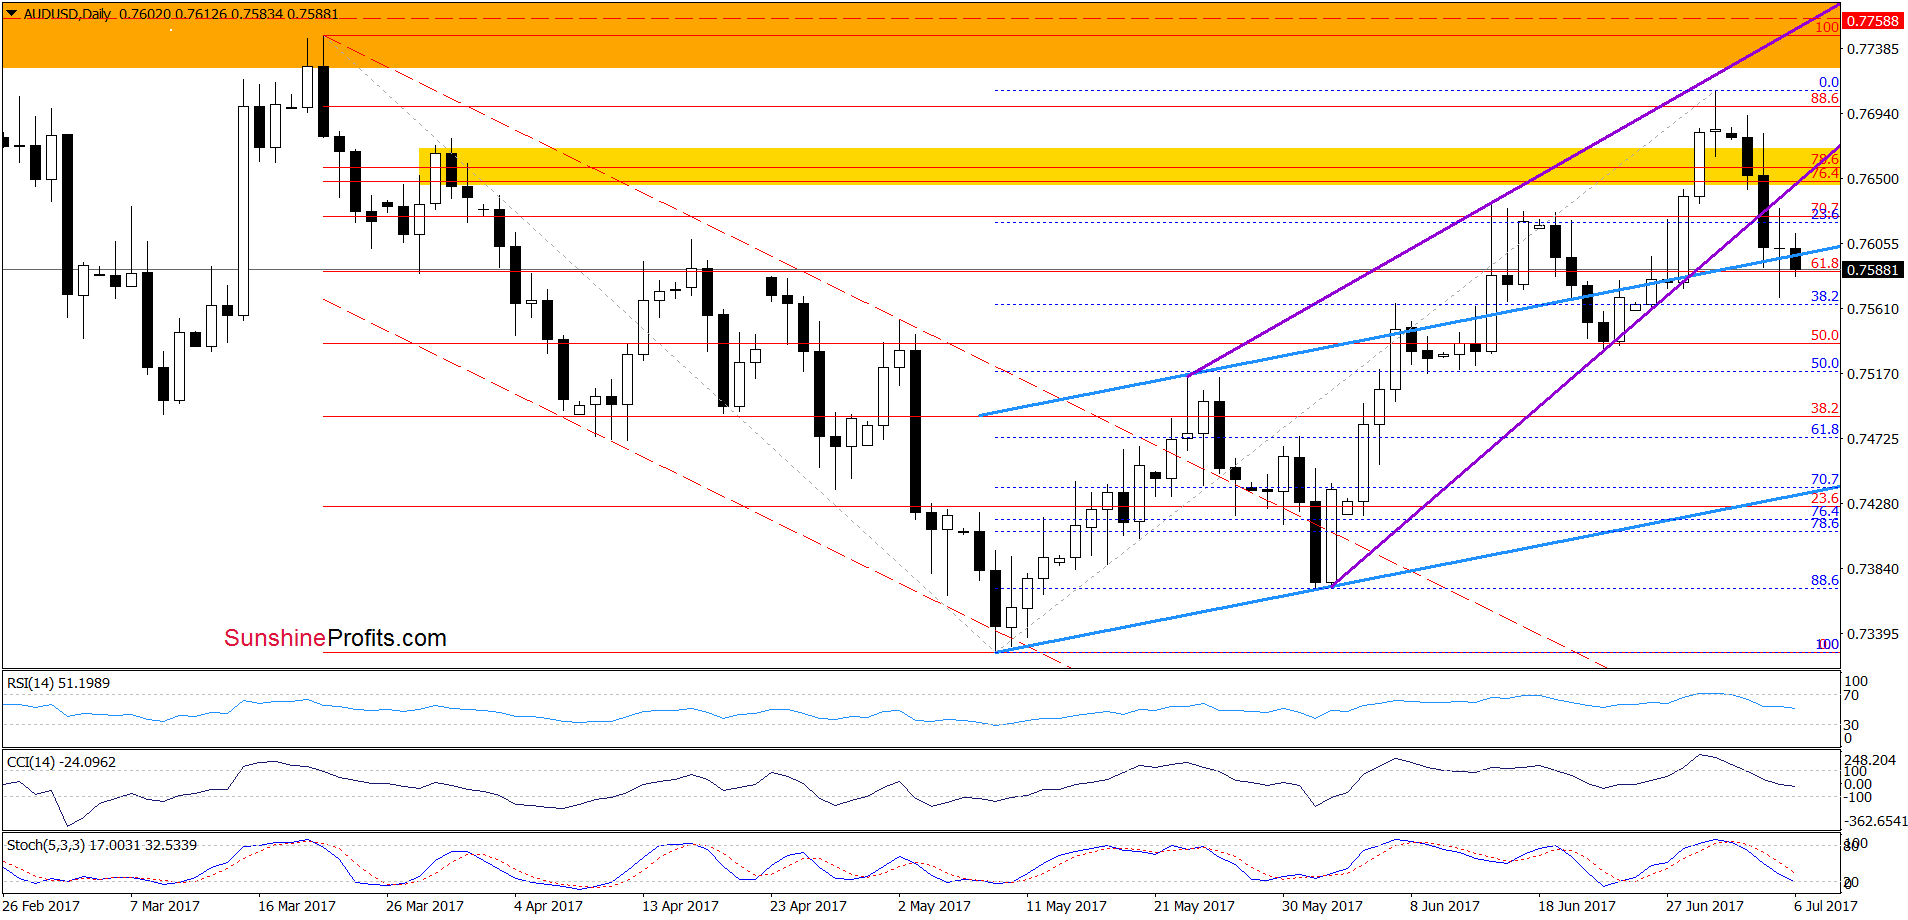
On the daily chart, we see that although AUD/USD extended gains and climbed above the yellow resistance zone, this improvement was temporary and the pair reversed quite quickly. On Tuesday, currency bears pushed the pair sharply lower, which resulted in a drop below the lower border of the purple rising wedge, which was a negative development. Earlier today, the pair extended losses and slipped under the upper border of the blue rising trend channel. In this way, AUD/USD invalidated the earlier breakout, which together with the above-mentioned negative factors and the sell signals generated by the indicators suggests further deterioration in the coming days. If this is the case and the exchange rate moves lower, the first downside target will be around 0.7533 (the June 22 low). Nevertheless, taking into account the medium-term picture, we think that AUD/USD will extend declines and test the lower border of the blue declining trend channel in the coming week(s). Therefore, opening short positions is are justified from the risk/reward perspective.
Very short-term outlook: bearish
Short-term outlook: mixed with bearish bias
MT outlook: mixed
LT outlook: mixed
Trading position (short-term; our opinion): Short positions (with a stop-loss order at 0.7724; the initial downside target at 0.7473) are justified from the risk/reward perspective. We will keep you informed should anything change, or should we see a confirmation/invalidation of the above.
Thank you.
Nadia Simmons
Forex & Oil Trading Strategist
Przemyslaw Radomski, CFA
Founder, Editor-in-chief, Gold & Silver Fund Manager
Gold & Silver Trading Alerts
Forex Trading Alerts
Oil Investment Updates
Oil Trading Alerts


