After yesterday's slide, the euro is retracing part of its decline. While it appears somewhat running out of steam, how likely is it that the bulls are almost exhausted now? And what about USD/JPY? We haven't seen it this high in quite a while. How probable is a reversal soon? Let's dive in to the charts.
In our opinion, the following forex trading positions are justified - summary:
- EUR/USD: none
- GBP/USD: none
- USD/JPY: none
- USD/CAD: none
- USD/CHF: short (a stop-loss order at 0.9996; the initial downside target at 0.9768)
- AUD/USD: none
EUR/USD
Let's quote our yesterday's observations:
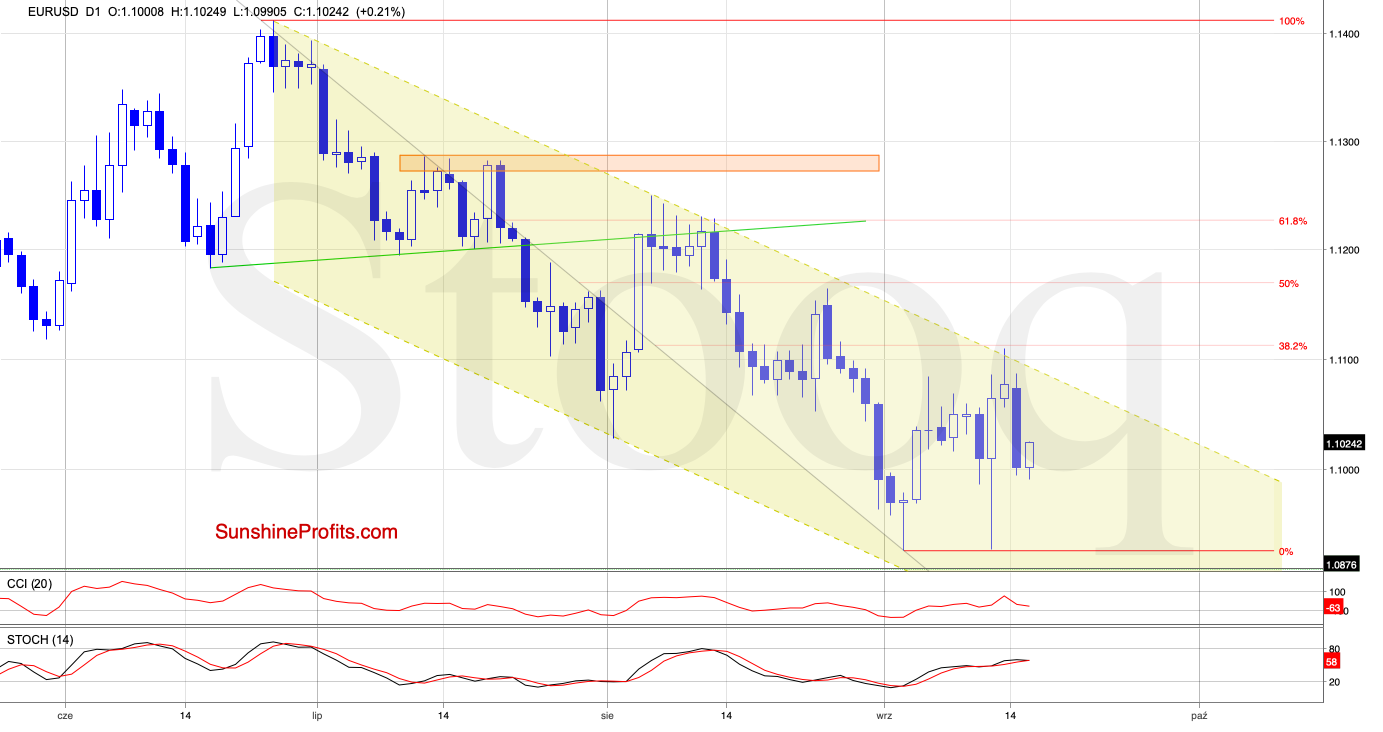
(...) On Friday, the pair closely approached the 38.2% Fibonacci retracement. Its breakout attempt above the upper border of the declining yellow trend channel has been invalidated however, which is certainly a bearish development.
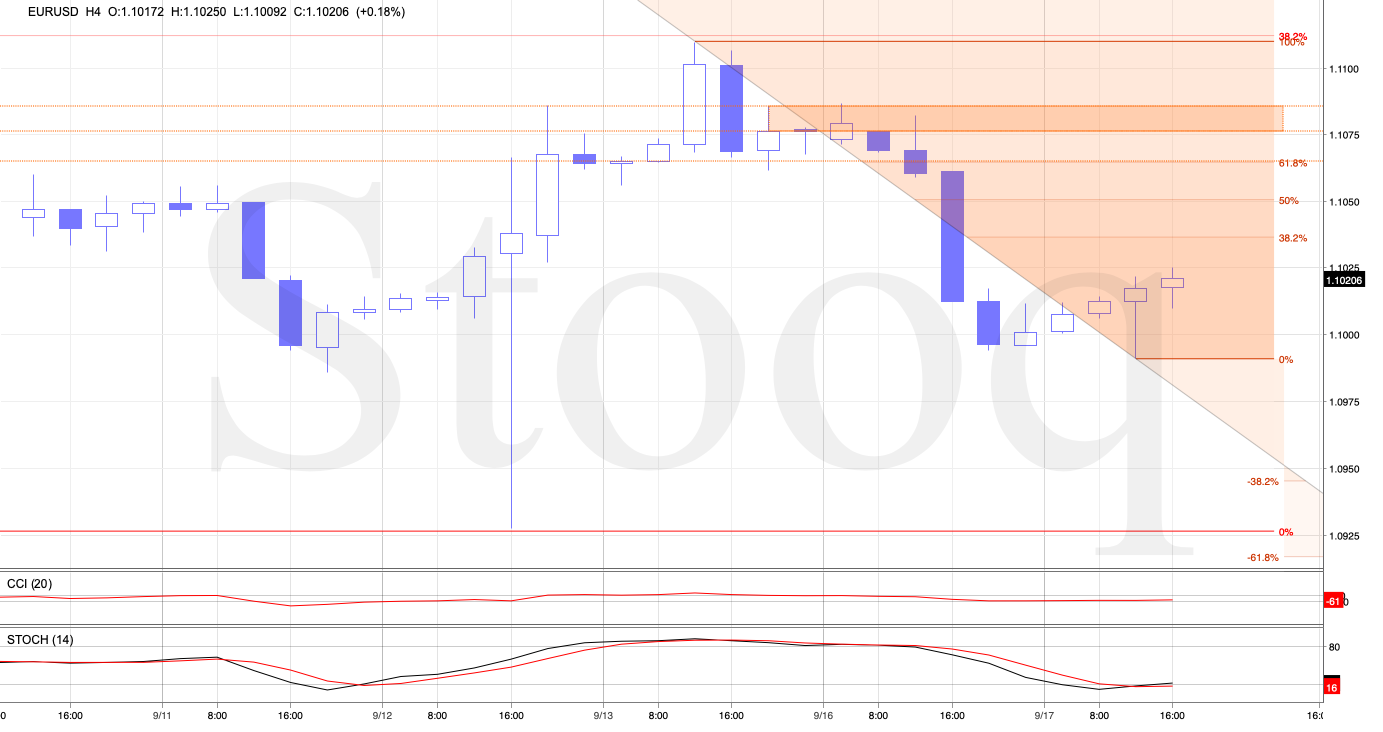
We didn't have to wait for a long time for the following move lower. Earlier today, the exchange rate moved quite sharply down, suggesting we could see a test of the 1.1000 level in the very near future.
The situation developed as described, and EUR/USD tested our downside target. Earlier today, we saw another attempt to move below this support level, but the bulls triggered a rebound.
Let's take a look at the chart below. If the buyers manage to close today's session above 1.1000, we'll likely see further improvement and a test of the 61.8% Fibonacci retracement based on the recent decline or even a test of the orange resistance zone.
Trading position (short-term; our opinion): No positions are justified from the risk/reward perspective. We will keep you informed should anything change, or should we see a confirmation/invalidation of the above.
USD/JPY
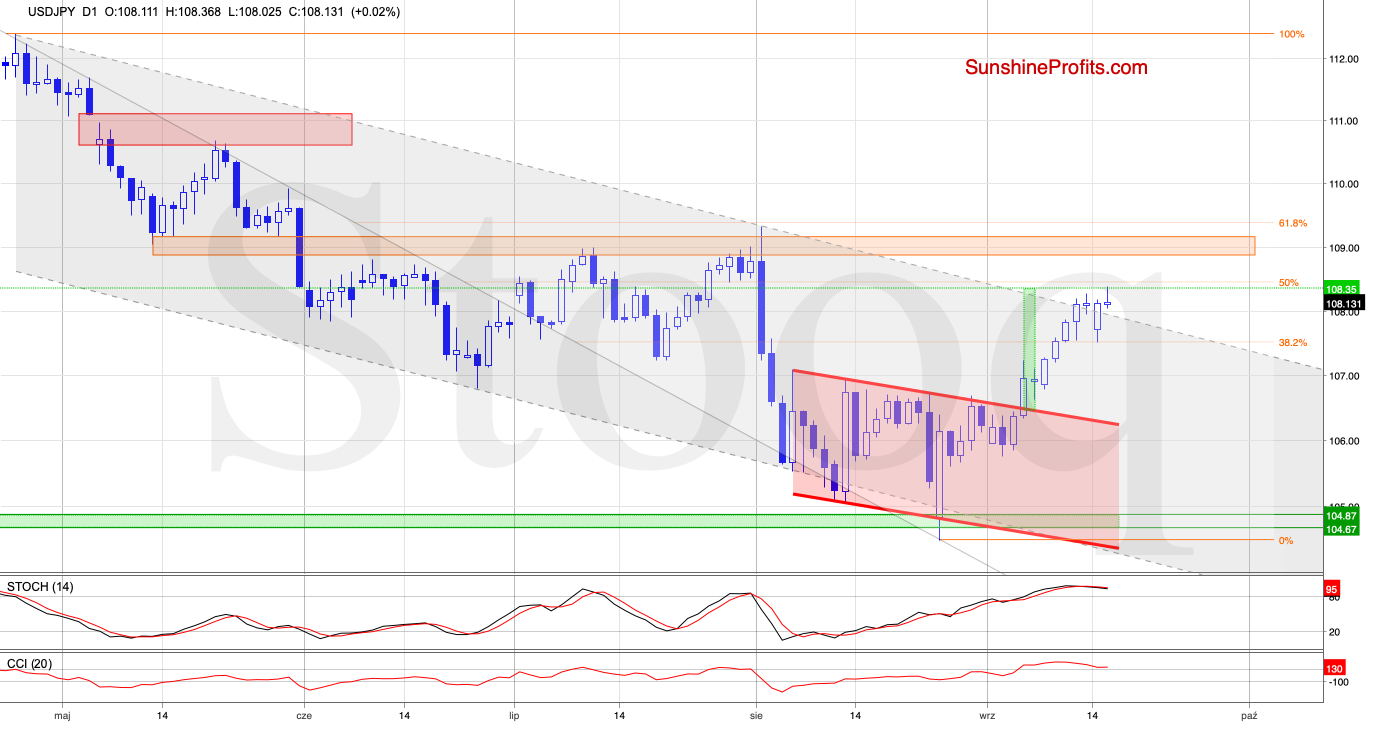
USD/JPY rose slightly and came back above the upper border of the grey declining trend channel during yesterday's session. Earlier today, the bulls pushed the exchange rate even higher, and the pair reached the area where the size of the upward move corresponds to the height of the declining red trend channel.
Coupled with the proximity to the 50% Fibonacci retracement and the current position of the daily indicators, such price action suggests a likely reversal in the following days.
Should the pair invalidate the breakout above the grey channel, it would open the way to the previously-broken upper border of the declining red trend channel. It would make us consider opening short positions.
Trading position (short-term; our opinion): No positions are justified from the risk/reward perspective. We will keep you informed should anything change, or should we see a confirmation/invalidation of the above.
USD/CAD
The exchange rate invalidated the earlier small breakdown below the 61.8% Fibonacci retracement in the previous week, and a rebound in the following days followed.
The bulls took USD/CAD to the 61.8 Fibonacci retracement based on the September decline and sideways trading in a consolidation came next. Nevertheless, the buy signals remain on the cards, and they suggest that one more attempt to move higher may be just around the corner. That would result in a likely retest of the consolidation's upper border or even in a fresh weekly peak in the very near future.
Trading position (short-term; our opinion): No positions are justified from the risk/reward perspective. We will keep you informed should anything change, or should we see a confirmation/invalidation of the above.
Summing up the Alert, the euro downswing touched our target of 1.1000, and a rebound followed. USD/CHF has reached the pink resistance zone near the upper border of the rising green trend channel, and this combination of resistances coupled with extended daily indicators increases the likelihood of reversal. Should USD/JPY invalidate its breakout above the upper border of the declining grey trend channel, we'll consider opening short positions. Apart from these, there're no other opportunities worth acting upon in the currencies. As always, we'll keep you - our subscribers - informed.
Thank you.
Nadia Simmons
Forex & Oil Trading Strategist


