The USD Index is soaring and breaking above the key technical developments. This means that the key individual currency pairs are also going to move in a meaningful way. Which way will the move and how to profit on it?
EUR/USD
Yesterday, we wrote the following:
What’s next for the exchange rate?
(…) in this area the selling pressure could decrease – especially when we factor in the current position of the daily indicators. Why? Because the RSI slipped under the level of 30 for the first time since late May. Back then, such low reading of this indicators preceded a bigger rebound, which increases the probability that we could see something similar in the coming days.
Therefore, if EUR/USD closes today’s session above the lower border of the red declining trend channel, currency bulls will receive an important reason to act (an invalidation of the earlier breakdown) and we’ll likely see a rebound to (at least) the green zone based on May, June and early August lows, which serves as the nearest resistance area at the moment.
Looking at the daily chart, we see that the situation developed in tune with our assumptions and EUR/USD moved higher, closing yesterday’s session above the lower border of the red declining trend channel.
In this way, the pair invalidated the earlier tiny breakdown, increasing the likelihood that we’ll see a realization of the above scenario in the following days.
Nevertheless, in our opinion, another move to the north will be even more likely and reliable if the daily indicators generate buy signals in the following day(s). Until this time, waiting for a confirmation (or an invalidation) of the above seems to be the best investment decision.
Trading position (short-term; our opinion): No positions are justified from the risk/reward perspective. We will keep you informed should anything change, or should we see a confirmation/invalidation of the above.
GBP/USD
Quoting our Forex Trading Alert posted on August 8, 2018:
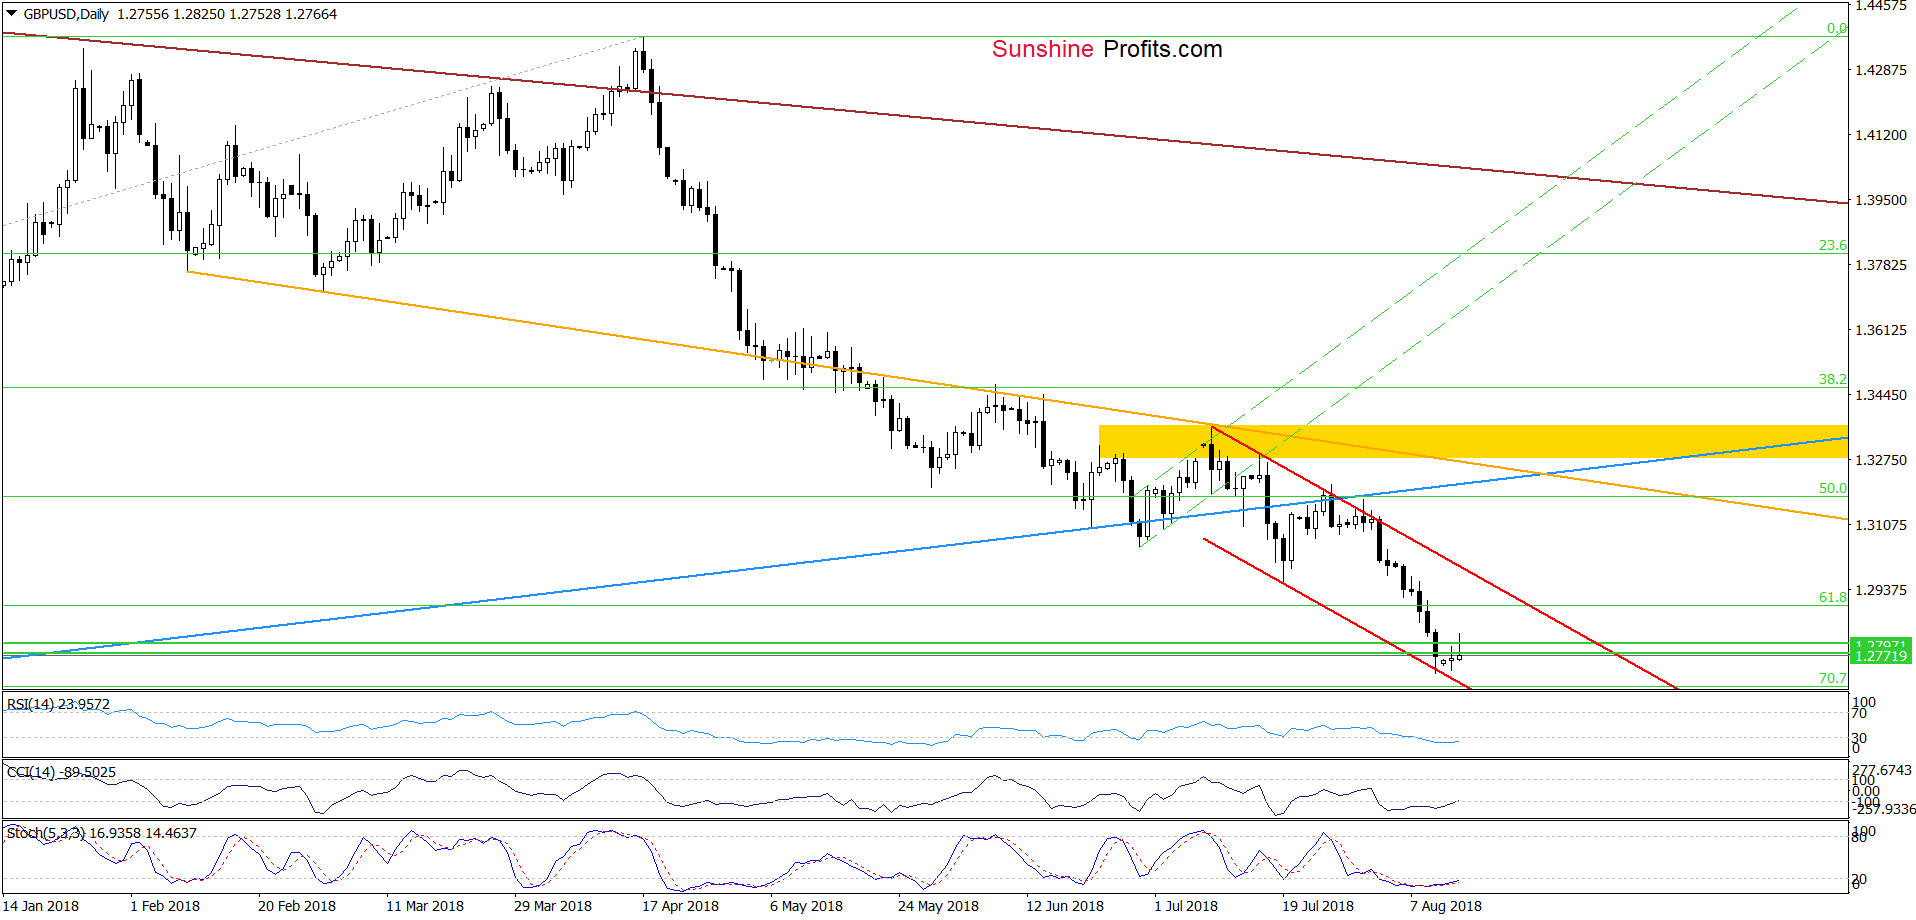
(…) currency bears managed to break under the 61.8% Fibonacci retracement, which opened the way to lower levels.
But is it as easy as it might seem at first glance?
In our opinion, it is not, because even if the pair extends losses from current levels the space for declines seems limited. Why? Because not far from here, you can see two green horizontal support lines based on late August 2017 lows.
Slightly below them is also the lower border of the very short-term red declining trend channel, which could encourage currency bulls o act in the very near future (…)
From today’s point of view, we see that GBP/USD extended losses below the 61.8% Fibonacci retracement at the end of last week. Despite this deterioration, the above-mentioned lower border of the very short-term red declining trend channel withstood the selling pressure on Friday, which resulted in a small rebound in the following days.
Nevertheless, the size of the current move is too small (at the moment of writing this alert) to confirm currency bulls’ strength – especially when we factor in the fact that GBP/USD is still trading under the previously-broken August 2017 lows (marked with both green horizontal lines).
Therefore, in our opinion, a bigger move to the upside (similarly to what we wrote in the case of EUR/USD) will be more likely and reliable if the exchange rate closes today’s session (or one of the following) above both green lines and daily indicators generate buy signals.
Until this time, waiting at the sidelines is justified from the risk/reward perspective.
Trading position (short-term; our opinion): No positions are justified from the risk/reward perspective. We will keep you informed should anything change, or should we see a confirmation/invalidation of the above.
USD/JPY
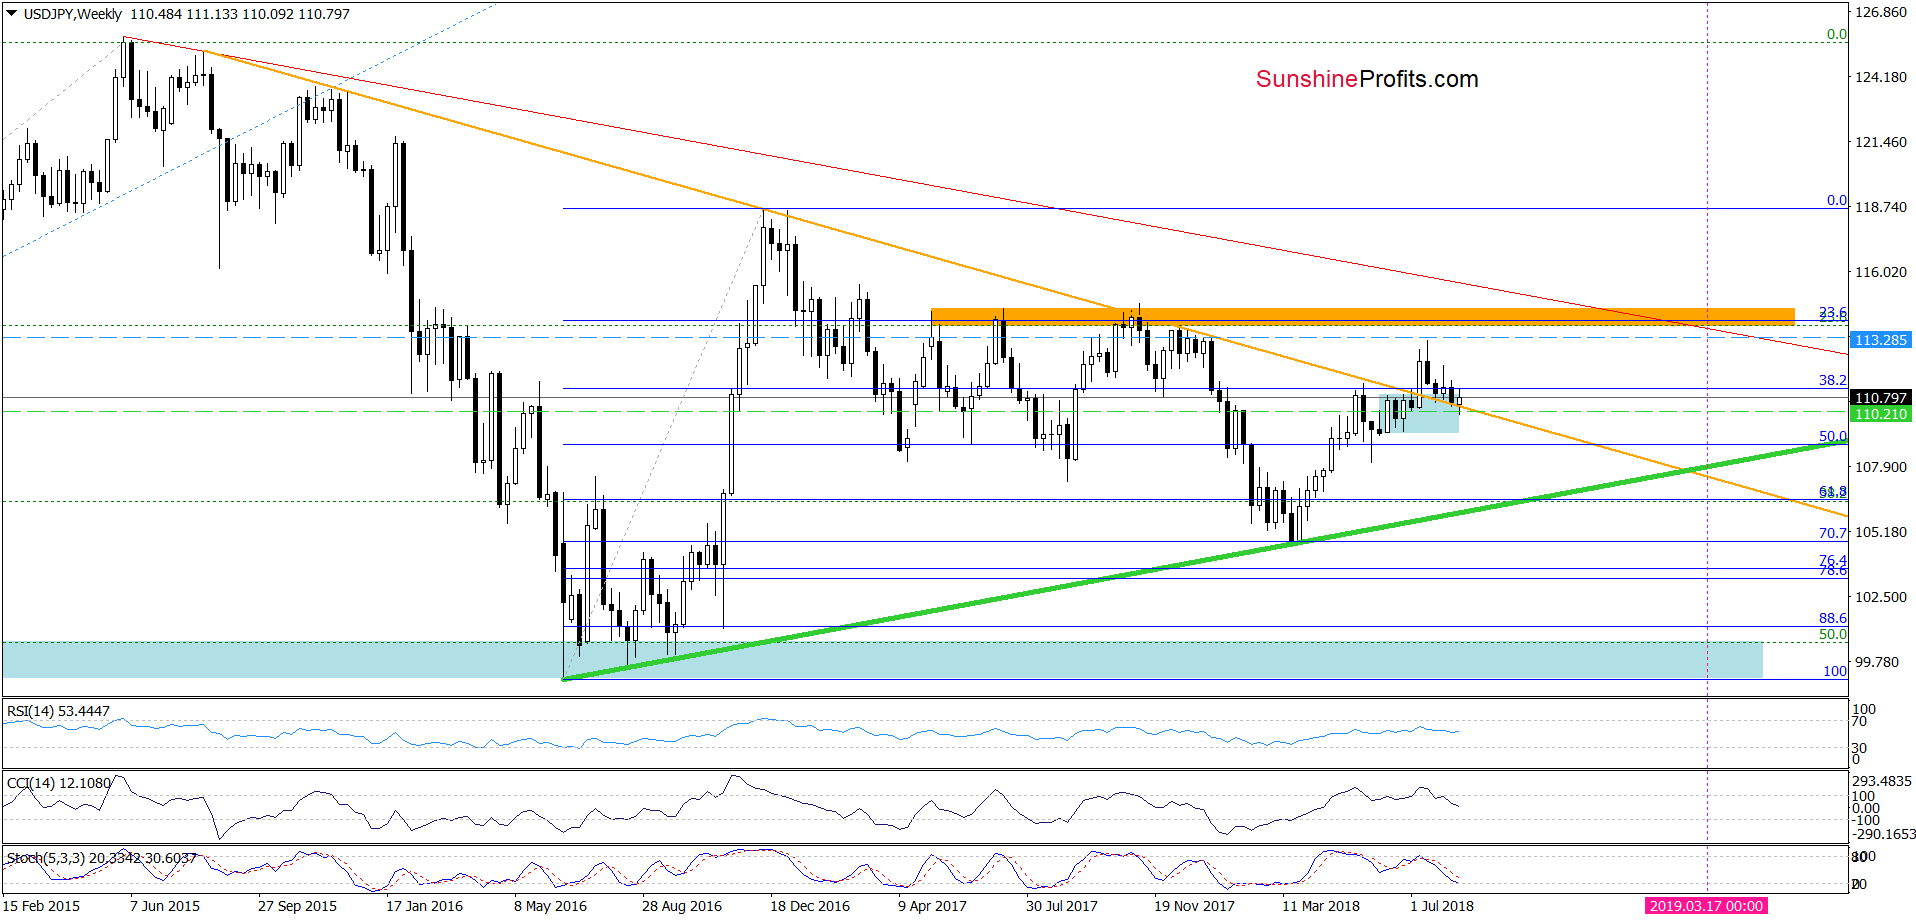
As you see on the charts, although USD/JPY closed the last week above the previously-broken long-term orange line (which continues to serve as the major support), yesterday’s price action took the exchange rate under July lows, activating our stop-loss order and closing our short positions with loss (first in many weeks).
From today's point of view, this situation seems even more unpleasant, because the currency pair turned north after that event. Nevertheless, please keep in mind that if USD/JPY dived even more during yesterday’s session, we would probably have different feelings about this situation and breathed a sigh of relief that the stop-loss’ activation allowed us to avoid further losses.
Just as one swallow doesn’t make a summer, one correction in profits doesn’t make the entire year unprofitable. Conversely, this year has been exceptionally profitable so far (with only a few exceptions) and we think that this will continue in the following months. We’ll do our best to make your profits grow further.
So, what can we expect in the coming days?
From the very short-term perspective, we see that USD/JPY is still trading inside the very short-term green declining trend channel and under the previously-broken lower borders of the brown and blue rising trend channels.
However, on the other hand, the CCI and the Stochastic Oscillator generated buy signals, suggesting that another move will be to the upside. In other words, currency bulls will probably try to cross the abovementioned resistances in the following days.
The pro-growth scenario is also reinforced by the medium-term picture about which we wrote on Friday:
(…) In our opinion, this week’s price action looks like another verification of the earlier breakout, which means that as long as there is no weekly closure under this line lower values of the exchange are not likely to be seen and one more reversal from here should not surprise us in the coming week.
Trading position (short-term; our opinion): No positions are justified from the risk/reward perspective. We will keep you informed should anything change, or should we see a confirmation/invalidation of the above.
Thank you.
Nadia Simmons
Forex & Oil Trading Strategist
Przemyslaw Radomski, CFA
Founder, Editor-in-chief, Gold & Silver Fund Manager
Gold & Silver Trading Alerts
Forex Trading Alerts
Oil Investment Updates
Oil Trading Alerts


