The USD Index plunged for the second day yesterday. When will the decline stop and what are the implications?
In our opinion the following forex trading positions are justified - summary:
- EUR/USD: short (stop-loss order at 1.1512; initial downside target at 1.0572)
- GBP/USD: none
- USD/JPY: none
- USD/CAD: none
- USD/CHF: none
- AUD/USD: none
In short, it appears likely that the decline in the USD Index is over.
In today’s alert we’ll once again focus on the USD Index as the outlook for it is the thing that is likely to determine the key moves in individual currency pairs (we will move back to individual currency pairs next week). Let’s start with the long-term chart (charts courtesy of http://stockcharts.com).

In yesterday’s alert we wrote the following:
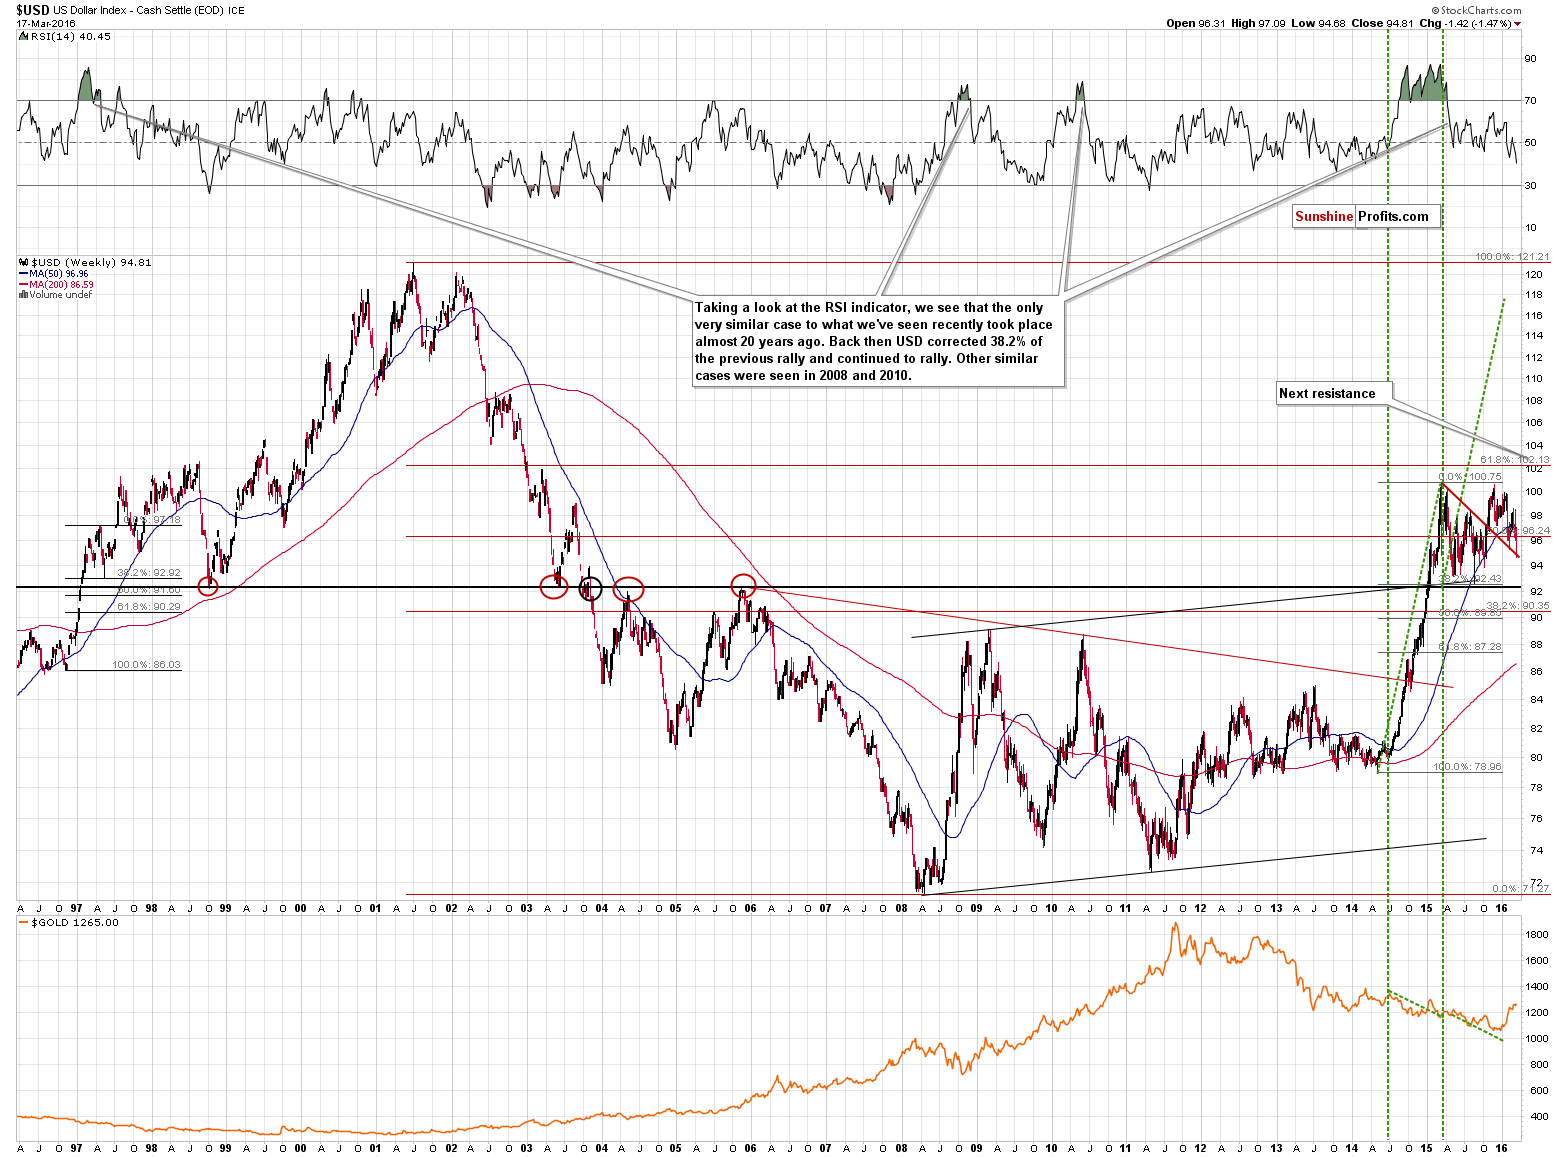
The most important thing visible on the above chart is that the USD Index is in a major uptrend, and more precisely in a consolidation within it. After breaking through the resistance of 92, the USD Index has been consolidating – and that’s perfectly natural, because the previous rally was both big and sharp.
Once the consolidation is over, the move that follows it is likely to be similar to the one that preceded it (note the green lines on the above chart) and this implies a huge rally in the coming months (likely later in 2016).
The question is when the current consolidation is going to end and the answer is based on the support levels. First of all, we don’t expect the 92 level to be broken, so even if the USD slides much lower, it doesn’t seem likely that it would result in a breakdown. Secondly, the declining, red support line is something that is likely to keep declines in check – this line is more or less being reached at the moment of writing these words.
The above remains up-to-date. The USD Index closed more or less at the above-mentioned red support line without breaking visibly below it, so it seems likely that the decline is over of very close to being over.
Let’s take a look at the short-term chart.

As far as the short-term USD Index chart is concerned, we described it yesterday in the following way:
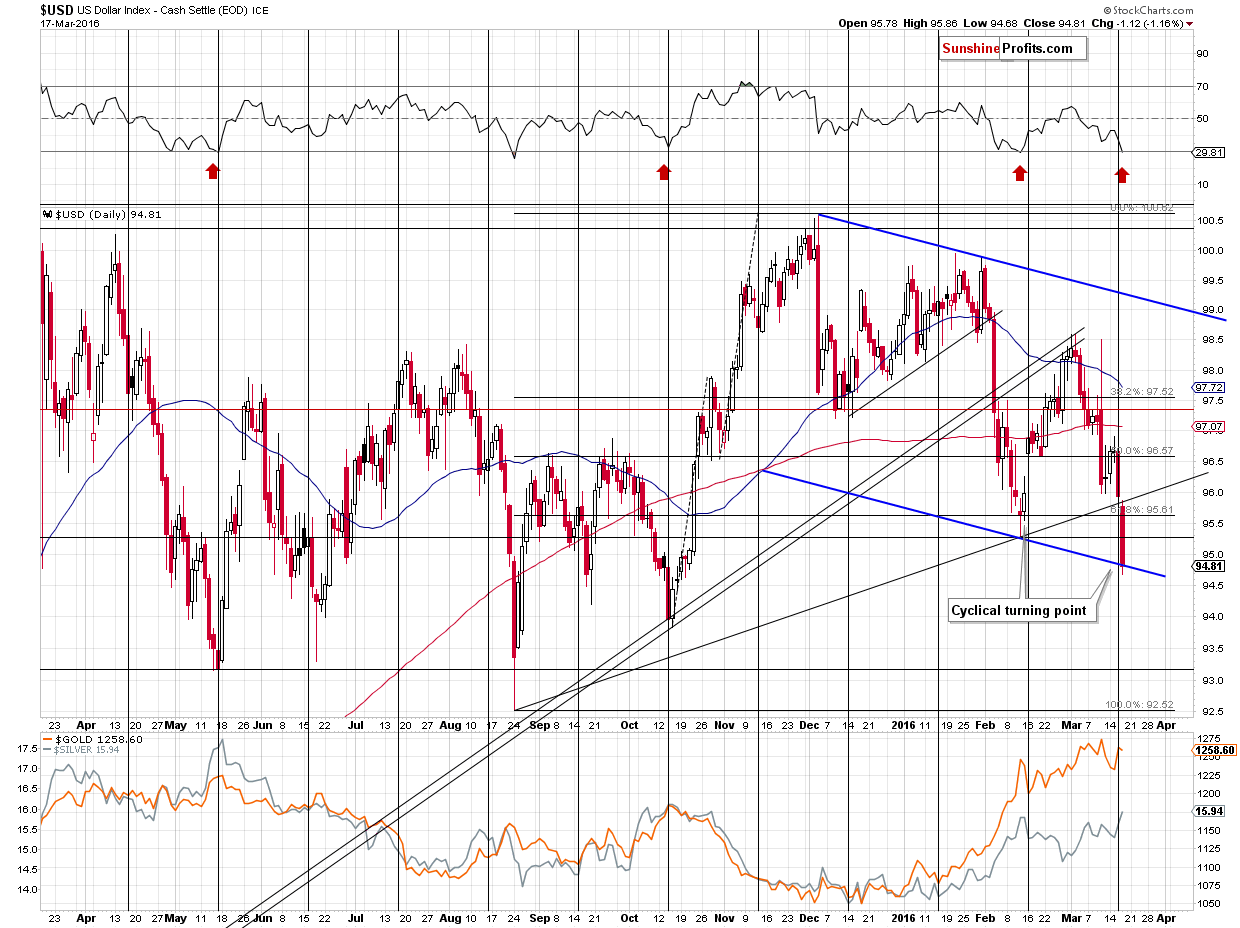
The USD Index moved to the rising support line yesterday, but this line was broken in today’s pre-market trading, so the question is what is the next level that could trigger a bounce or a rally.
The February 2016 low and the lower border of the declining trend channel are both good candidates. Since they are relatively close to each other it’s quite likely that either USD will reverse either right at one of them or somewhere in between. This is where the USD Index is right now (slightly above 95).
The USD Index finally closed at the lower border of the declining trend channel, which is in tune with the above. The local bottom is likely in. There’s one more thing that we would like to discuss today. The RSI indicator just hit 30 and in call previous cases when this was the case close to the turning point, a big rally followed.
Summing up, it seems that the decline in the USD Index is over or very close to being over. The index moved to both: medium- and short-term support lines and it declined before and right at the cyclical turning point and we also saw a buy signal in the RSI indicator and all of these factors make a rally in the coming days likely.
Thank you.
Nadia Simmons
Forex & Oil Trading Strategist
Forex Trading Alerts
Oil Investment Updates
Oil Trading Alerts


