Donald Trump won the US Presidential elections and the initial reaction of the financial markets was very strong. How did it affect the USD Index?
In our opinion the following forex trading positions are justified - summary:
- EUR/USD: short (a stop-loss order at 1.1180; downside target at 1.0568)
- GBP/USD: none
- USD/JPY: none
- USD/CAD: none
- USD/CHF: long (a stop-loss order at 0.9664; upside target at 1.0237)
- AUD/USD: none
Before we take a closer look at the individual currency pairs we decided to check the current picture of the USD Index.
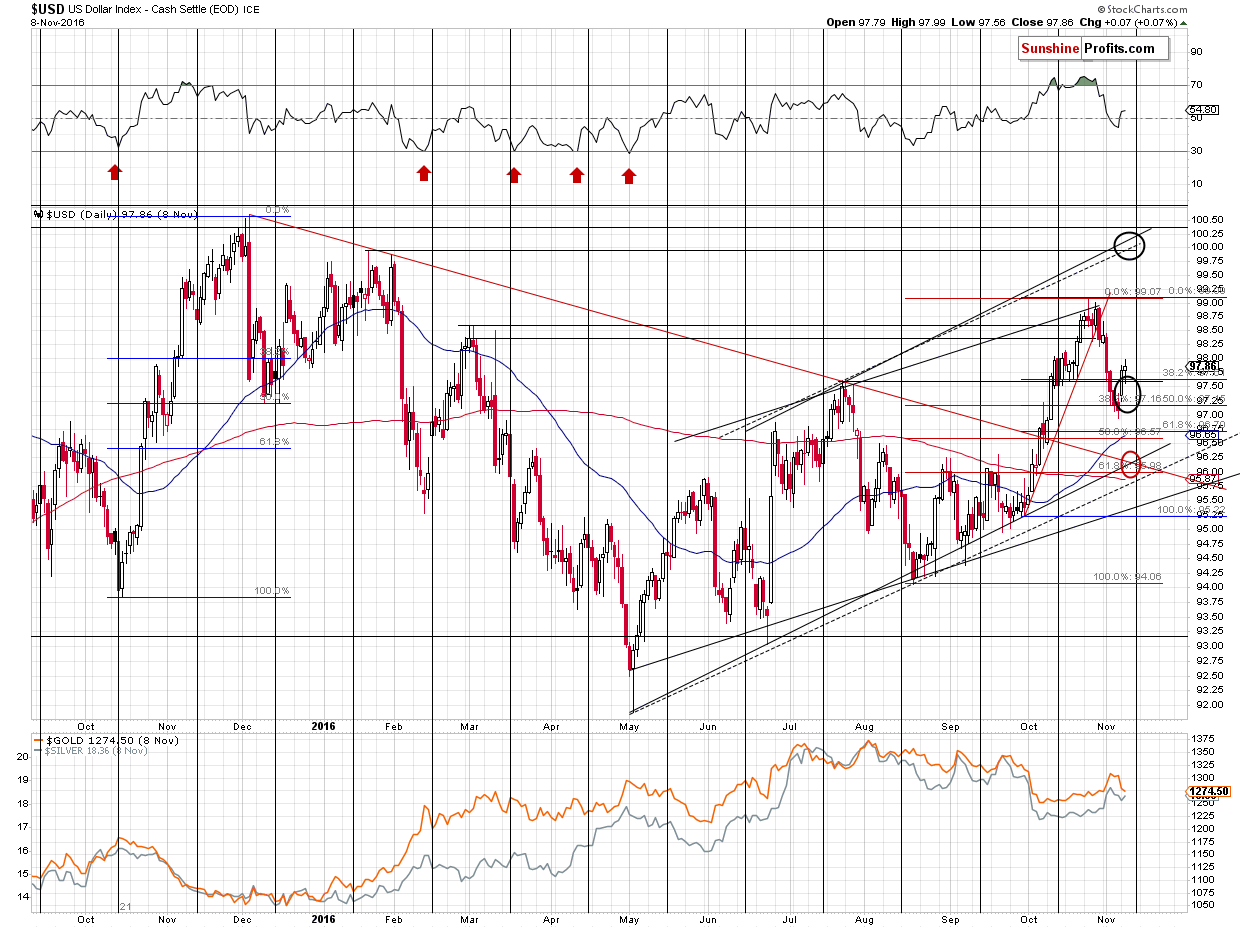
In Monday’s Gold & Silver Trading Alert we featured the red target area and we wrote the following:
The USD Index declined on Friday, which makes gold’s tiny upswing bearish (the reaction was weak) and a decline in miners even more bearish. Since the reaction to USD’s movement weakened, it doesn’t seem that metals and miners would rally substantially even if the USD’s bottom is not yet in. Speaking of a bottom for the USD Index – it still seems most likely that it’s either in or very close to being in (either at 97 or at 96.50), but if it’s not, then it’s still very unlikely that it would slide below the 96 level and confirm such a breakdown – multiple support levels coincide there.
In today’s pre-market trading, the USD Index moved right into our target area (declining a bit below 96) and quickly reversed – at the moment of writing these words, it’s trading at about 97.97 – above yesterday’s closing prices, so it erased the entire decline. Therefore, we have not only seen a huge daily reversal (with bullish implications), but also a verification of the move above the declining medium-term red support/resistance line (verified as support). It all happened right before the cyclical turning point, so the implications are even more bullish.
EUR/USD
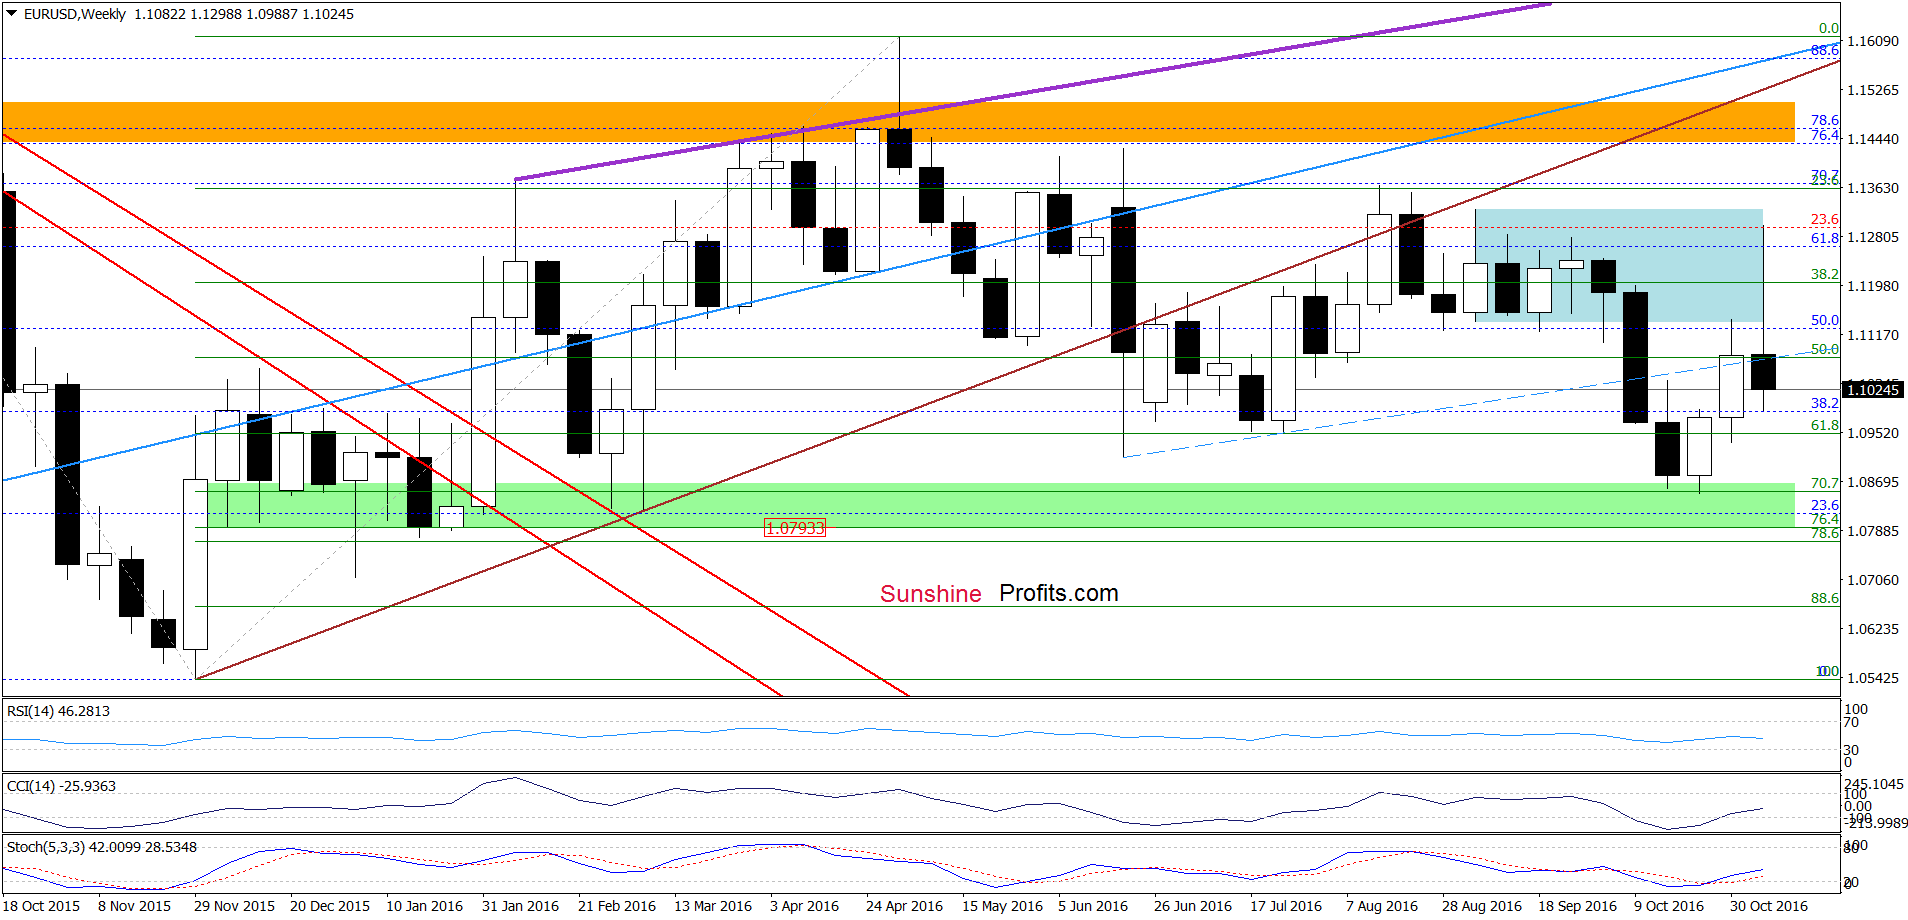
On the weekly chart we see that although EUR/USD increased sharply earlier today, this improvement was very temporary and the exchange rate erased almost all increases. As a result, the air dropped under the blue dashed support/resistance line, which means an invalidation of earlier breakout above this line and suggests further deterioration in the coming.
How did this drop affect the very short-term picture? Let’s check.
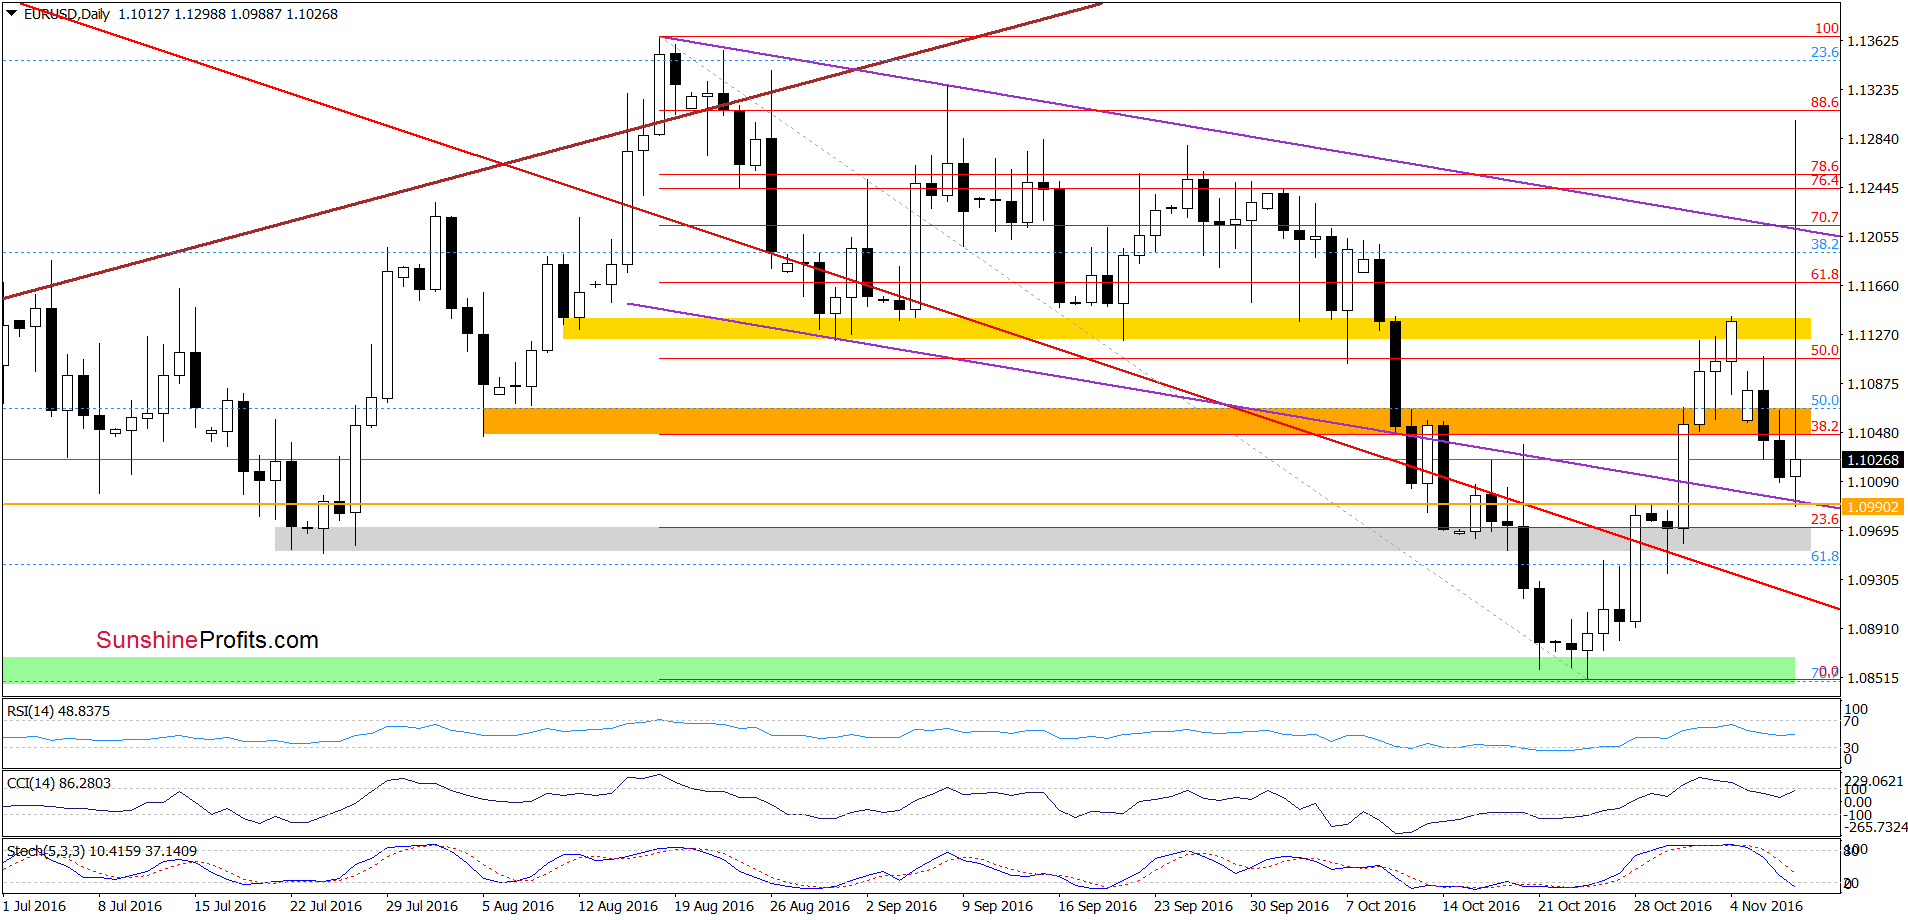
Yesterday, we wrote the following:
(…) EUR/USD slipped below the orange support zone, which suggests further deterioration – especially when we factor in the medium-term picture and sell signals generated by the indicators. If this is the case and the pair declines from here, the initial downside target would be around 1.1000 (the lower border of the purple declining trend channel and late-Oct highs).
From today’s point of view, we see that the exchange rate moved lower and reached our downside target. As you see this support area in combination with a U.S. presidential vote news triggered a sharp rally, which took EUR/USD to mid-Sep highs. Despite this improvement, the rally was very temporary and currency bears erased almost all gains in the following hours. Taking this fact into account, and combining it with sell signals generated by the indicators and the current picture of the USD Index, we believe that opening short positions is justified from the risk/reward perspective.
Very short-term outlook: bearish
Short-term outlook: bearish
MT outlook: mixed with bearish bias
LT outlook: mixed
Trading position (short-term; our opinion): Short positions (with a stop-loss order at 1.1180 and downside target at 1.0568) are justified from the risk/reward perspective. We will keep you informed should anything change, or should we see a confirmation/invalidation of the above.
USD/CHF
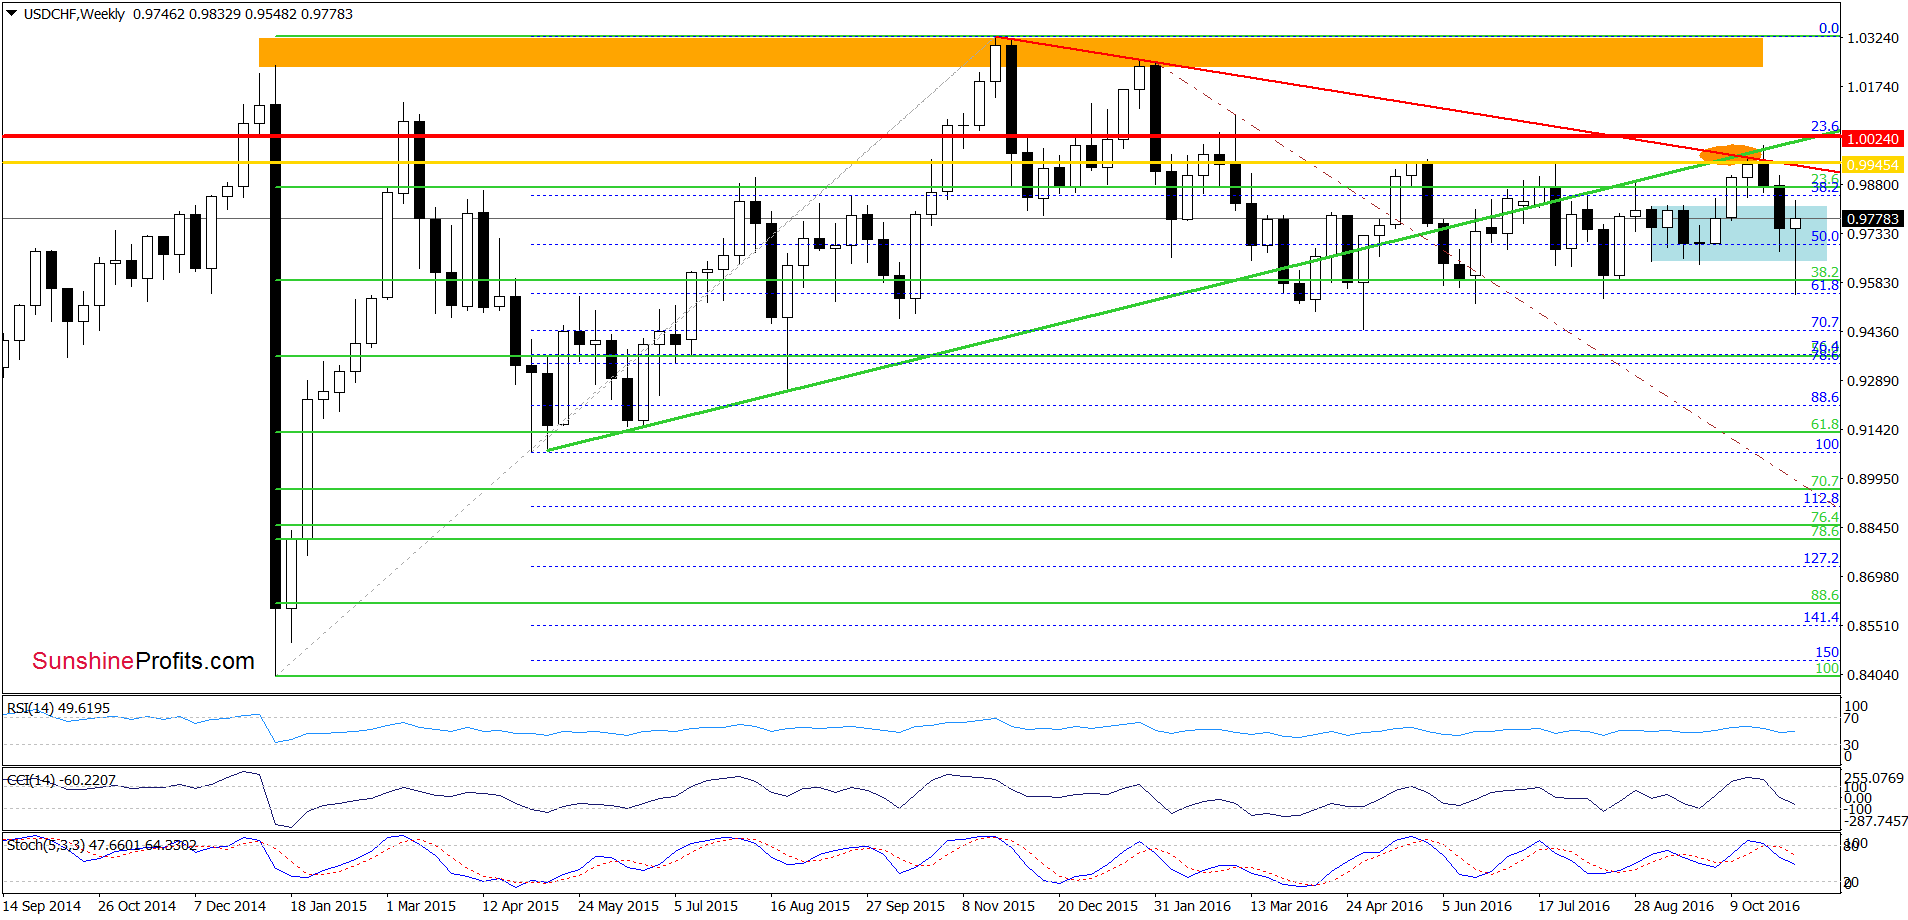
From the medium-term perspective we see that although USD/CHF broke below the lower border of the blue consolidation, this deterioration was very quickly erased, which is a bullish signal (an invalidation of the breakdown) that suggests further improvement.
Are there any other technical factors that could encourage currency bulls to act? Let’s examine the daily chart and find out.
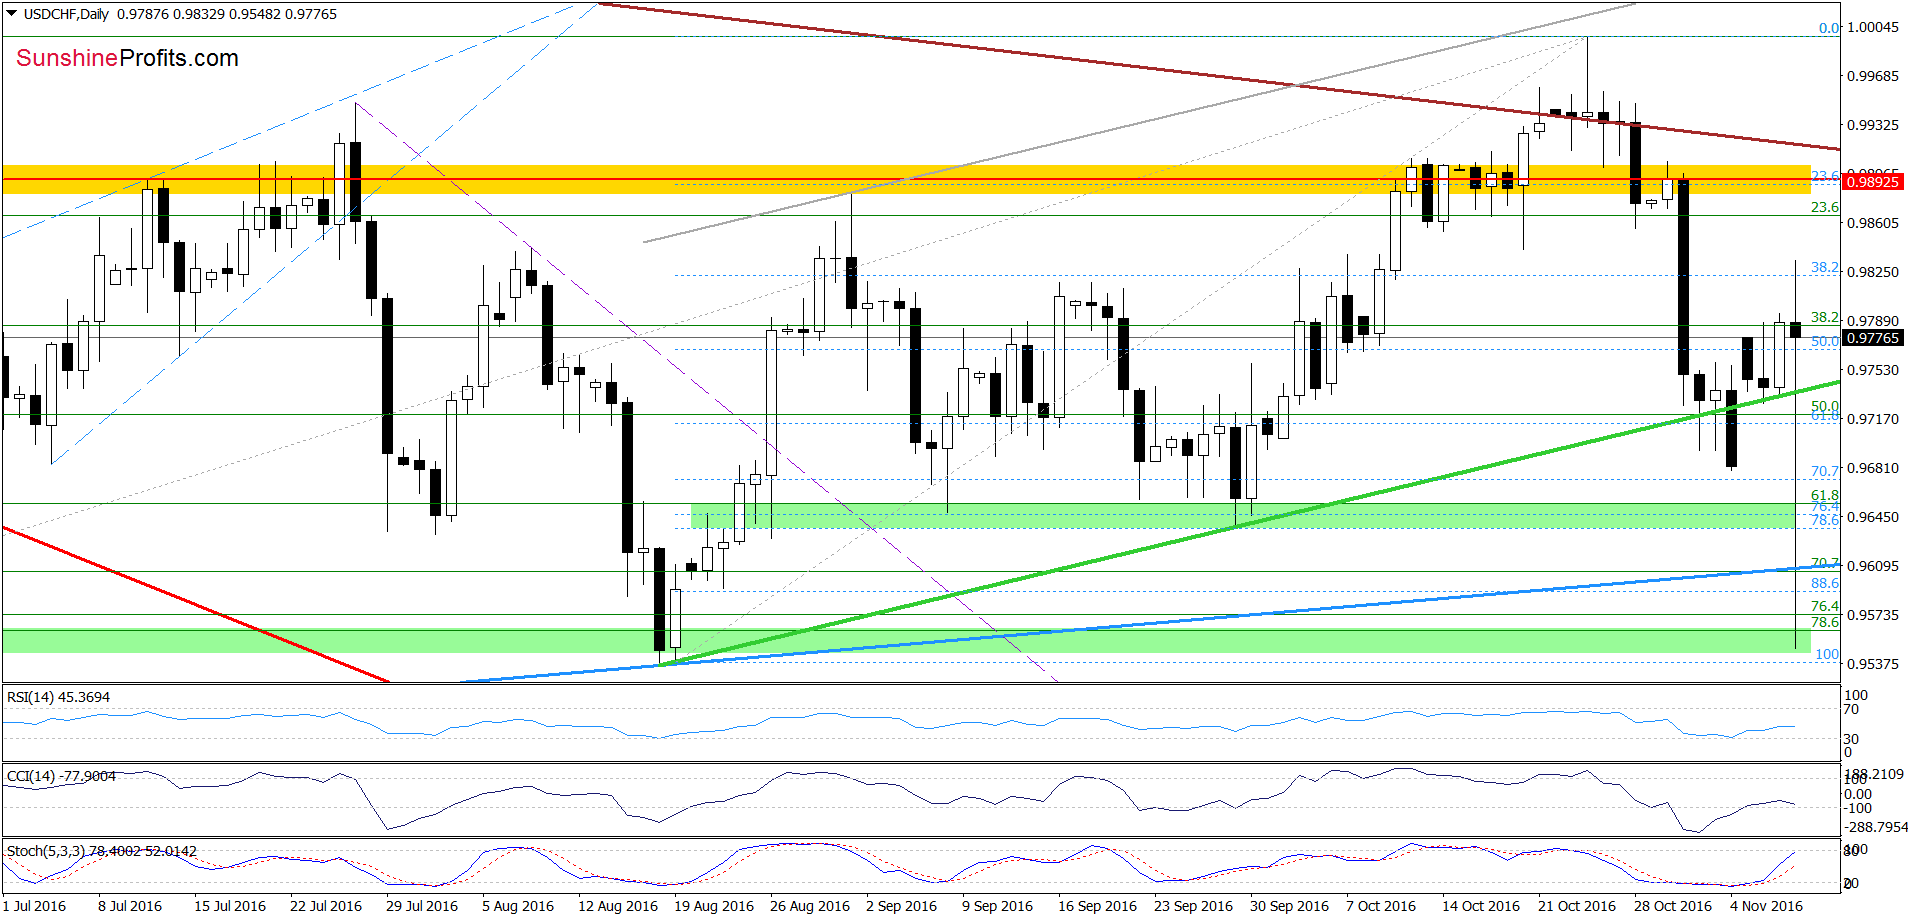
From today’s point of view, we see that although USD/CHF declined very sharply under the green support line, the green support zone created by the 76.4% and 78.6% Fibonacci retracements and the Aug lows successfully stopped further deterioration and triggered a very sharp rebound, which took the exchange rate to the previous levels. In this way, the air invalidated earlier breakdown under the green line (once again), which in combination with buy signals generated by the indicators suggests further improvement in the coming days. Therefore, we believe that opening long positions is justified from the risk/reward perspective. If we see such price action, USD/CHF will (at least) re-test the yellow resistance zone in the coming days.
Very short-term outlook: bullish
Short-term outlook: bullish
MT outlook: mixed with bullish bias
LT outlook: mixed
Trading position (short-term; our opinion): Long positions (with a stop-loss order at 0.9664 and upside target at 1.0237) are justified from the risk/reward perspective. We will keep you informed should anything change, or should we see a confirmation/invalidation of the above.
Thank you.
Nadia Simmons
Forex & Oil Trading Strategist
Przemyslaw Radomski, CFA
Founder, Editor-in-chief, Gold & Silver Fund Manager
Gold & Silver Trading Alerts
Forex Trading Alerts
Oil Investment Updates
Oil Trading Alerts


