Although today’s ADP report showed that non-farm private employment rose by 200,000 in the previous month (beating expectations for an increase of 194,000), yesterday’s Janet Yellen commentary (Federal Reserve Chair dampened expectations for an upcoming U.S. rate hike) continues to weigh on the greenback. In this environment, EUR/USD extended gains ang climbed to recent highs. Will we see further rally?
In our opinion the following forex trading positions are justified - summary:
- EUR/USD: short (stop-loss order at 1.1512; initial downside target at 1.0572)
- GBP/USD: none
- USD/JPY: none
- USD/CAD: none
- USD/CHF: none
- AUD/USD: none
EUR/USD
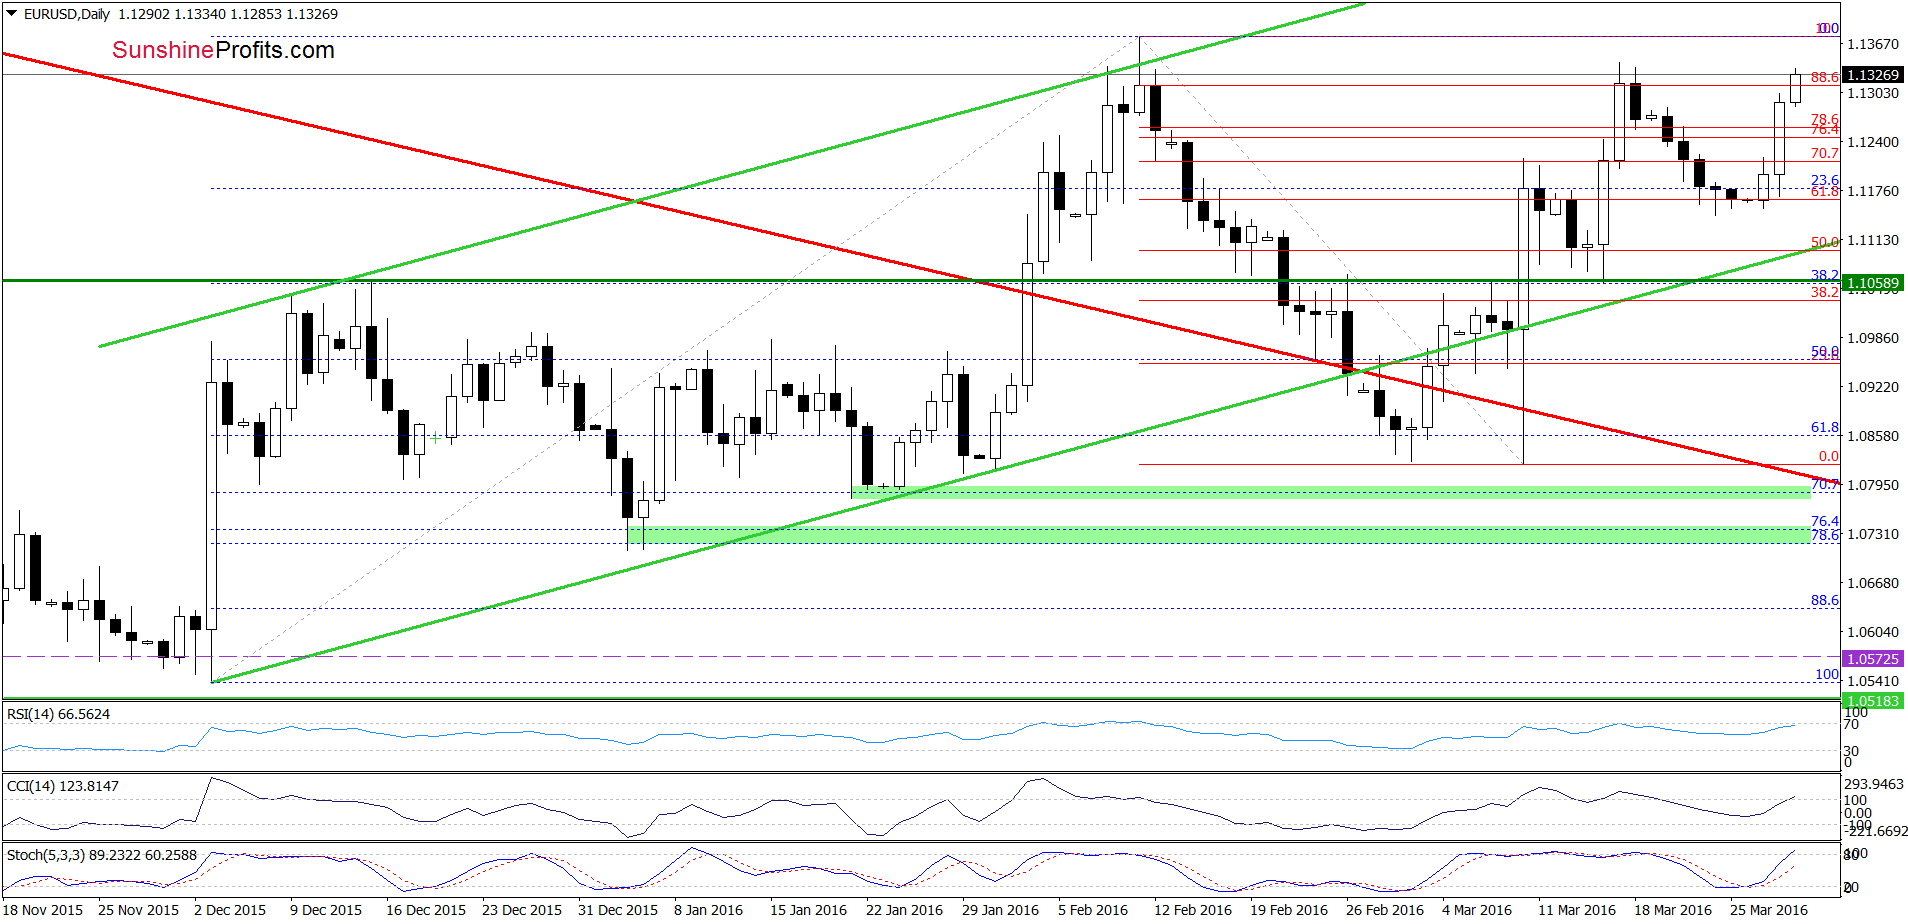
Looking at the daily chart, we see that EUR/USD rebounded sharply and increased to the recent highs, which in combination with buy signals generated by the indicators suggests further improvement in the coming days. But will we see such price action? Let’s examine the weekly chart and find out.
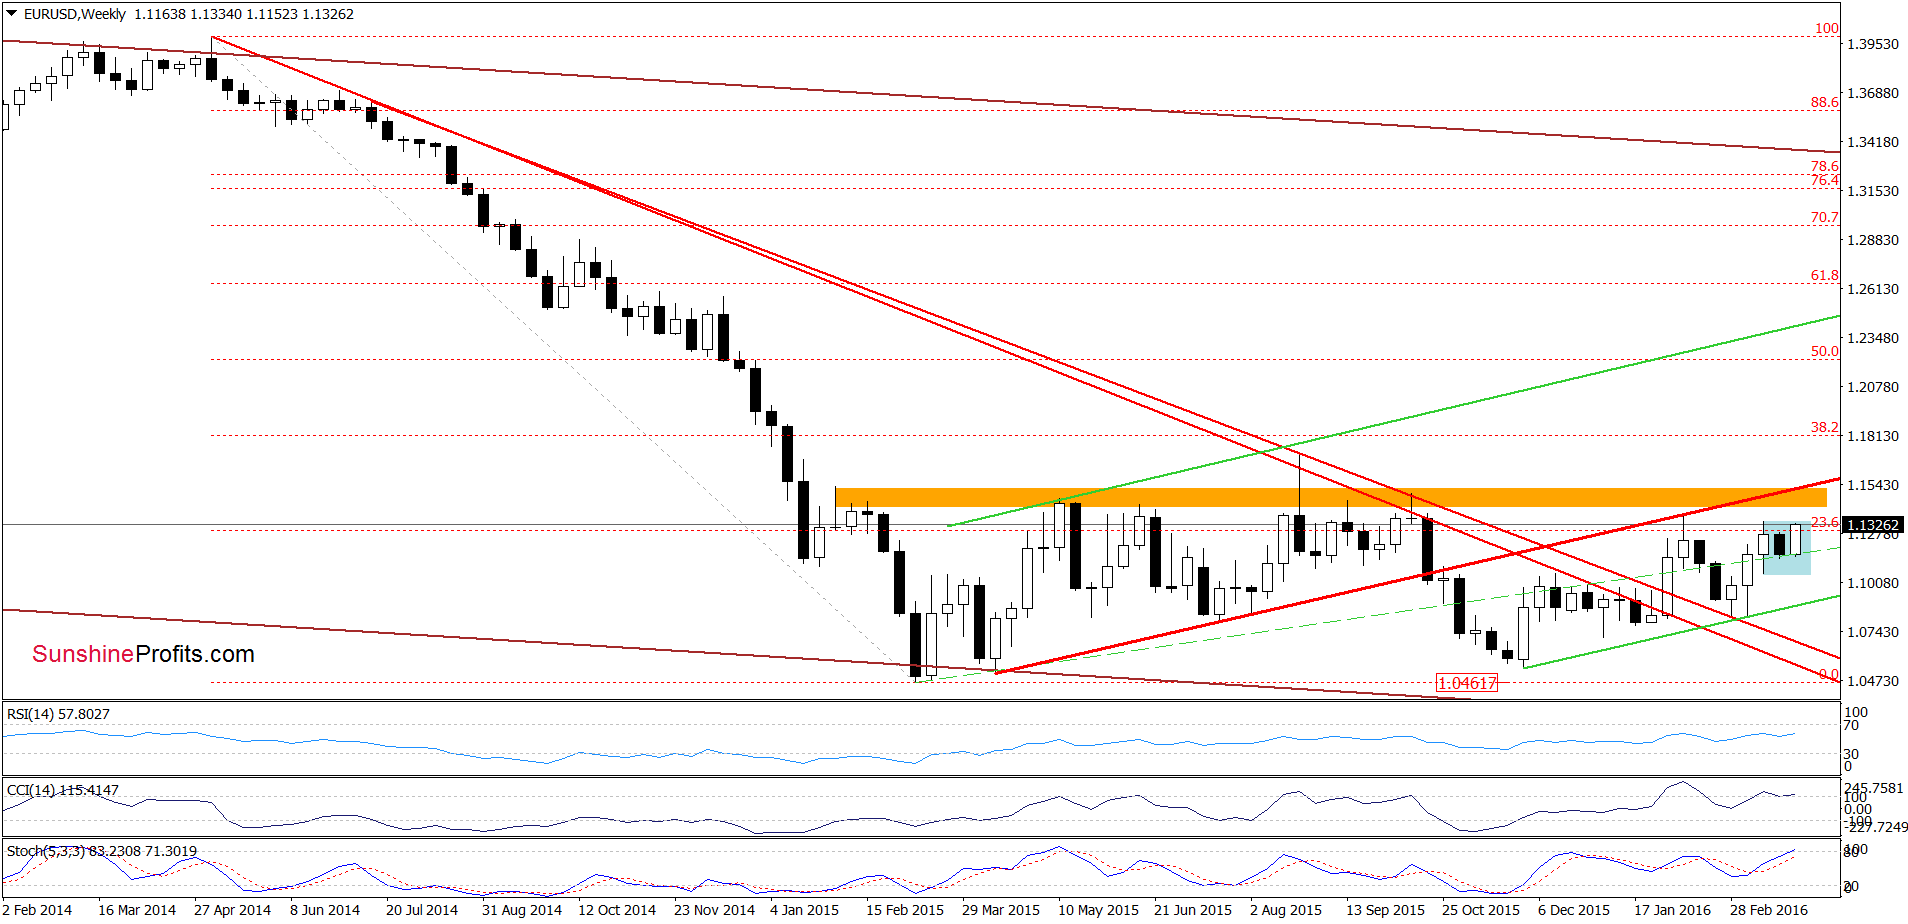
From this perspective, we see that that the recent rebound took the pair to the upper border of the blue consolidation. Although the current position of the daily and weekly indicators suggests another attempt to move higher, we should keep in mind that the key orange resistance zone is quite close, which could encourage currency bears to act in the coming week – similarly to what we saw in the past.
Very short-term outlook: bearish
Short-term outlook: bearish
MT outlook: mixed with bearish bias
LT outlook: mixed
Trading position (short-term; our opinion): Short positions (with a stop-loss order at 1.1512 and the initial downside target at 1.0572) are justified from the risk/reward perspective. We will keep you informed should anything change, or should we see a confirmation/invalidation of the above.
GBP/USD
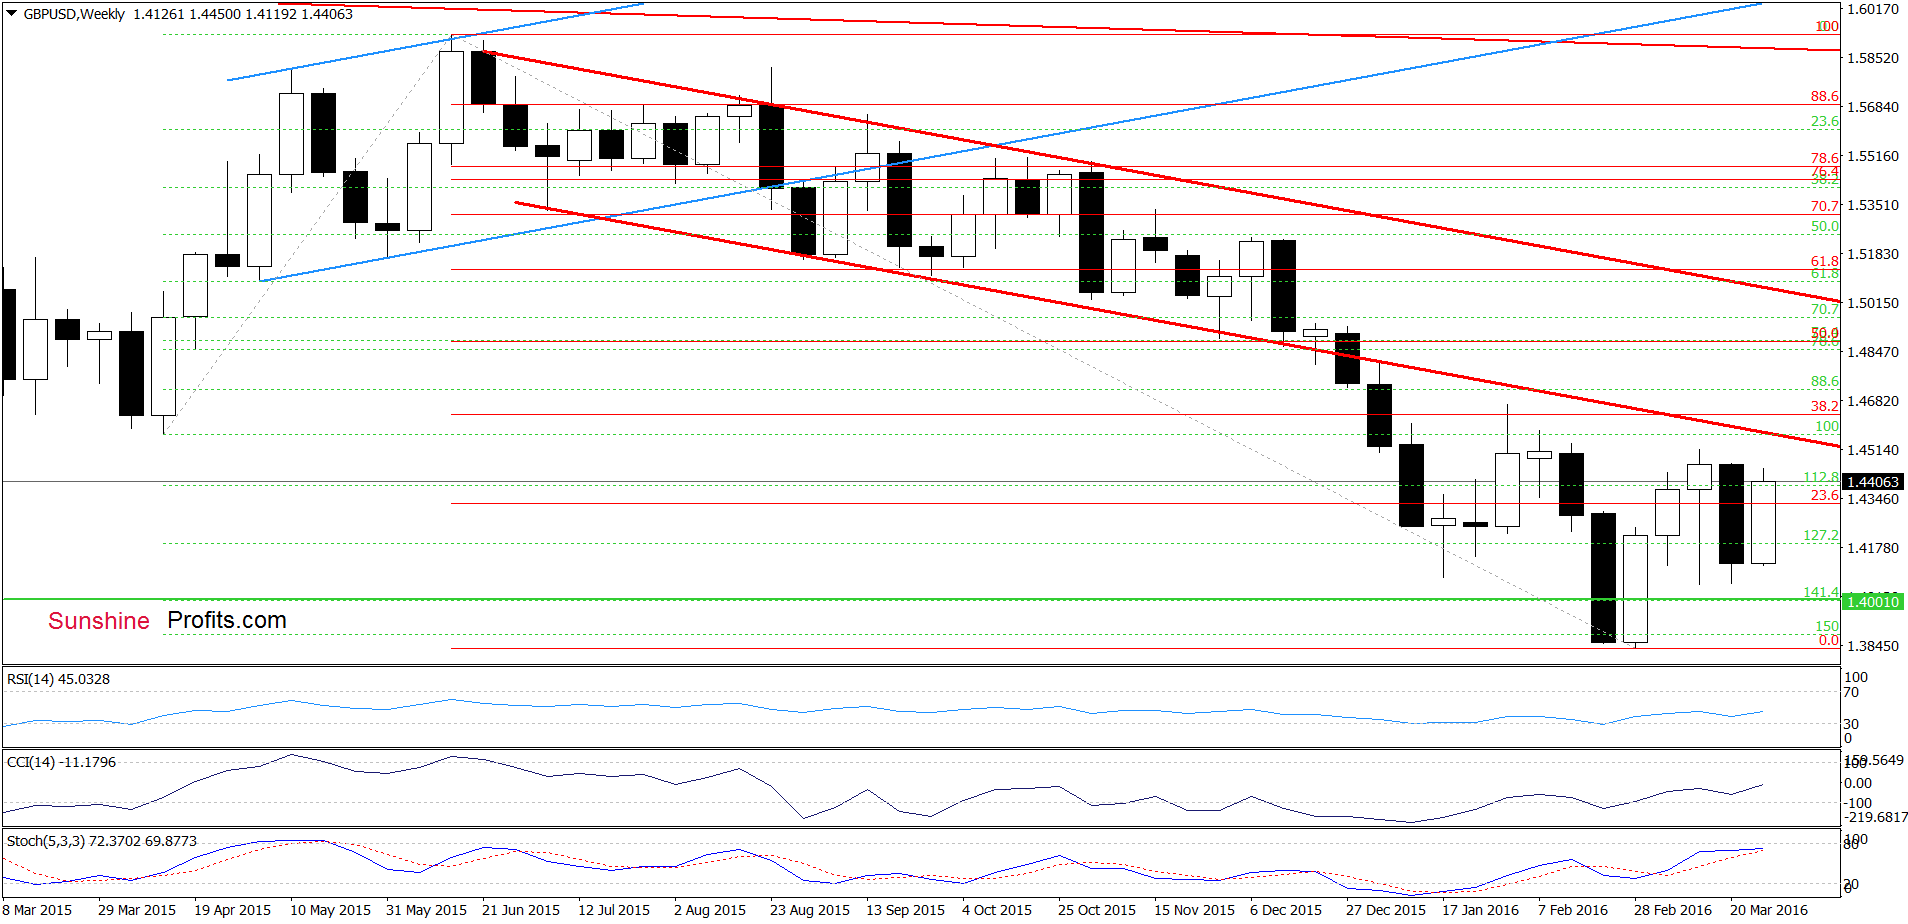
Quoting our last commentary on this currency pair:
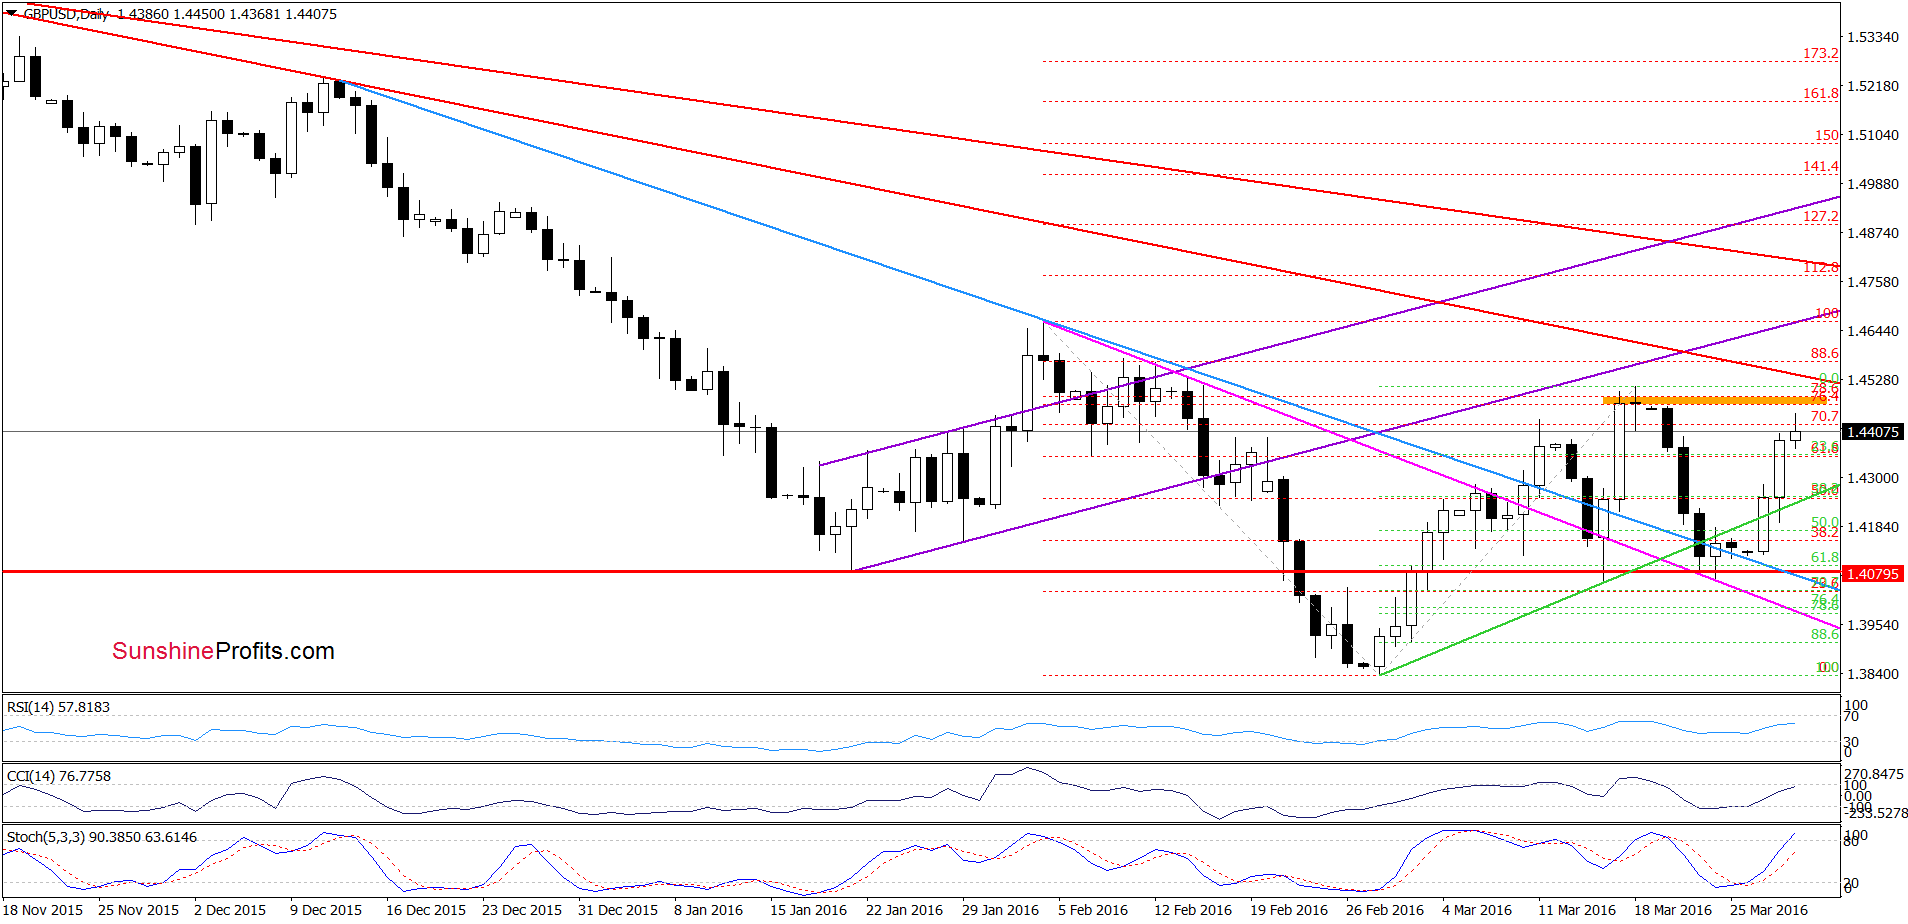
(…) the exchange rate (…) slipped below the green support line based on the previous lows, which is an additional negative signal. (…) the recent decline took the pair to the red horizontal support line based on the Jan low, which suggests that we may see a rebound from here – similarly to id-March upswing.
As you see on the daily chart, the red horizontal line in combination with the pink declining support line encouraged currency bulls to act, which triggered a sharp rebound in recent days. Taking this fact into account, and buy signals generated by the indicators, it seems that GBP/USD will re-test the orange resistance zone or even the red declining resistance line (currently around 1.4544) in the coming week.
Very short-term outlook: bullish
Short-term outlook: mixed with bullish bias
MT outlook: mixed
LT outlook: mixed
Trading position (short-term; our opinion): No positions are justified from the risk/reward perspective at the moment. We will keep you informed should anything change, or should we see a confirmation/invalidation of the above.
USD/CHF
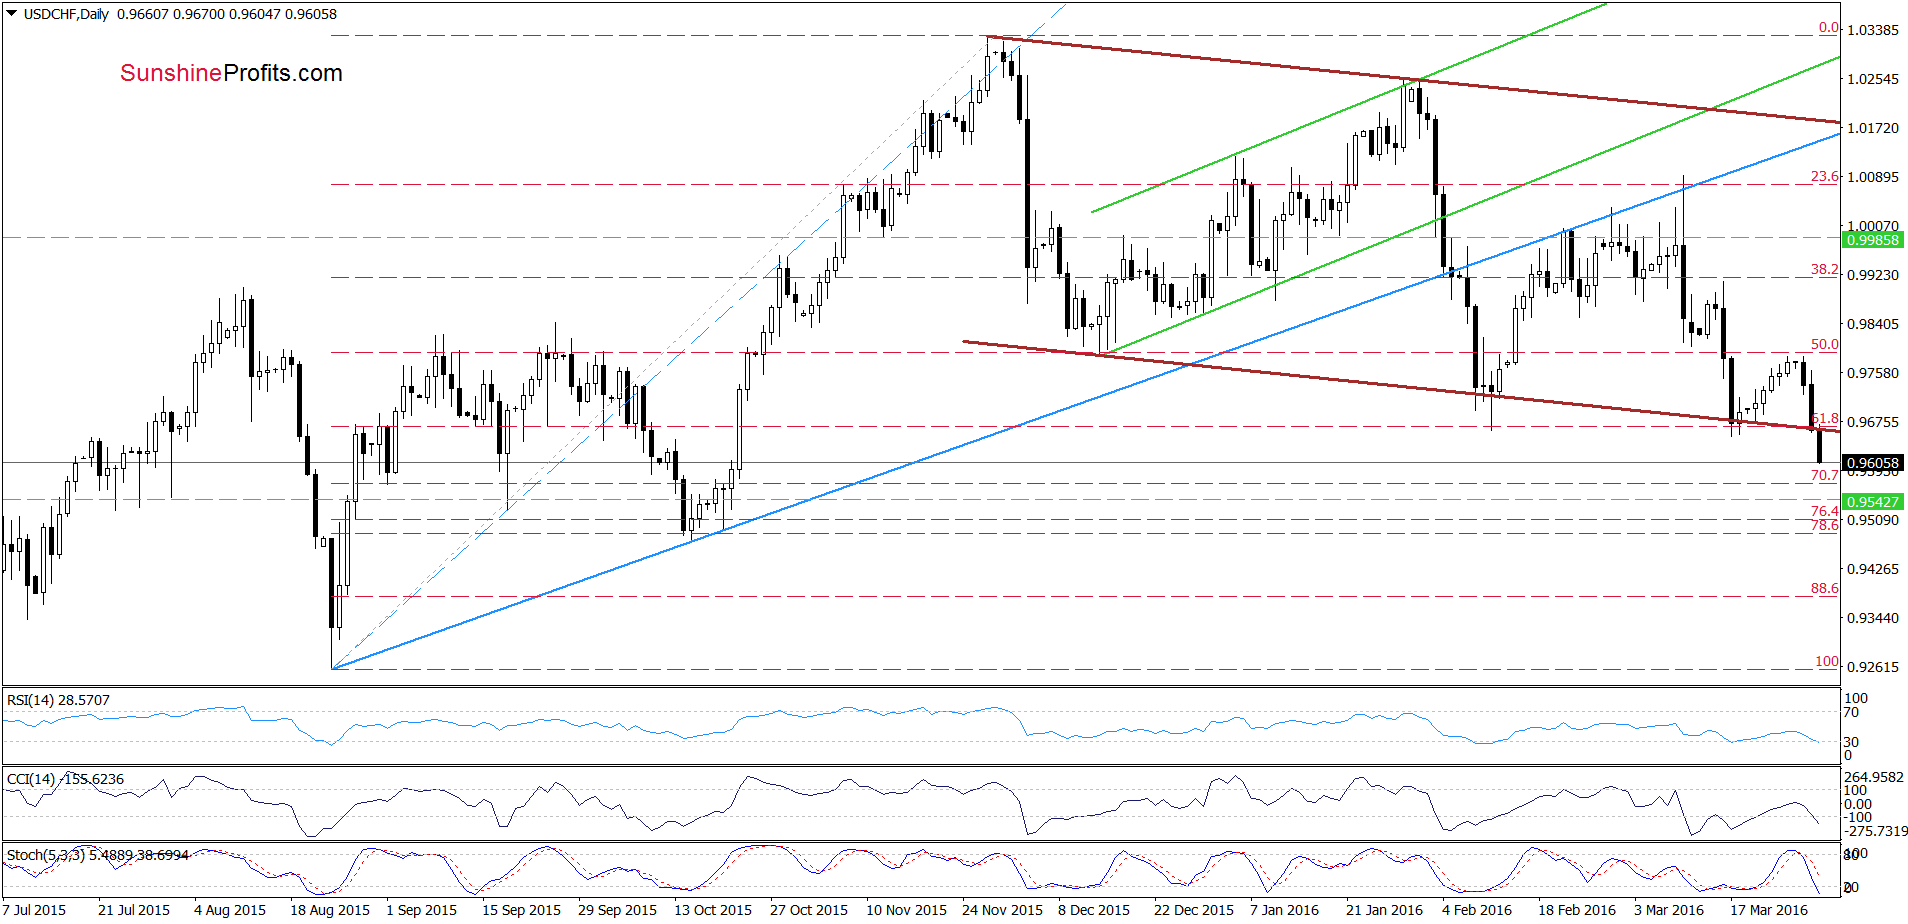
The first thing that catches the eye on the daily chart is drop under the previously-broken lower border of the brown declining trend channel, which in combination with sell signals generated by the indicators is a bearish signal that suggests further deterioration. How did this drop affect the medium-term picture? Let’s check.
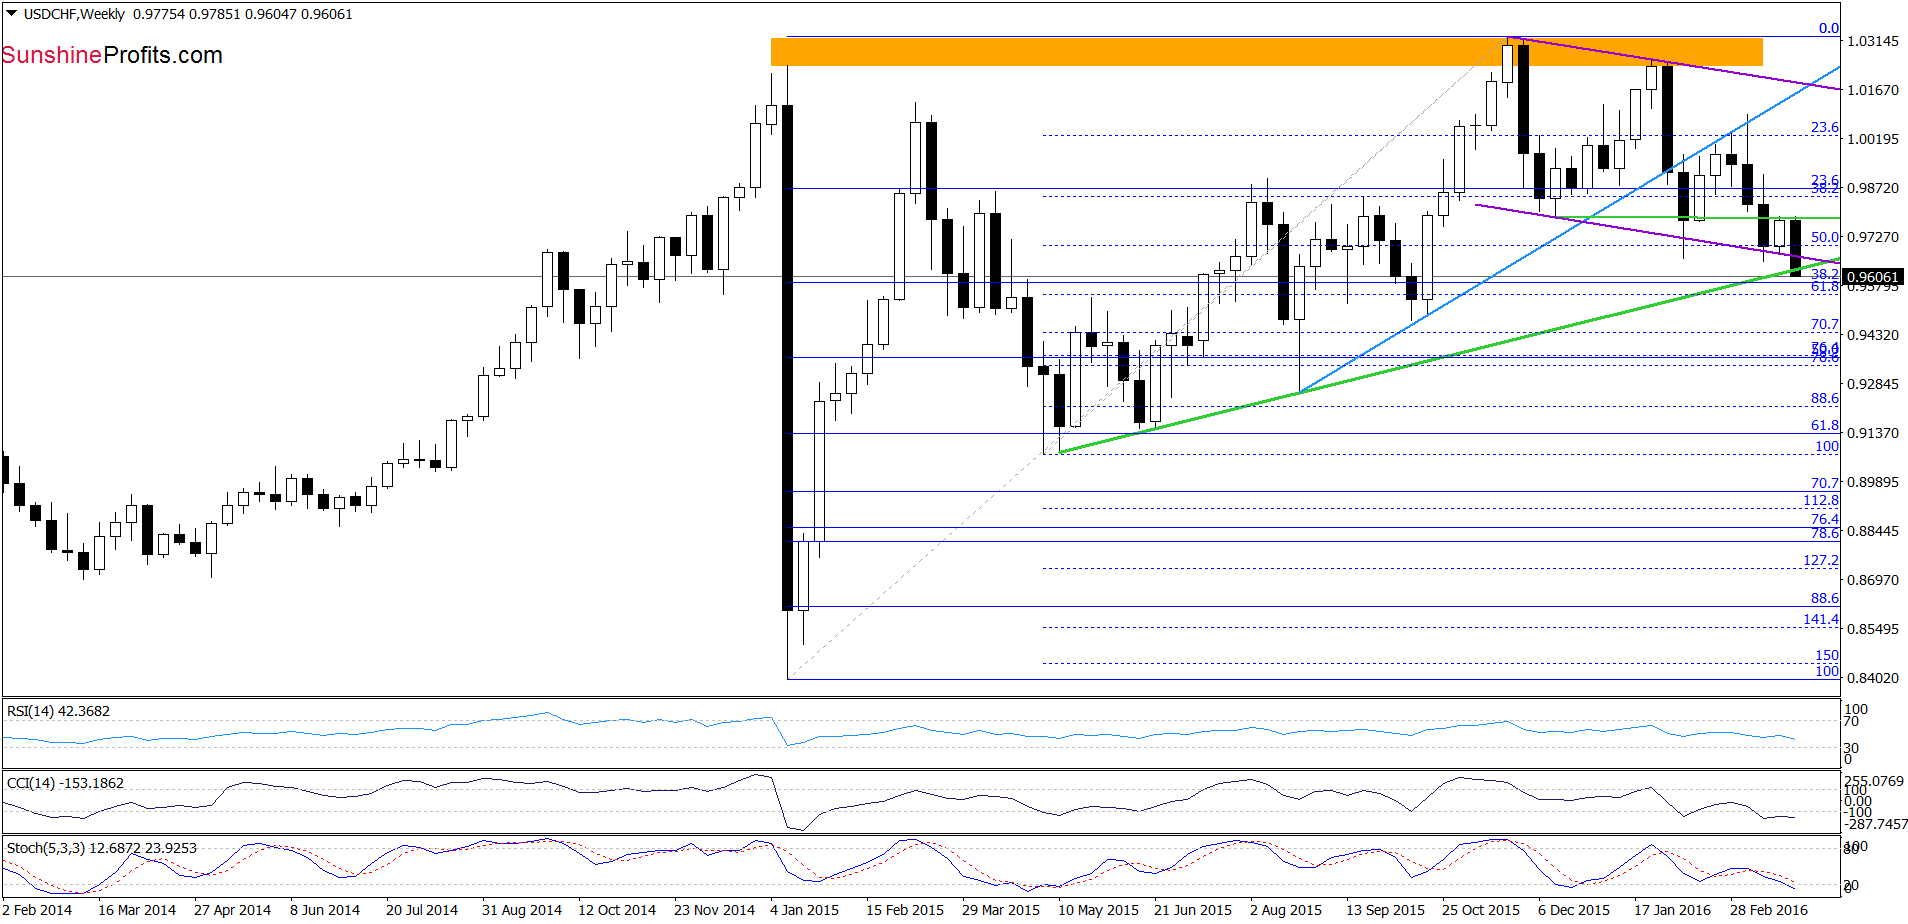
From today’s point of view, we see that today’s sharp drop took the pair under the medium-term green support line, which is an additional bearish signal. Taking all the above into account, we believe that closing long positions is justified from the risk/reward perspective at the moment.
Very short-term outlook: bearish
Short-term outlook: mixed with bearish bias
MT outlook: mixed
LT outlook: mixed
Trading position (short-term; our opinion): No positions are justified from the risk/reward perspective. We will keep you informed should anything change, or should we see a confirmation/invalidation of the above.
Thank you.
Nadia Simmons
Forex & Oil Trading Strategist
Przemyslaw Radomski, CFA
Founder, Editor-in-chief
Gold & Silver Trading Alerts
Forex Trading Alerts
Oil Investment Updates
Oil Trading Alerts


