Earlier today, the European Central Bank cut its deposit rate to -0.3% from -0.20%. Despite this move, the bank left the main refinancing rate unchanged, which together pushed the euro sharply higher against the greenback. As a result, EUR/USD invalidated earlier breakdowns and climbed above important resistance lines. How high could the exchange rate climb in the coming days?
In our opinion the following forex trading positions are justified - summary:
EUR/USD
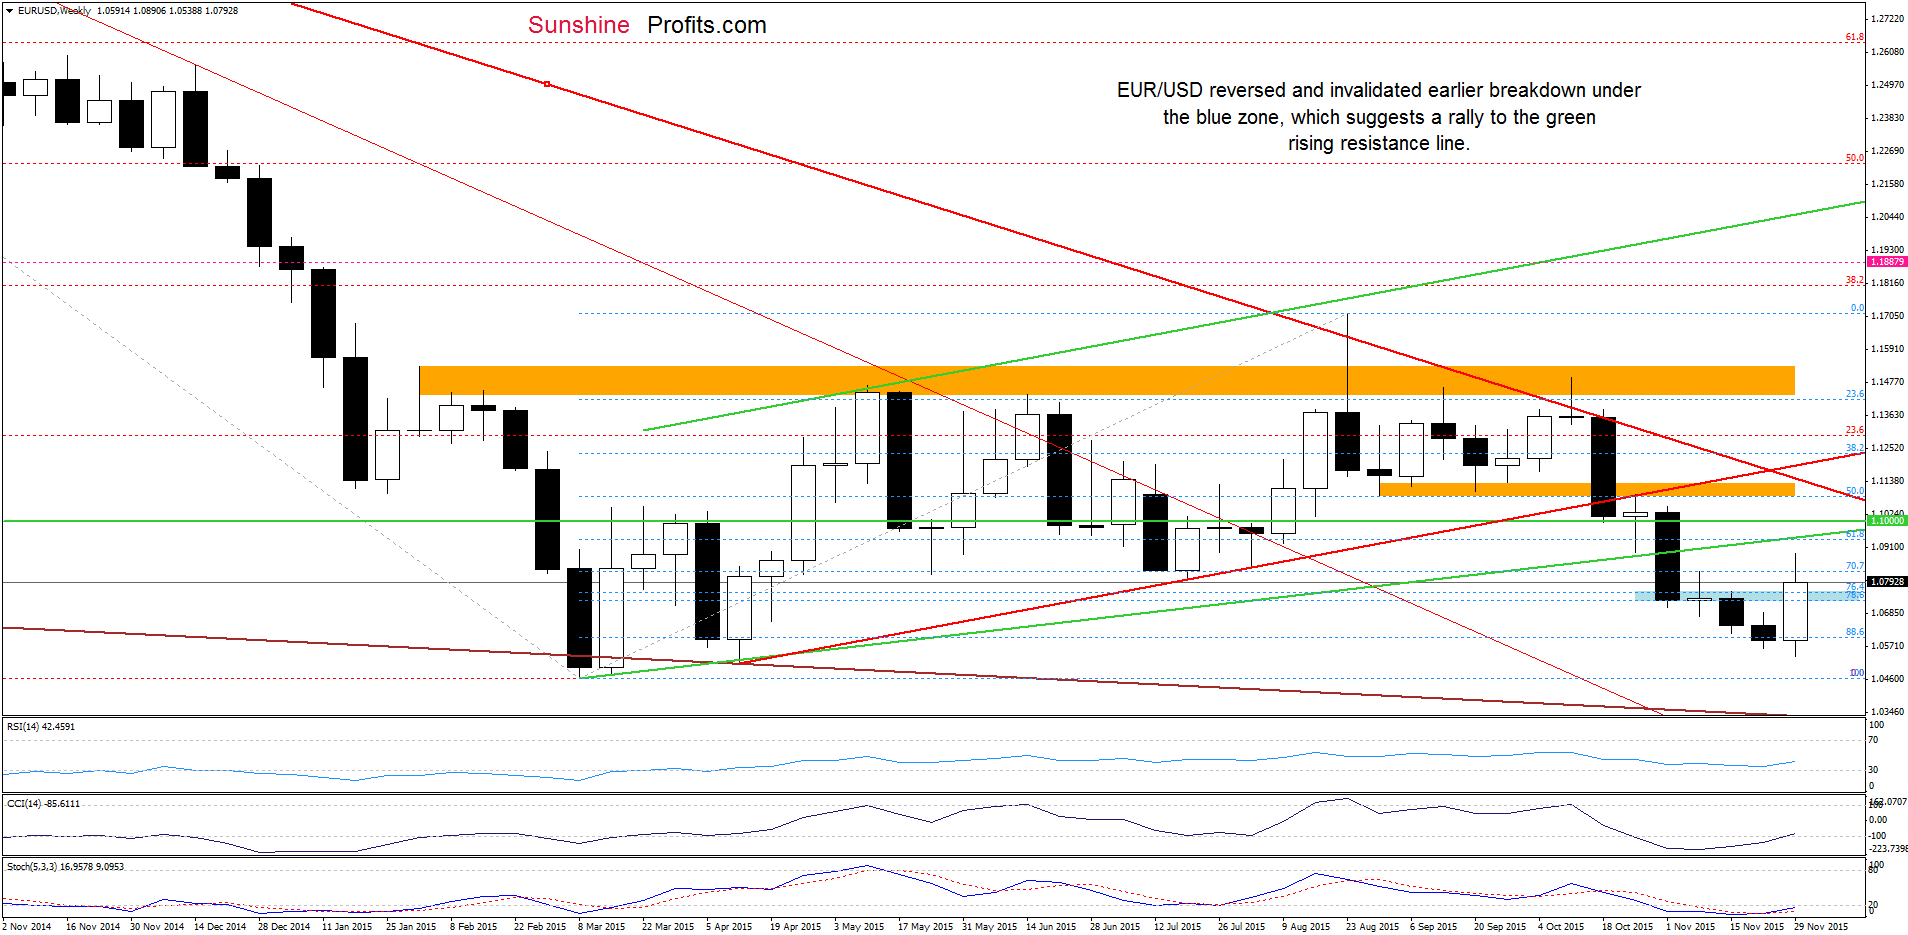
The first thing that catches the eye on the weekly chart is an invalidation of the breakdown under the 88.6% Fibonacci retracement and the blue zone. These positive factors encouraged currency bulls to act, which resulted in a sharp rebound.
What impact did this move have on the very short-term picture? Let’s check.
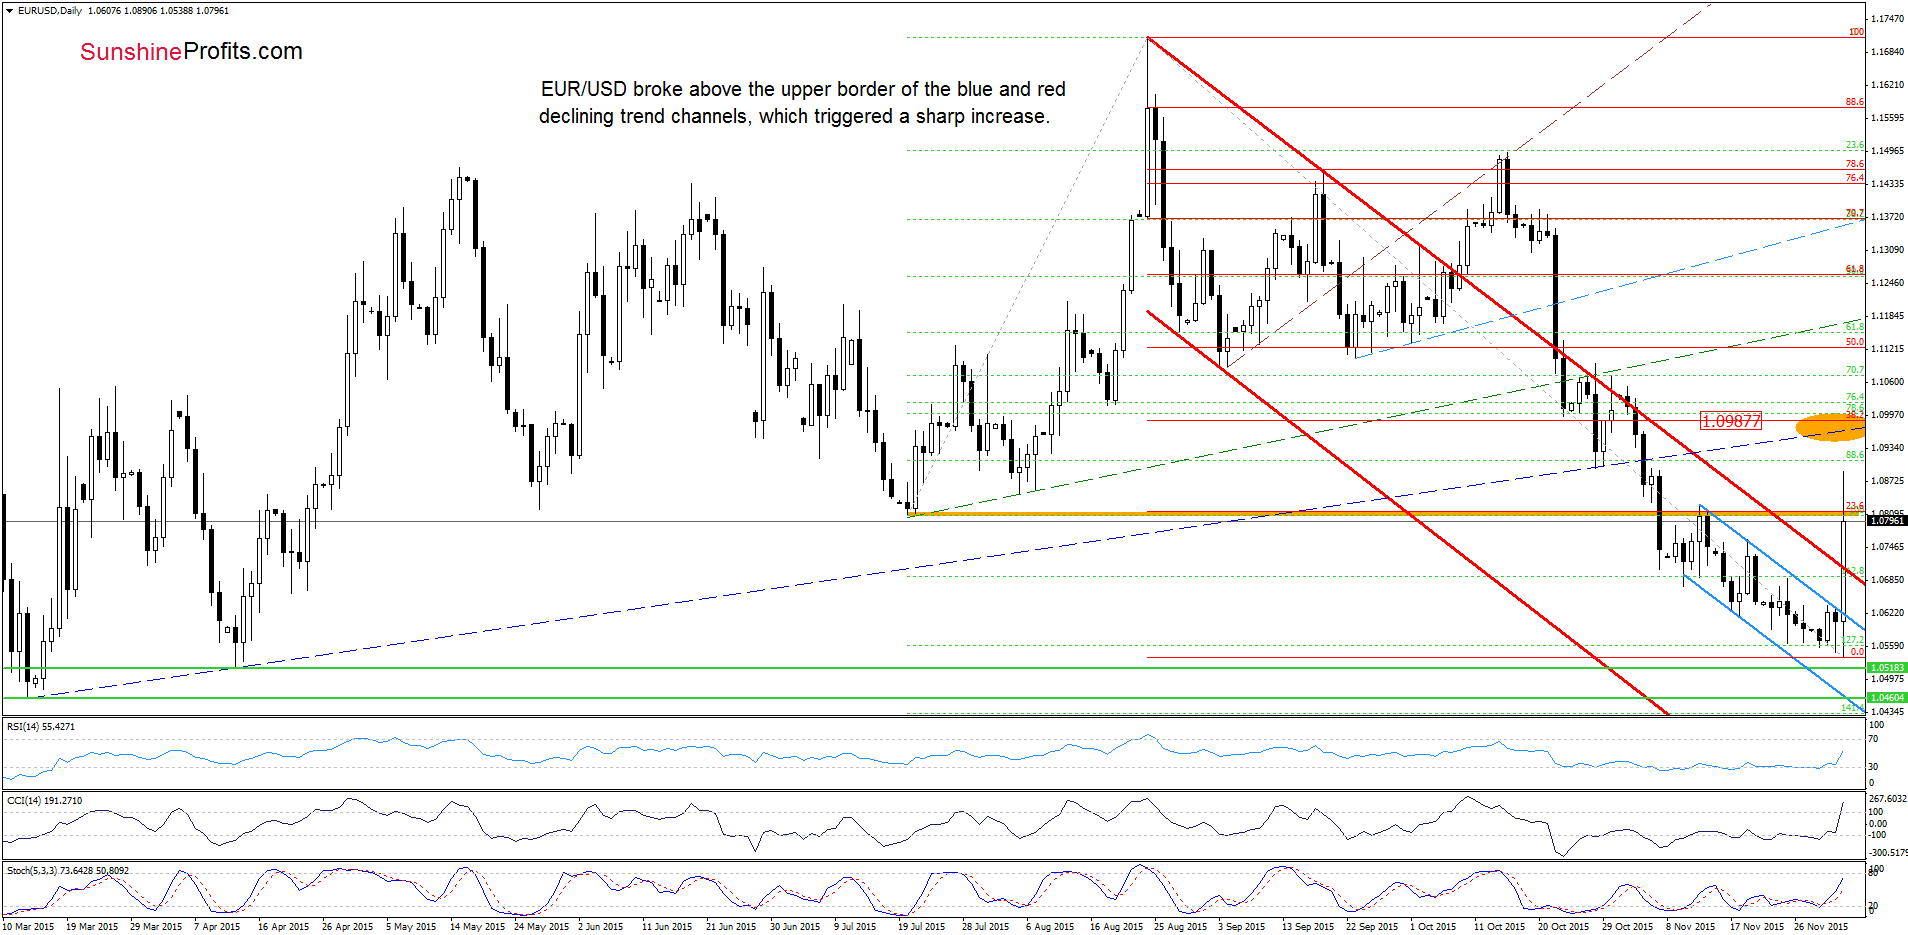
Quoting our previous commentary:
(…) the pair remains in the blue declining trend channel, which means that as long as there is no breakout above the upper border of the formation sizable upward move is not likely to be seen and another test of the 127.2% Fibonacci extension can’t be ruled out.
As you see on the daily chart the situation developed in line with the above scenario and EUR/USD slipped to a fresh low earlier today. Despite this move, the pair reversed and rebounded sharply, breaking above the upper border of the blue declining trend channel, which triggered a climb above the upper line of the red declining trend channel. With today’s upward move, the pair increased to the previously-broken resistance area (created by the Jul low and the mid-Nov high), which suggests that we may see further rally to the next resistance zone marked with the orange ellipse (created by the 38.2% Fibonacci retracement and the navy blue dashed resistance line based on the Mar and Apr lows) in the coming days.
Very short-term outlook: mixed with bullish bias
Short-term outlook: mixed
MT outlook: mixed
LT outlook: mixed
Trading position (short-term; our opinion): No positions are justified from the risk/reward perspective at the moment. We will keep you informed should anything change, or should we see a confirmation/invalidation of the above.
USD/CAD
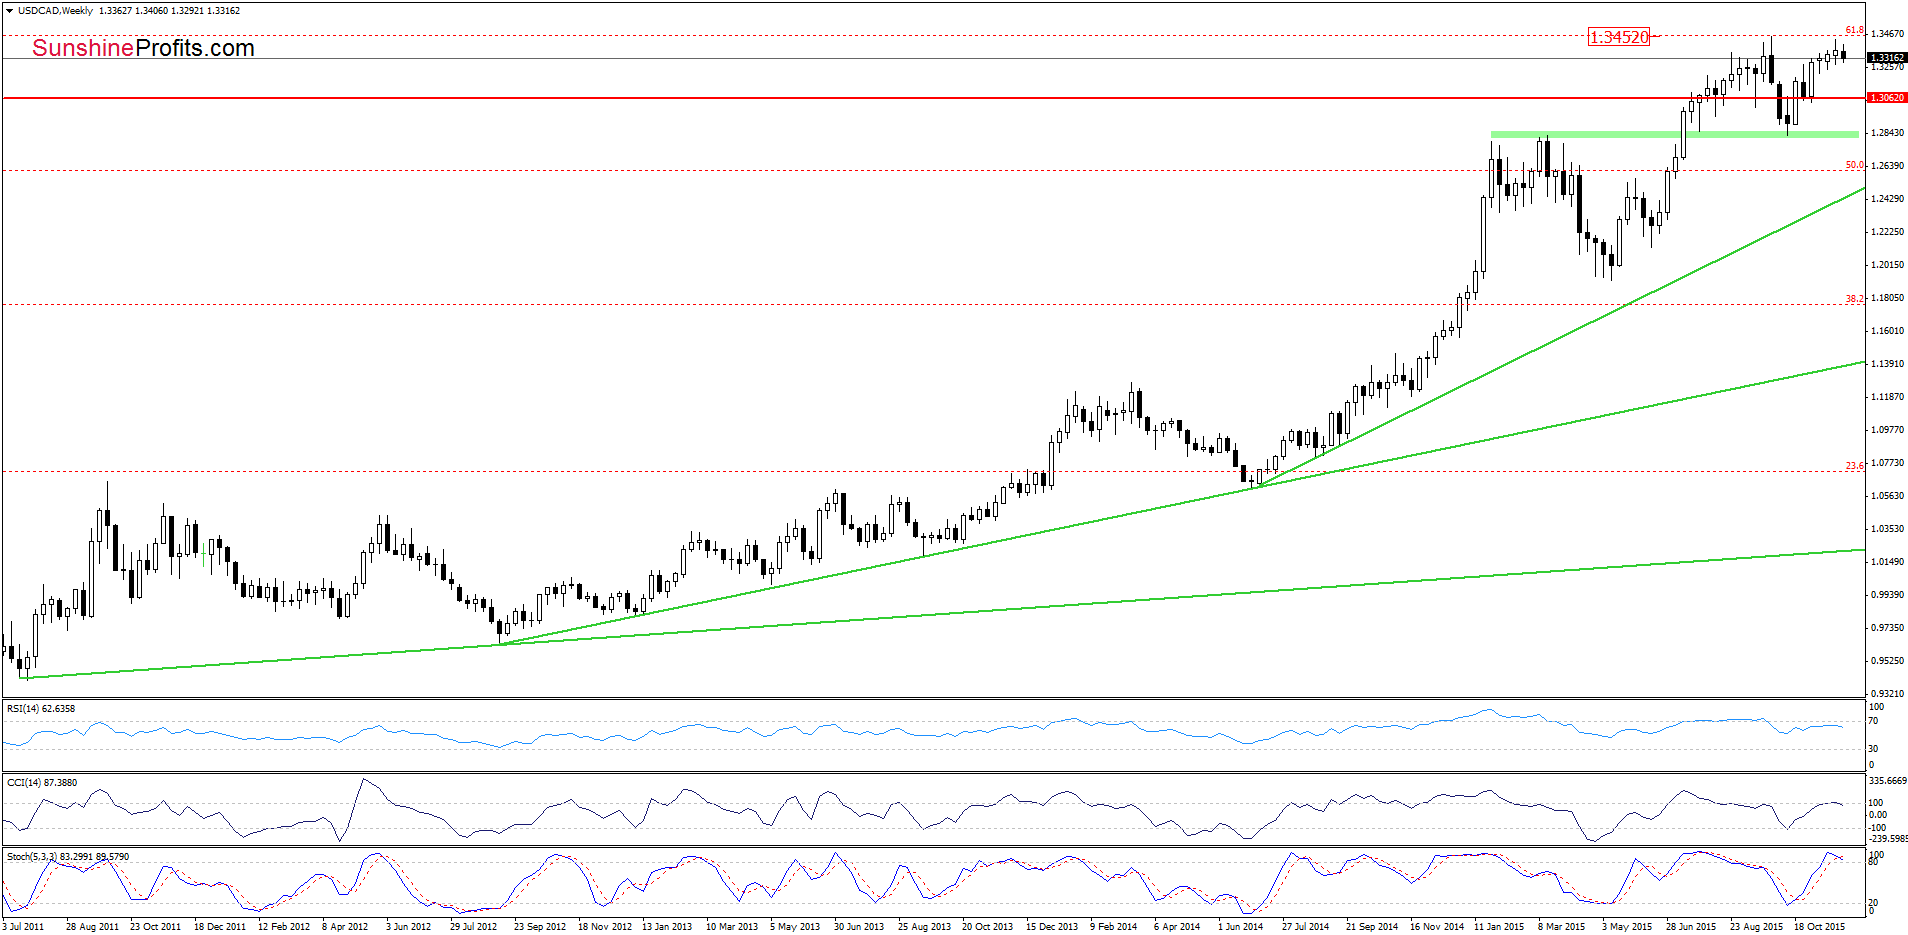
Although the medium-term picture has improved, the proximity to the 61.8% Fibonacci retracement and the previous high encouraged currency bears to act, which resulted in a pullback.
How did this drop affect the very short-term picture? Let’s check.
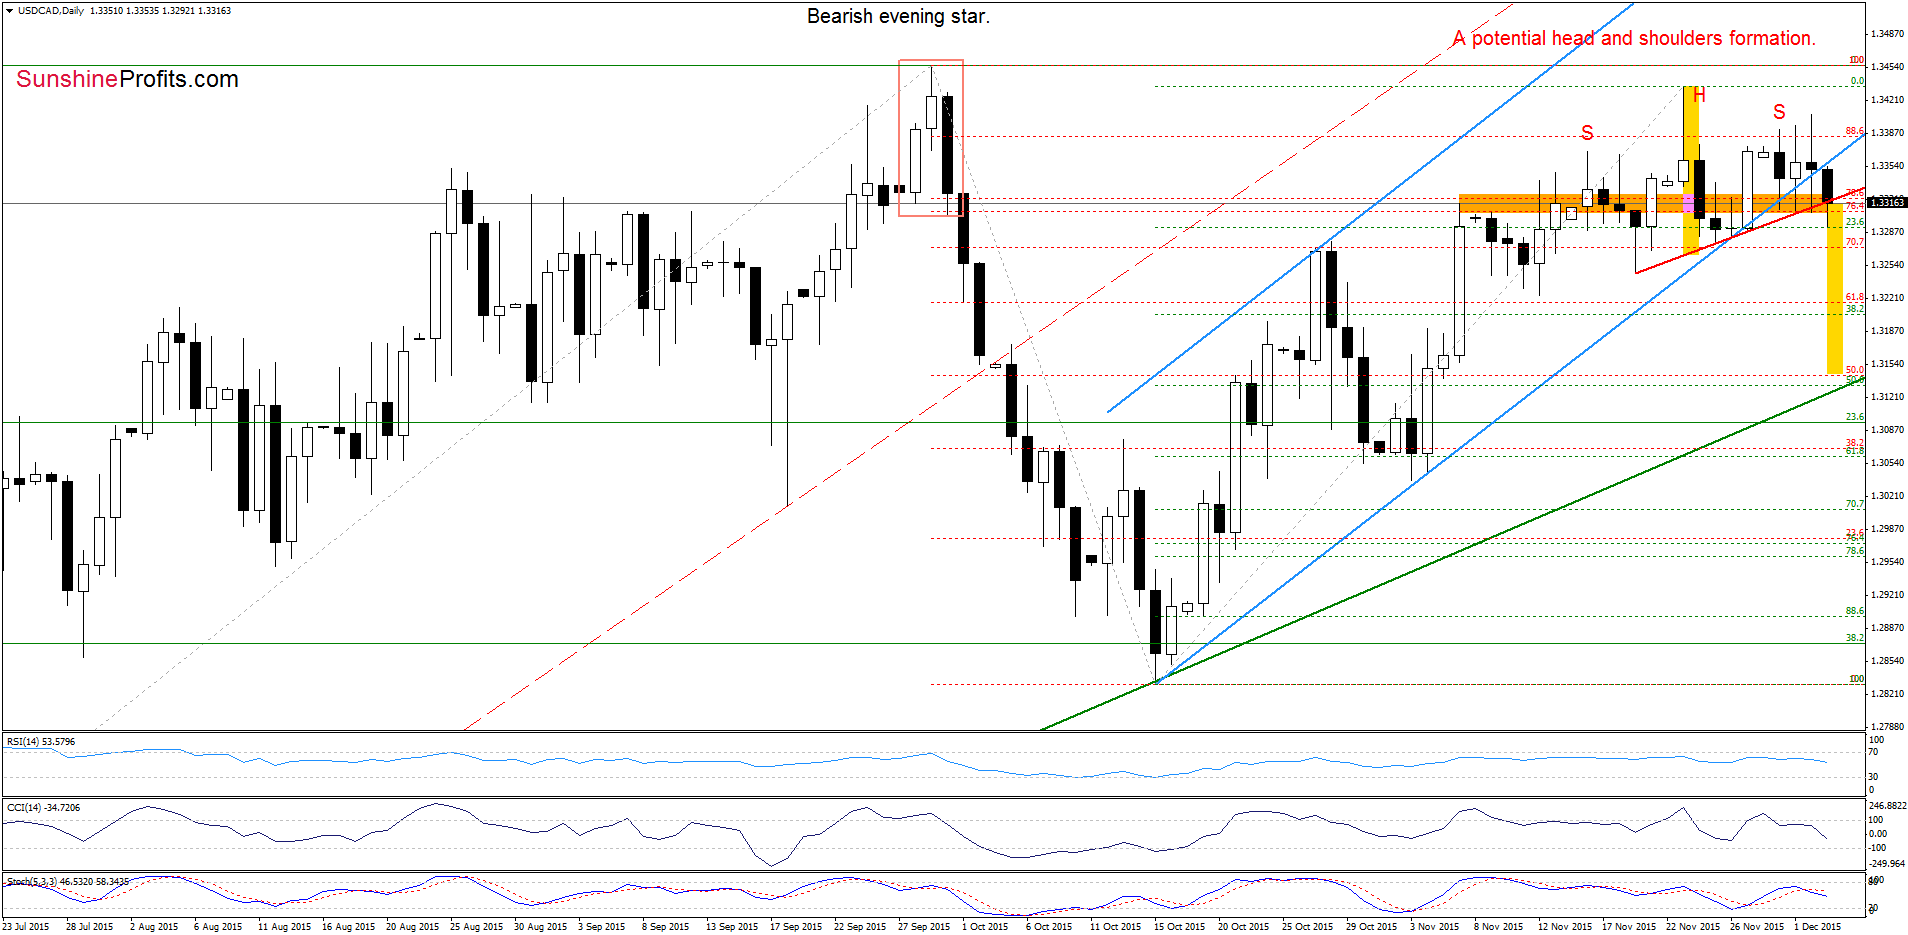
On the daily chart, we see that USD/CAD reversed and declined below the blue line (the lower border of the rising trend channel), which triggered further deterioration. With this downswing, the pair re-tested the strength of the orange zone and dropped to the 23.6% Fibonacci retracement. If this area withstands the selling pressure, we’ll see a rebound from here and another attempt to climb to the recent high. At this point it is worth noting that sell signals generated by the indicators remain in place, suggesting further deterioration. Nevertheless in our opinion as long as there is no daily closure below the red support line based on the Nov 19 and Nov 25 lows (the neck line of a potential head and shoulders formation) a sizable downward move is not likely to be seen and another attempt to move higher should not surprise us.
Very short-term outlook: mixed
Short-term outlook: mixed
MT outlook: mixed
LT outlook: mixed
Trading position (short-term; our opinion): No positions are justified from the risk/reward perspective at the moment. We will keep you informed should anything change, or should we see a confirmation/invalidation of the above.
AUD/USD
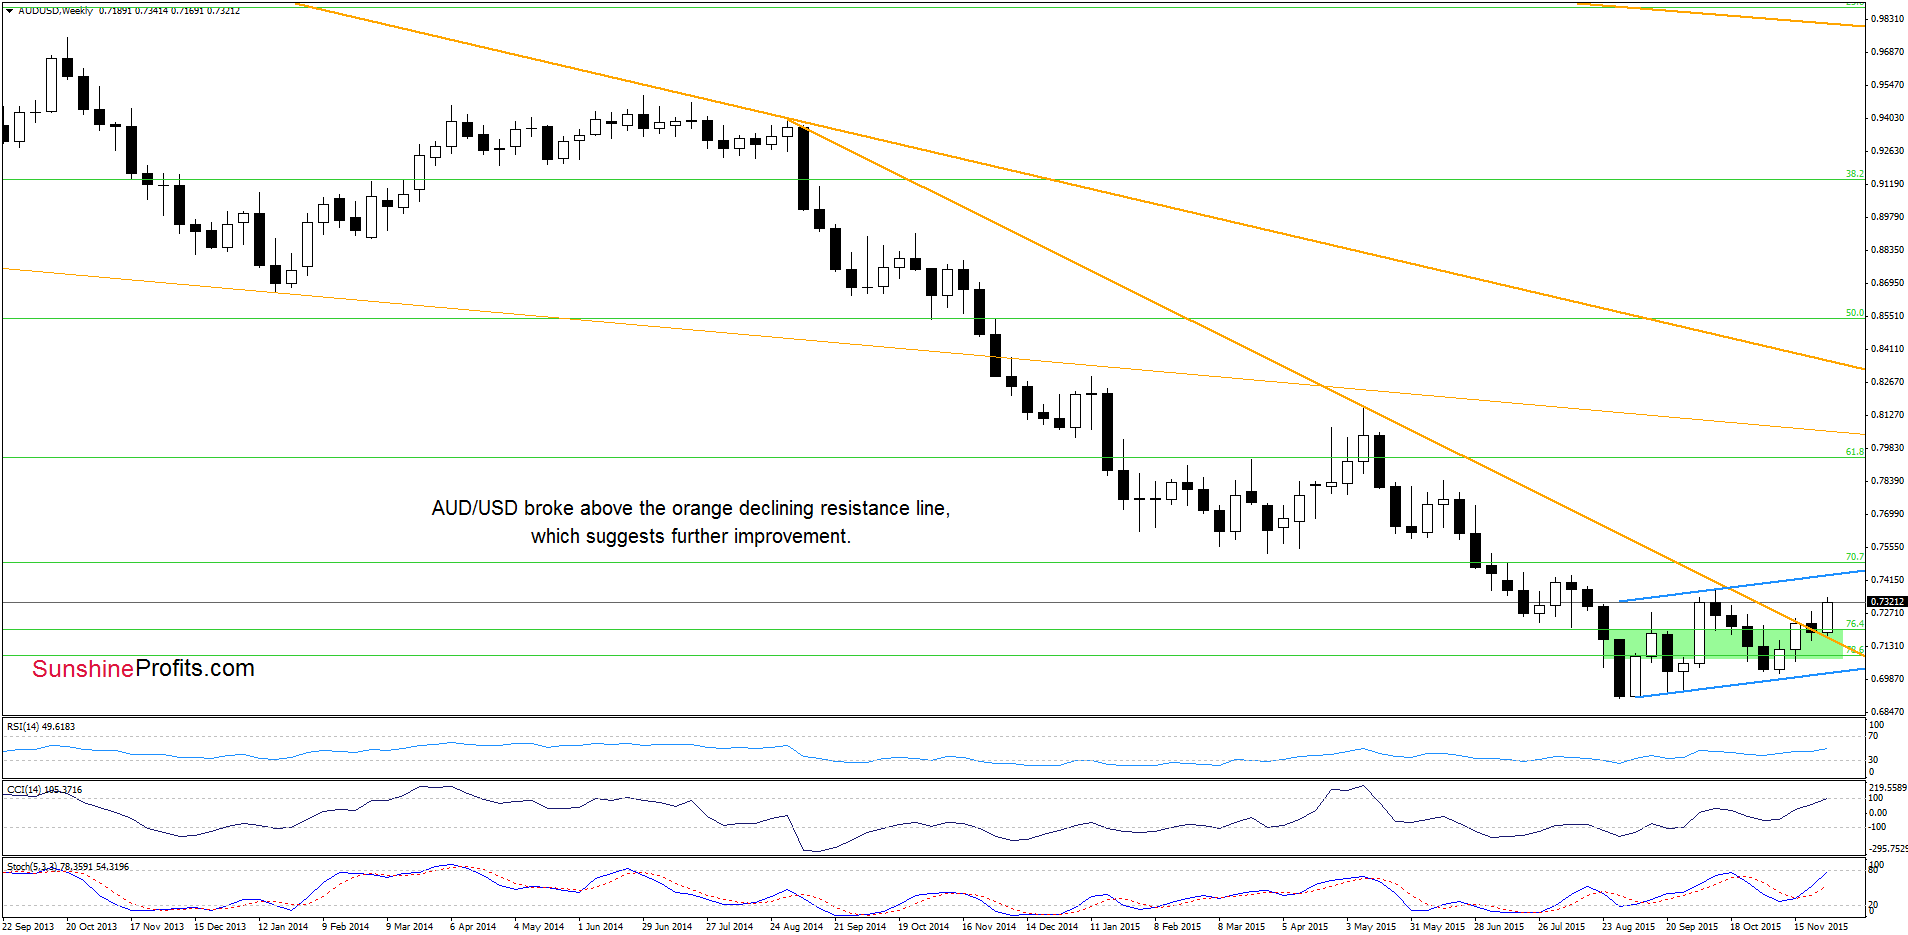
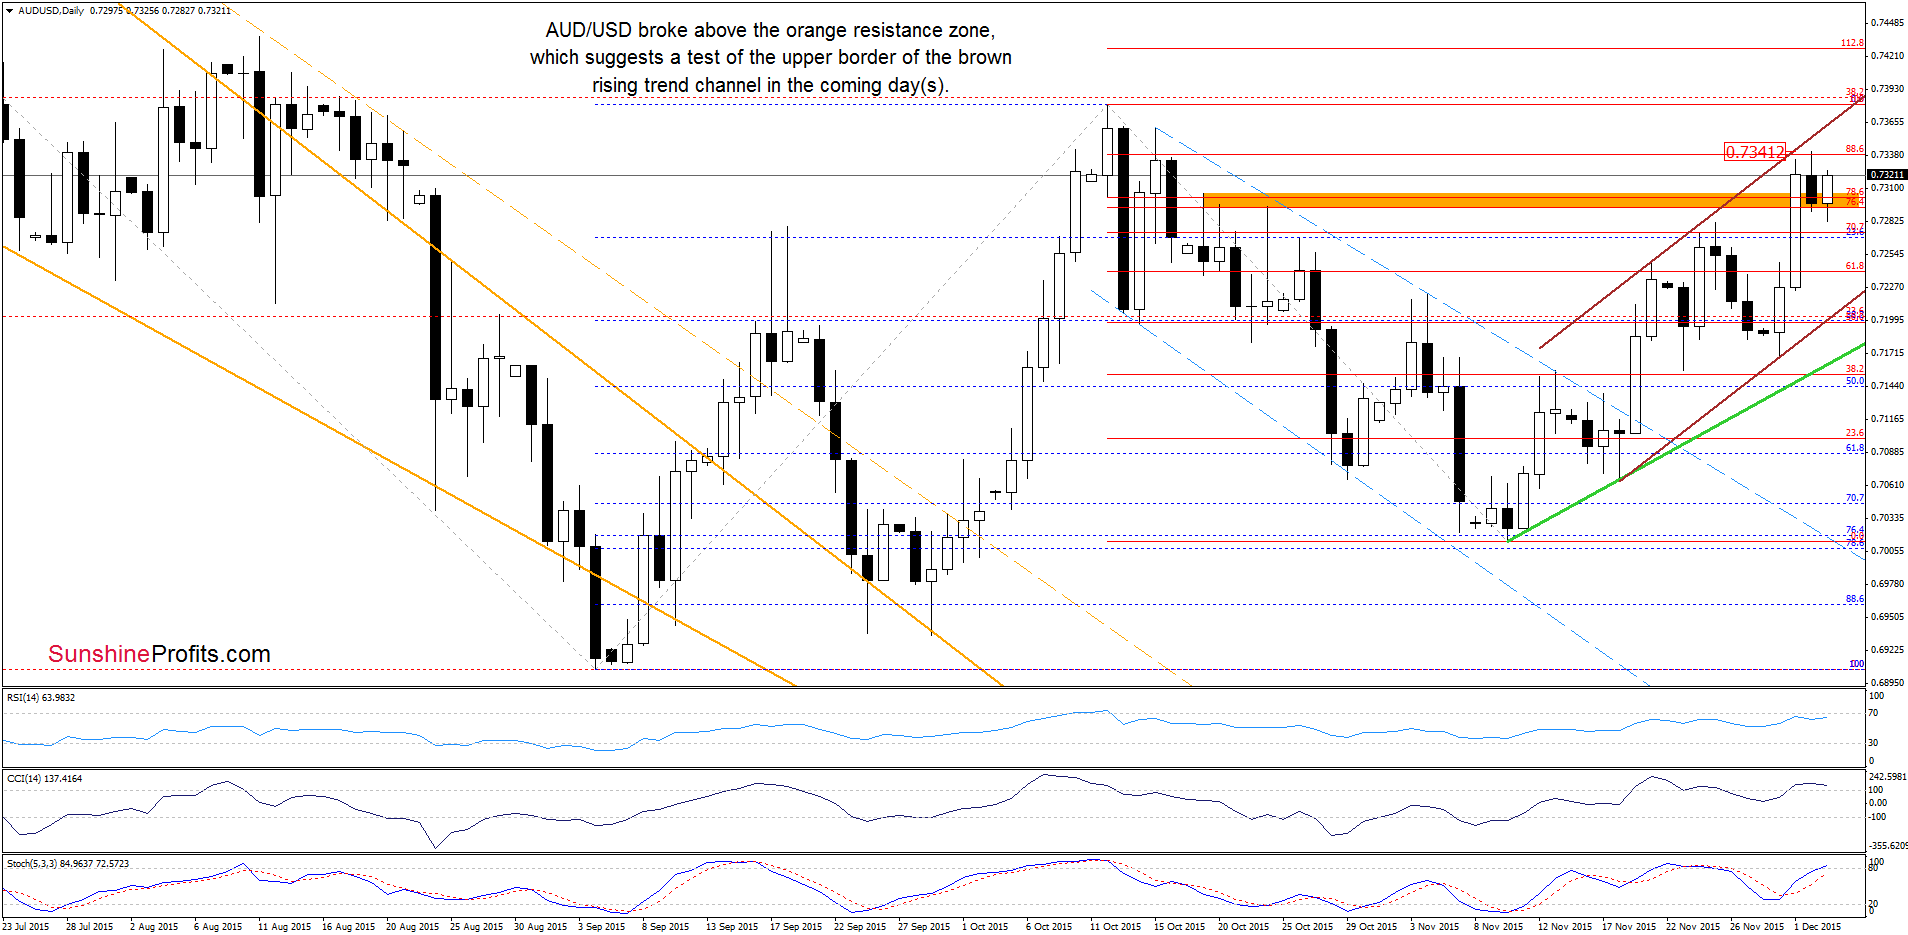
Looking at the daily chart we see that AUD/USD moved higher and broke above the orange resistance zone (created by the Fibonacci retracements, the Oct 19, Oct 20 and Oct 23 highs), which is a positive signal that suggests further improvement and a test of the upper border of the brown rising trend channel (currently around 0.7363) in the coming days (please note that this scenario is supported by buy signals generated by the indicators). If this resistance is broken, we may see an increase to the Oct high of 0.7380 or even a rally to around 0.7437, where the upper border of the blue rising trend channel (marked on the weekly chart) is.
Very short-term outlook: mixed with bullish bias
Short-term outlook: mixed
MT outlook: mixed
LT outlook: mixed
Trading position (short-term; our opinion): No positions are justified from the risk/reward perspective at the moment. We will keep you informed should anything change, or should we see a confirmation/invalidation of the above.
Thank you.
Nadia Simmons
Forex & Oil Trading Strategist
Przemyslaw Radomski, CFA
Founder, Editor-in-chief
Gold & Silver Trading Alerts
Forex Trading Alerts
Oil Investment Updates
Oil Trading Alerts


