Yesterday, the Markit/CIPS Services data showed that the British PMI increased to 57.2 in January, beating analysts’ expectations for a rise to 56.3. Additionally, earlier today, industry data showed that U.K. house price inflation rose 2.0% in January, while house prices in the previous month were 8.5% higher than the same month a year earlier. In these circumstances, GBP/USD moved higher and approached its key resistance zone. Will we finally see a breakout?
In our opinion the following forex trading positions are justified - summary:
- EUR/USD: long (stop loss order at 1.1219)
- GBP/USD: none
- USD/JPY: none
- USD/CAD: short (stop loss order at 1.2676)
- USD/CHF: none
- AUD/USD: none
EUR/USD
The medium-term picture hasn’t changed much as and invalidation of the breakdown below the 61.8% Fibonacci retracement and its positive impact on the exchange rate are still in effect. Having said that, let’s focus on the daily chart.

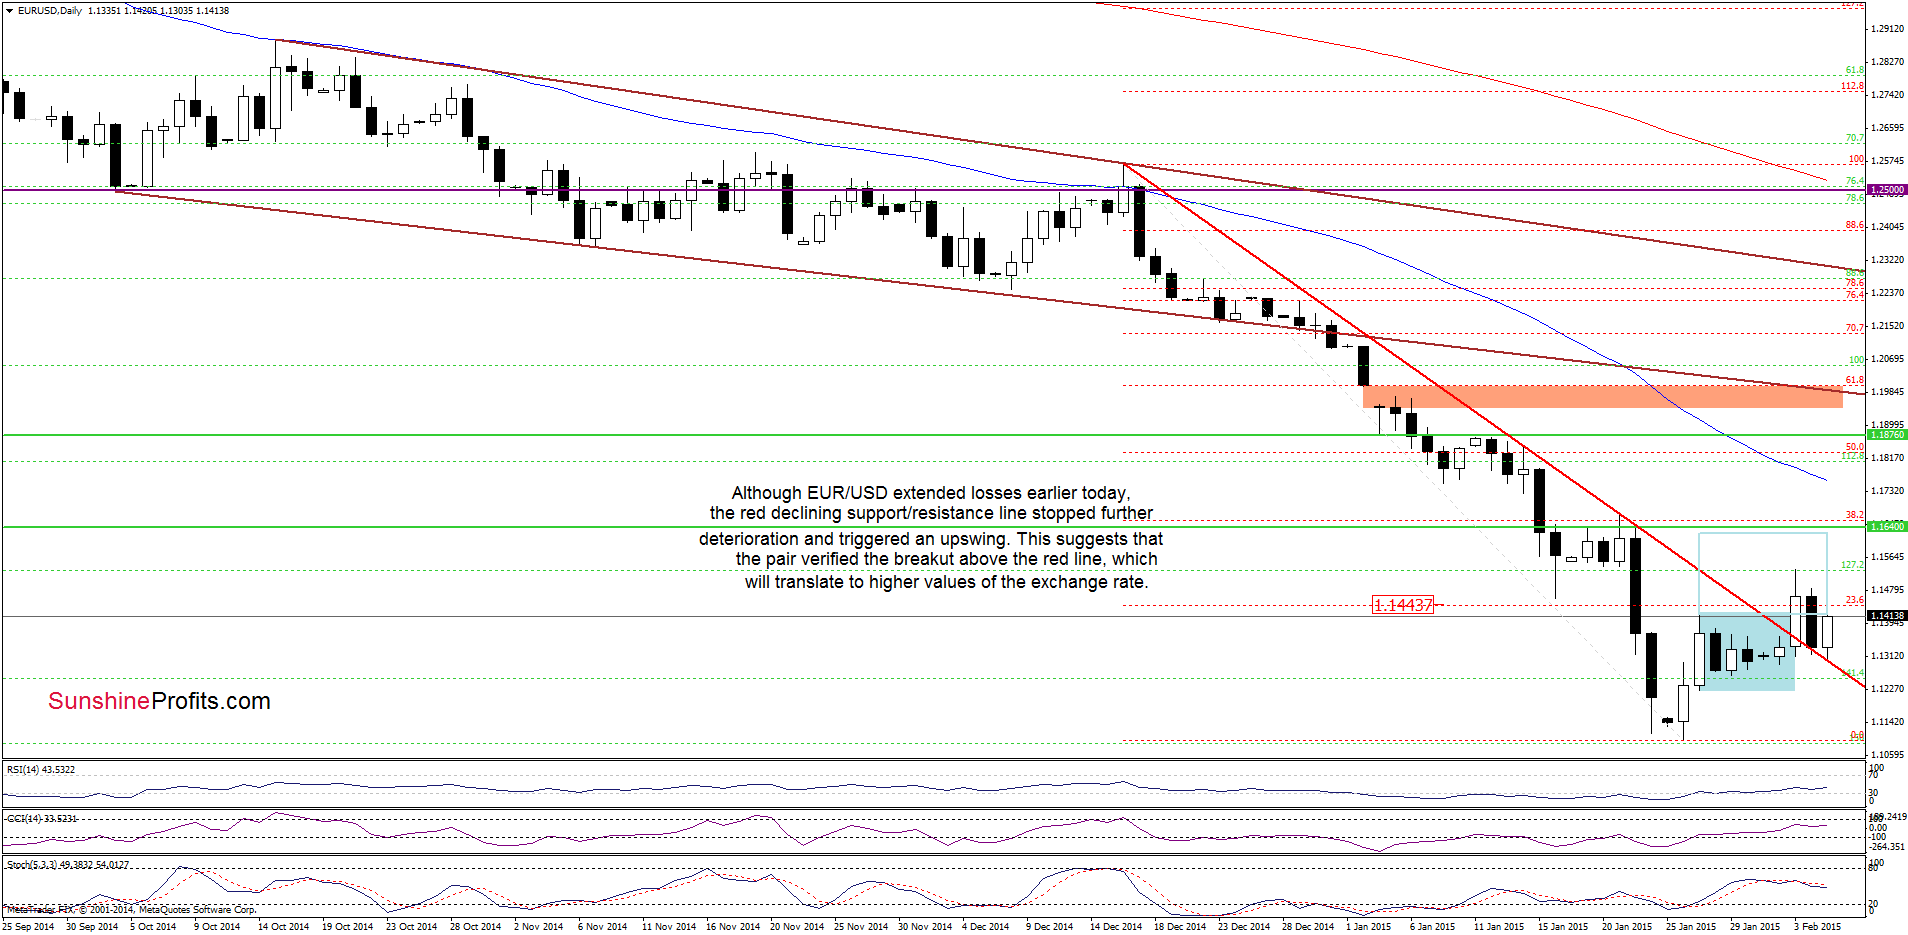
On the daily chart, we see that although EUR/USD declined earlier today, the red declining support/resistance line stopped further deterioration and triggered an upswing. This suggests that the pair verified the breakout above this important line, which will translate to higher values of the exchange rate. If this is the case, the initial upside target would be the resistance zone created by the Jan 22 high and the previously-broken Nov 2005 low (around 1.1640).
Very short-term outlook: bullish
Short-term outlook: mixed
MT outlook: mixed
LT outlook: mixed
Trading position (short-term): Long positions with a stop loss order at 1.1219 are justified from the risk/reward perspective at the moment (if your positions were closed by the previous stop loss order, we suggest re-opening them). We will keep you informed should anything change, or should we see a confirmation/invalidation of the above.
GBP/USD

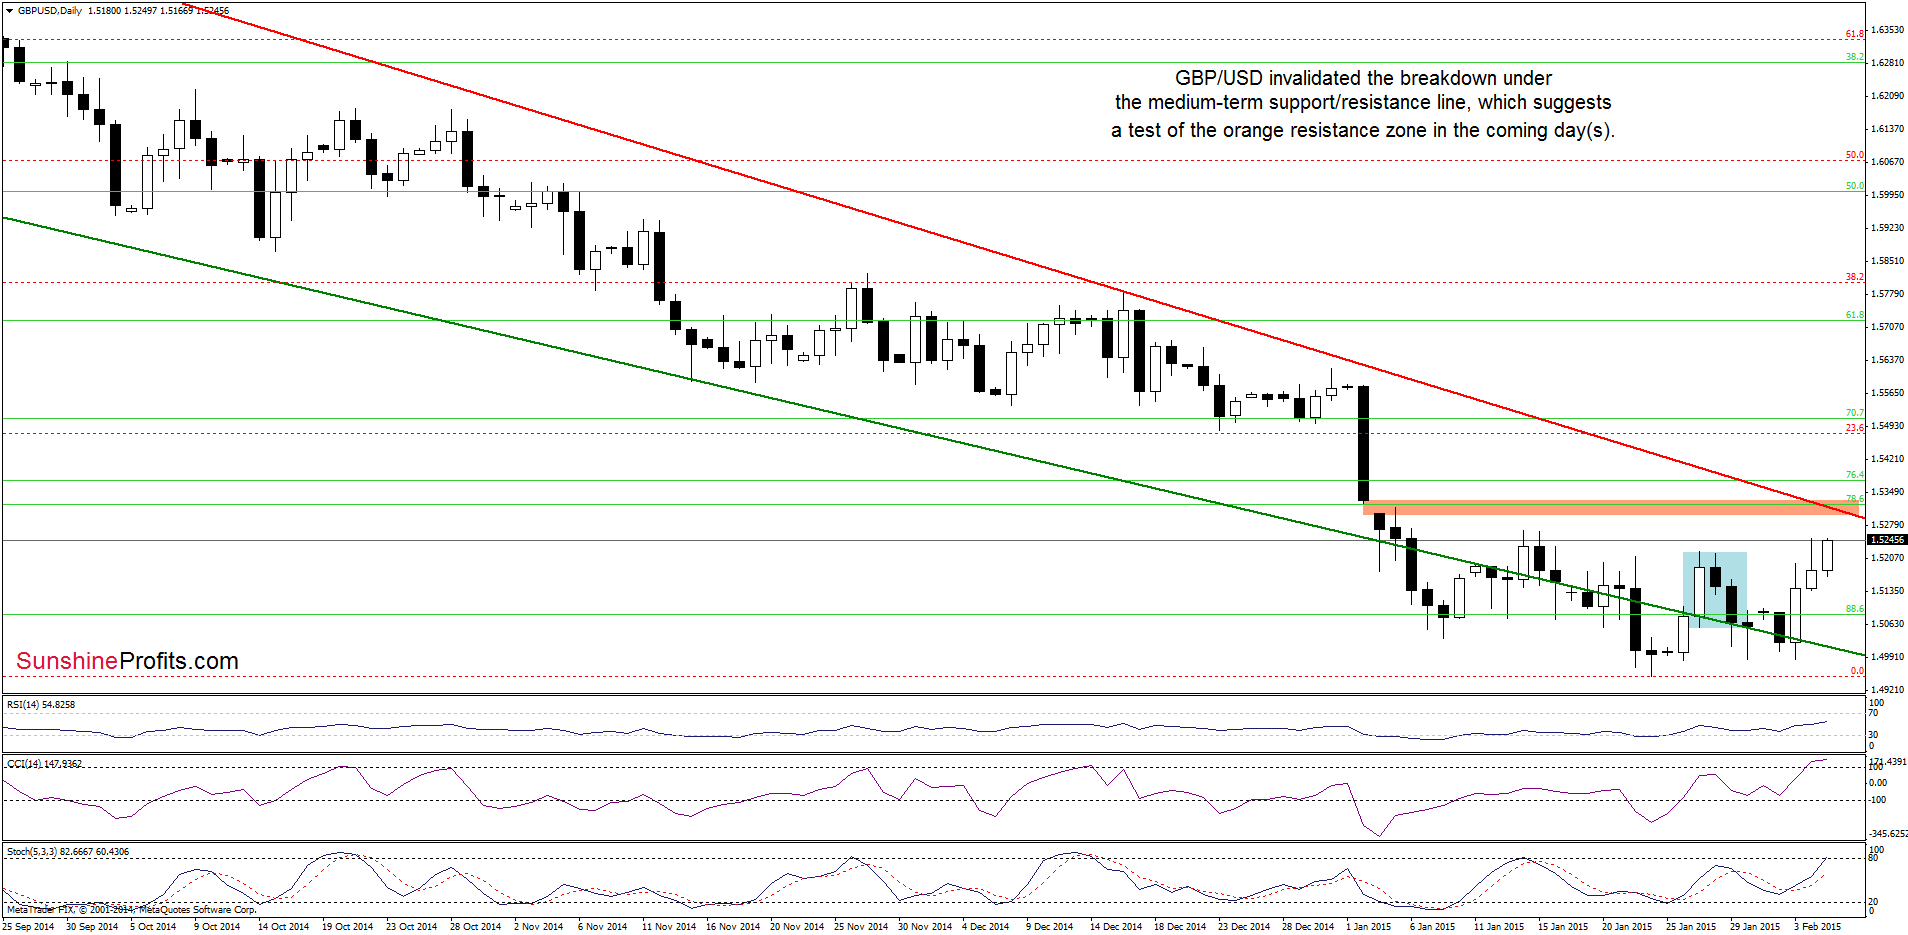
From this perspective, we see that GBP/USD moved sharply higher, invalidating the breakdown under the medium-term green support/resistance line once again. This positive signal triggered further improvement and an increase to around the mid-Jan highs. Although this is a bullish sign, we should keep in mind that the pair is still trading under the strong resistance zone created by the orange gap (between the Jan 2 and Jan 4) and the long-term red declining resistance line. Will we finally see a breakout? Before we answer this question, please take a closer look at the weekly chart.

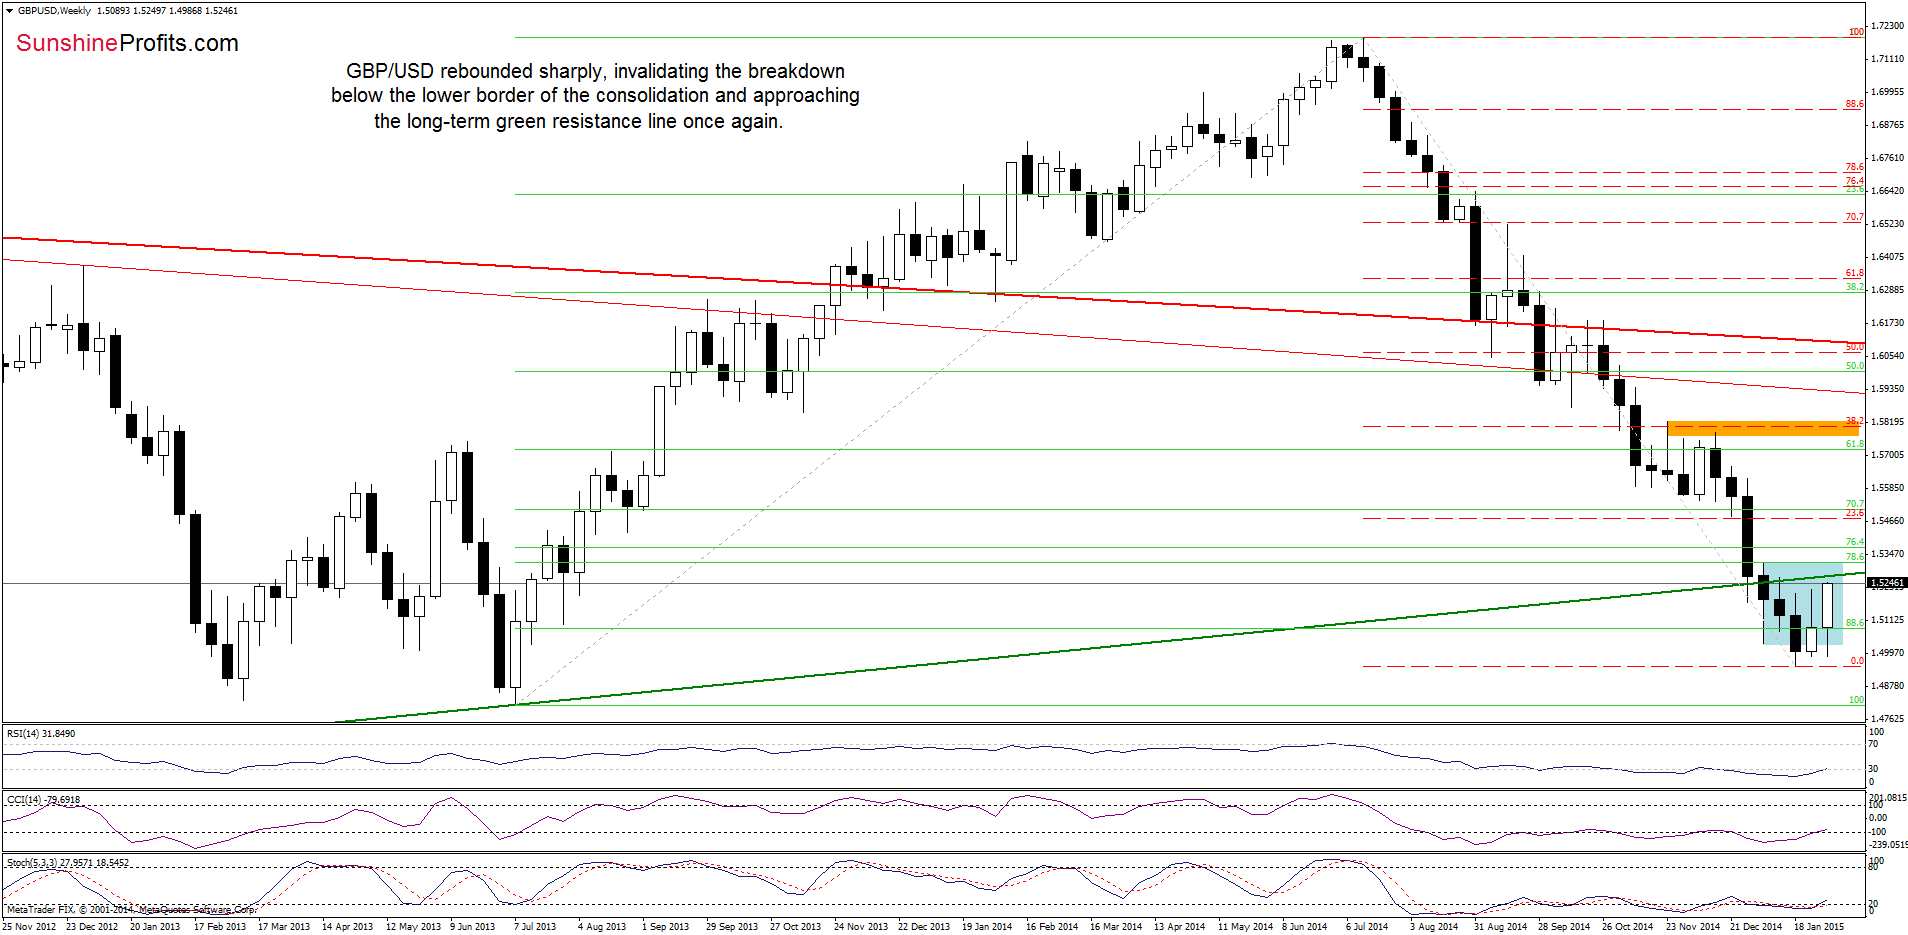
Looking at the above chart, we see that the situation in the medium-term has improved slightly as GBP/USD rebounded sharply, invalidating the breakdown under the lower border of the consolidation (marked with blue). With his upswing, the pair approached the long-term resistance line once again. What’s next? In all previous cases, this line was strong enough to stop further rally, which resulted in a pullback. However, this time, currency bulls have new allies – buy signals generated by all indicators, which increases the likelihood of an invalidation of the breakdown. Therefore, if we see such price action, we will likely also see a breakout above the resistance zone marked on the daily chart. Otherwise, another pullback should not surprise us.
Very short-term outlook: mixed
Short-term outlook: mixed
MT outlook: mixed
LT outlook: mixed
Trading position (short-term): In our opinion, no positions are justified from the risk/reward perspective at the moment. We will keep you informed should anything change, or should we see a confirmation/invalidation of the above.
AUD/USD

As you see on the weekly chart, an invalidation of the breakdown below the Jul 2009 lows and its potential positive impact on future moves is still in effect.
Having said that, let’s take a closer look at the daily chart.

On the daily chart, we see that AUD/USD bounced off the brown support line, which suggests that the pair verified the breakout above it. If this is the case, the bullish scenario from yesterday will be in play and (…) we’ll see another rebound and an increase to at least the upper line of the consolidation (around 0.7905). (…) Taking into account the current position of the indicators and the medium-term picture, it seems that we’ll see another attempt to move higher in the coming day(s).
Very short-term outlook: mixed with bullish bias
Short-term outlook: mixed
MT outlook: mixed
LT outlook: mixed
Trading position (short-term; our opinion): No positions are justified from the risk/reward perspective at the moment. We will keep you informed should anything change, or should we see a confirmation/invalidation of the above.
Thank you.
Nadia Simmons
Forex & Oil Trading Strategist
Forex Trading Alerts
Oil Investment Updates
Oil Trading Alerts


