In our opinion the following forex trading positions are justified - summary:
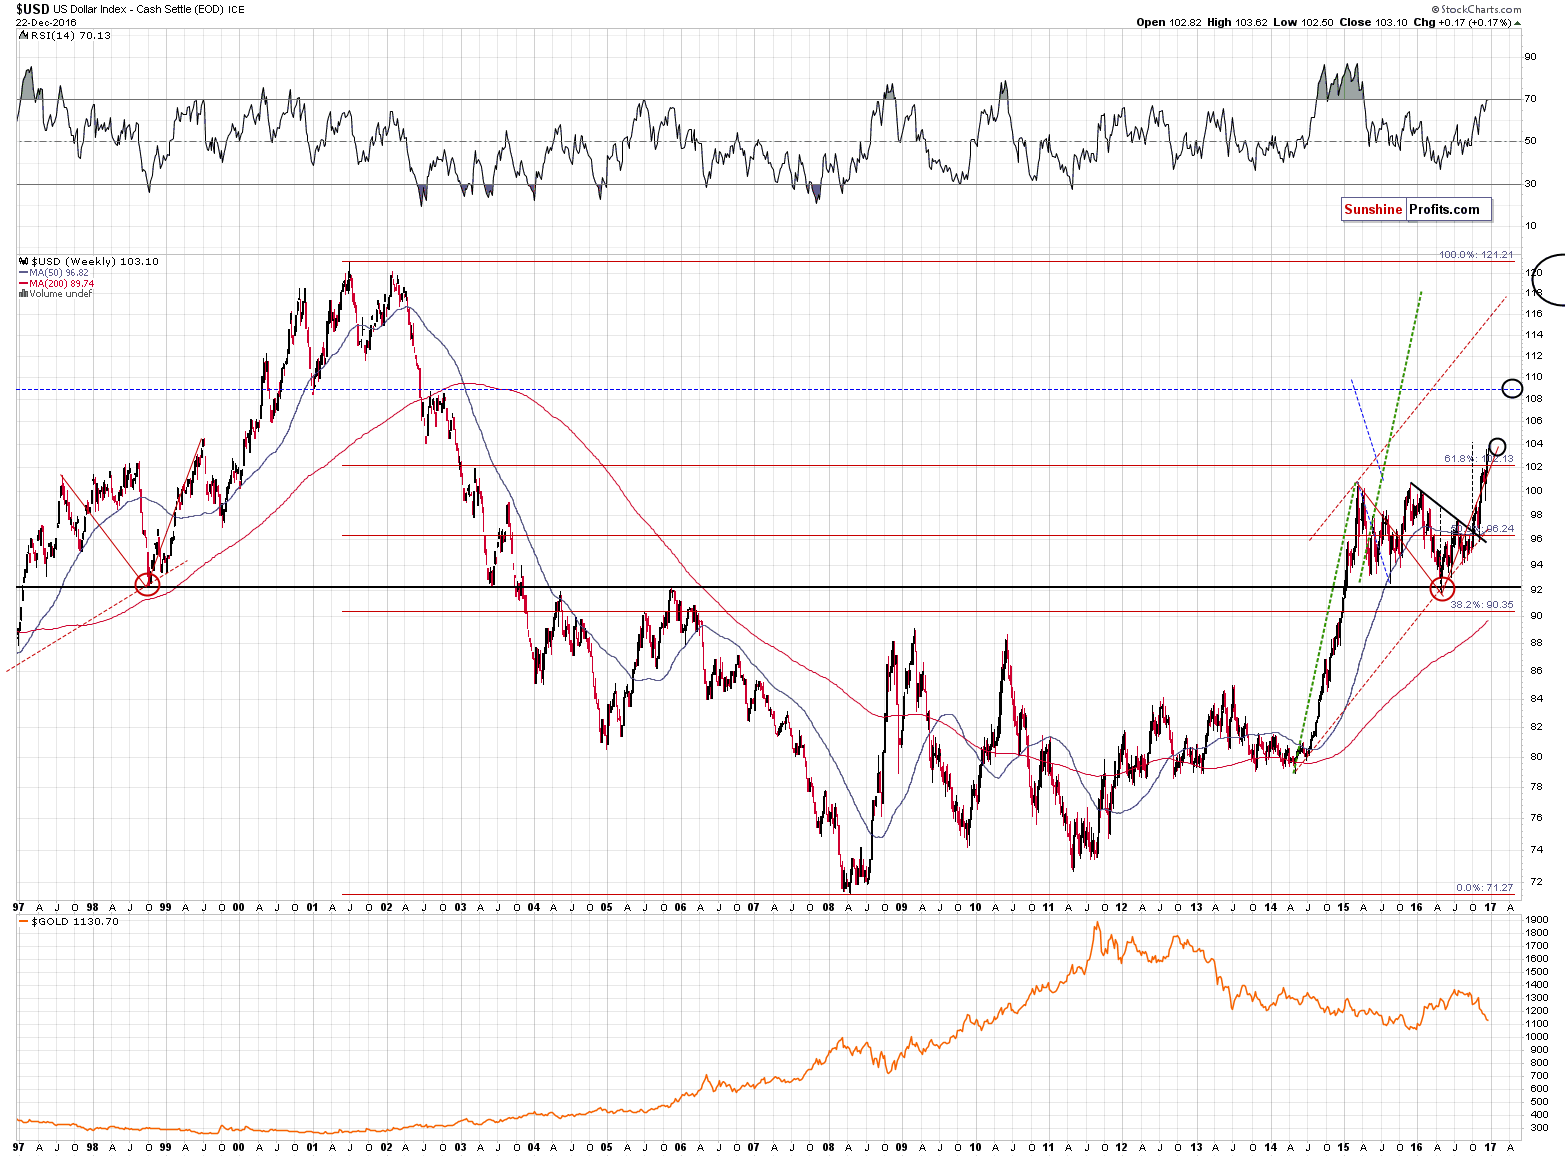
Not much is happening on the currency markets before the Holiday season, but the long-term picture of the USD Index can tell a lot about the upcoming months. Let’s take a closer look and discuss the implications (chart courtesy of http://stockcharts.com):

In general, the situation hasn’t changed much since we discussed it in one of the previous Gold & Silver Trading Alerts:
We previously wrote that the USD Index was likely to rally to the 104 level due to the similarity (the RSI indicator and the shape of the price movement were alike and the situations were almost identical in terms of time) to the 1999 rally and the way it ended. Since the USD Index moved above 103.5 this week, the target was almost reached – and gold is not close to reaching its downside target below $1,000. Since both markets move in tandem, it’s highly unlikely that the USD Index will top but gold doesn’t bottom at the same time. Consequently, it’s likely that either gold will bottom higher than expected, or the USD Index will move above 104 before the next visible (from the long-term perspective) decline takes place.
What’s more likely? In our opinion, the USD’s rally to higher levels is more likely. Is it possible for the USD Index to rally above 104 and still do something similar as in 1999?
Yes. Back in 1999, the USD Index most likely didn’t just top a bit above 104 per se. It most likely stopped the rally there (below 105) because 105 was the closest, very strong resistance (the 1989 top). So – it could be the case (and it’s actually quite likely) that back in 1999, the USD Index didn’t just rally above the 1998 high to 104 – it rallied almost to the next strong resistance level. So, we can expect the USD Index to rally to its next strong resistance level, not necessarily to 104.
The next strong resistance level is provided by the 108 – 110 area. The reasons are the 2002 tops and the 2000/2001 bottom. Moreover, it is also the target based on the size of the previous consolidation (blue, dashed lines show how much the USD should rally for the post-breakout move to be as big as the size of the consolidation).
Is there anything else that would support even higher USD values and a quite volatile rally from here? Yes, the symmetry between the 2001 – 2009 decline and the 2009 – now rally. The move from about 109 to 102 in late 2002 was not stopped by any meaningful correction, so we could see the same during the rally to 109 that is already underway.
The repeat of the Q4 2016 rally in the USD Index would (very approximately) take the USD to the 108 – 110 target area (…). At this time, the above seems to be the most likely outlook for the following months.
The above is up-to-date and the implication is that the see-saw performance that we saw in the currency markets in the past 20 months or so is likely over and we can expect more decisive and bigger trends to follow. This means that we may (depending on confirmations that we get) focus on bigger price moves than we did in the previous months and we may be more inclined to wait out corrections instead of exiting before them trying to re-enter later on. Given a strong trend, the above approach is likely to provide bigger profits.
Thank you.
Nadia Simmons
Forex & Oil Trading Strategist
Przemyslaw Radomski, CFA
Founder, Editor-in-chief, Gold & Silver Fund Manager
Gold & Silver Trading Alerts
Forex Trading Alerts
Oil Investment Updates
Oil Trading Alerts


