Since the middle of the moth GBP/USD wavers around the level of 1.4000. When can we finally see a bigger move?
In our opinion the following forex trading positions are justified - summary:
- EUR/USD: short (a stop-loss order at 1.2806; the initial downside target at 1.2186)
- GBP/USD: short (a stop-loss order at 1.4548; the next downside target at 1.3685)
- USD/JPY: none
- USD/CAD: none
- USD/CHF: none
- AUD/USD: short (a stop-loss order at 0.8222; the initial downside target at 0.7743)
EUR/USD
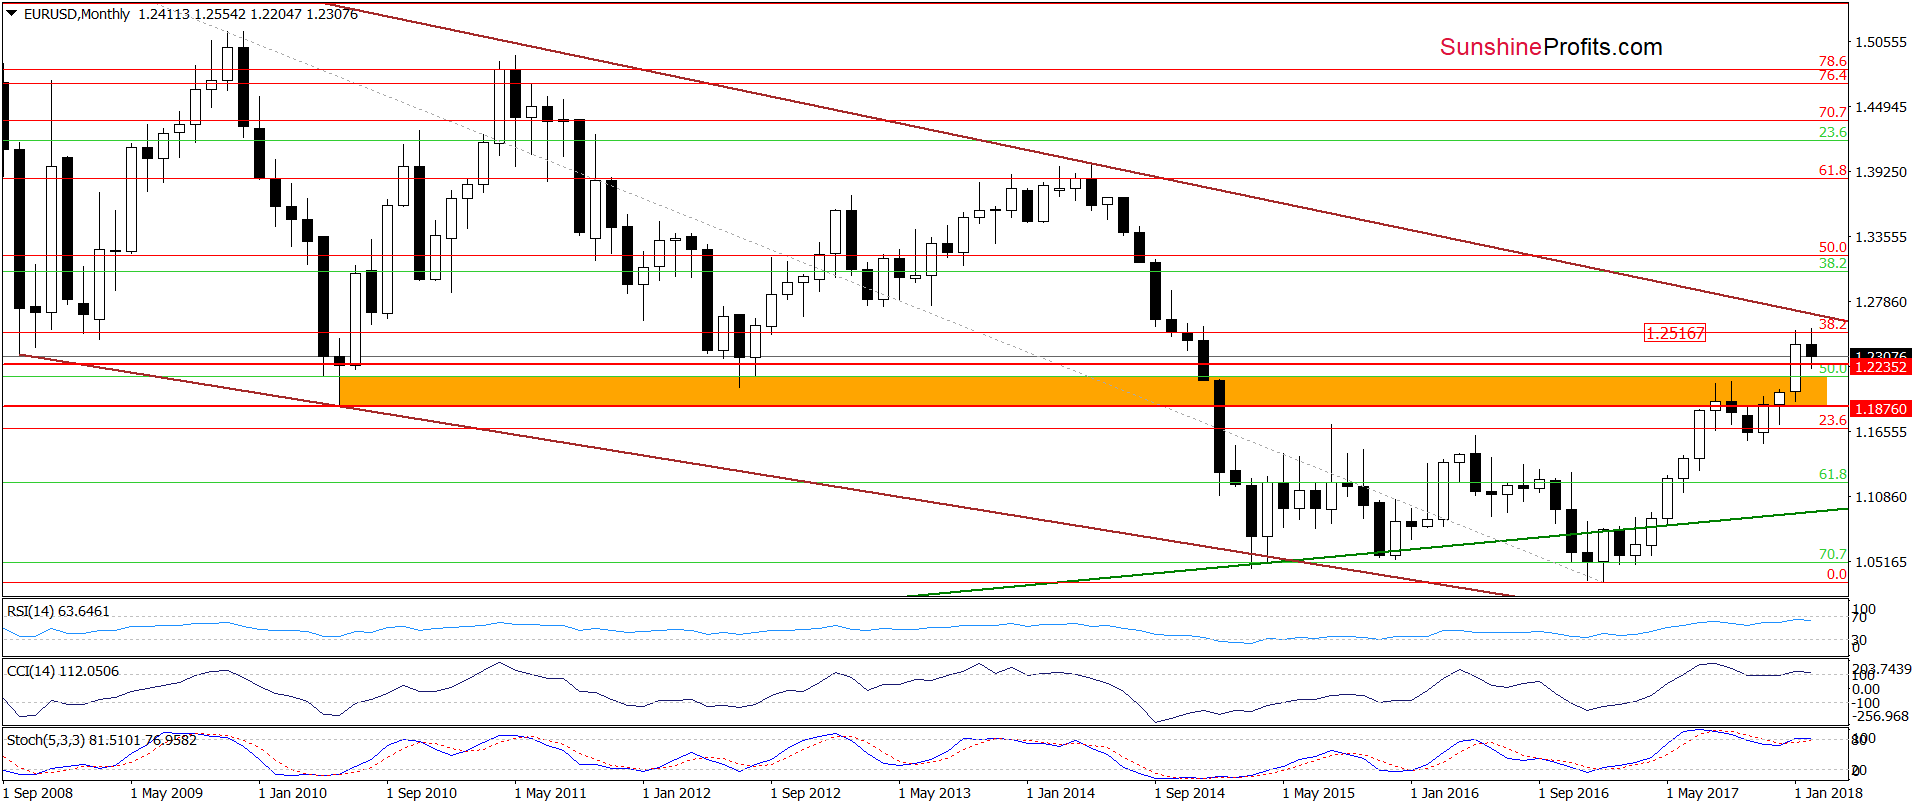
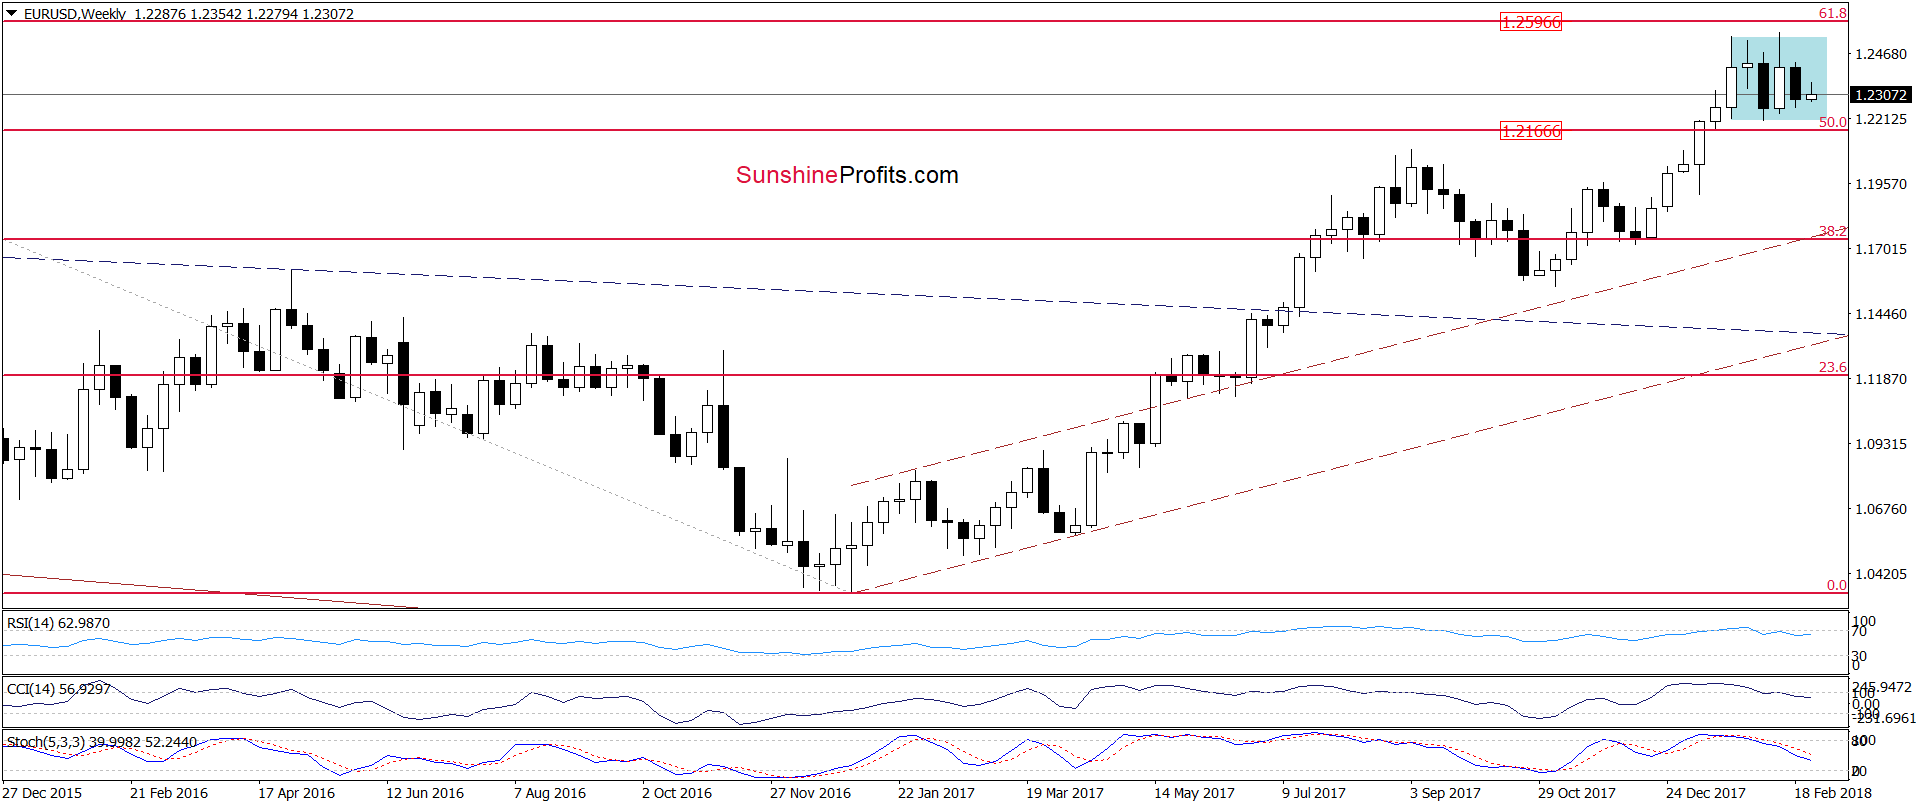
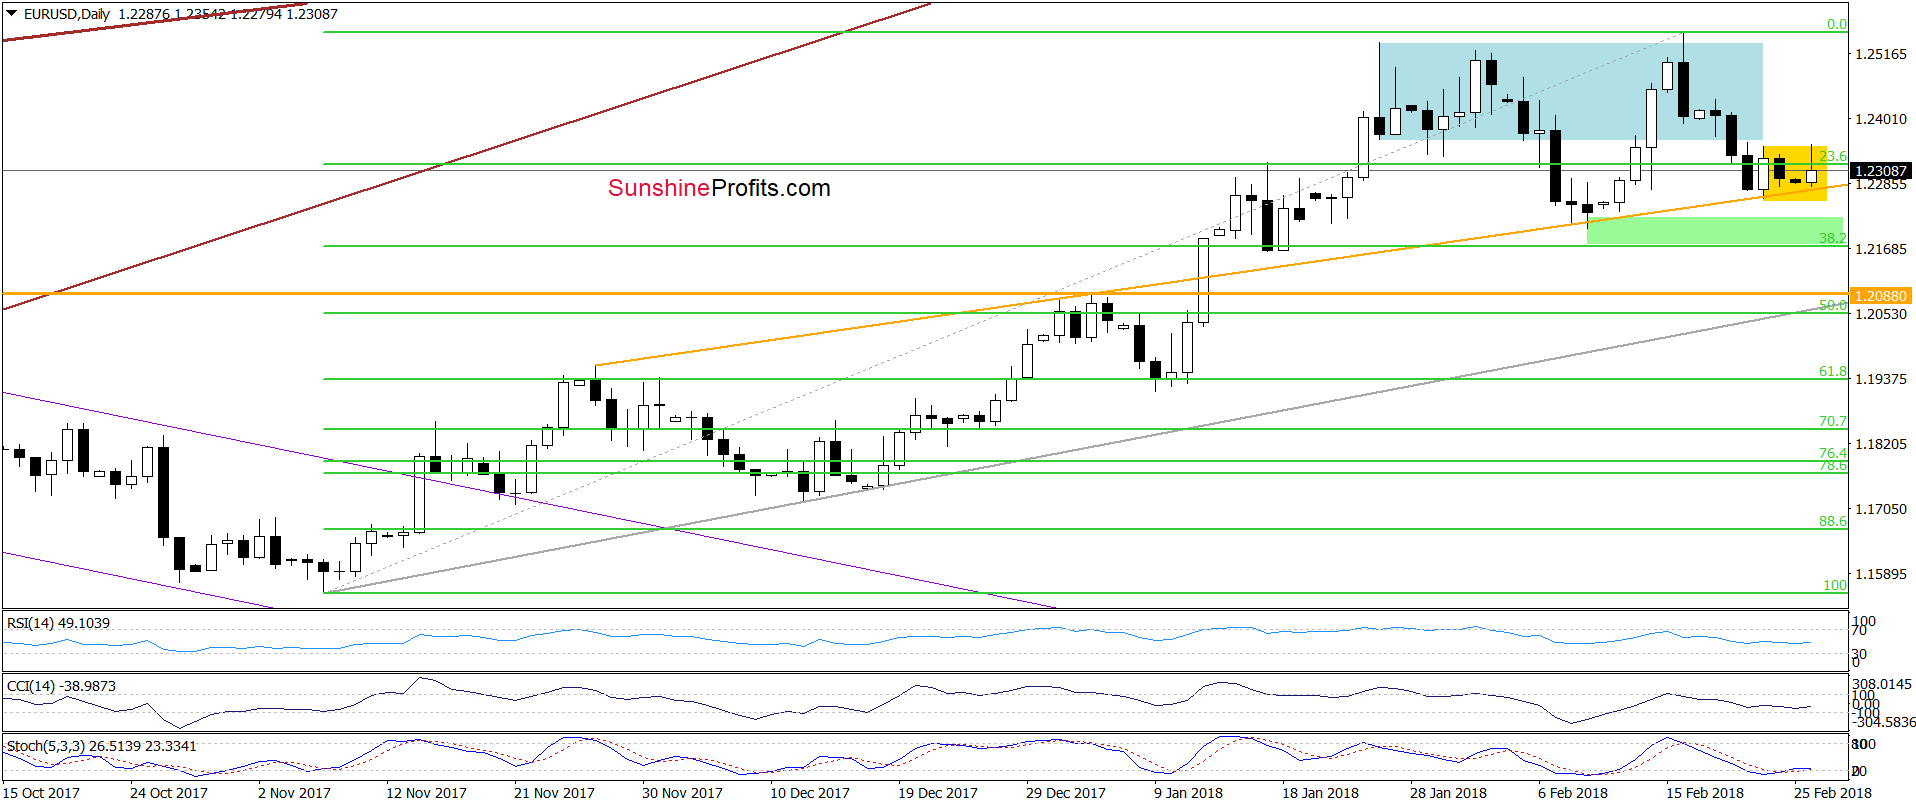
From today’s point of view, we see although EUR/USD bounced off the orange support line earlier today once again, currency bulls didn’t manage to push the pair above the upper border of the yellow consolidation. This show of weakness encouraged their opponents to act and resulted in a pullback, which suggests that we’ll see a re-test of the orange line in the coming day(s).
If it is broken, the way to the 38.2% Fibonacci retracement will be open. Finishing today’s commentary on this currency pair it is worth noting that the daily indicators are oversold, which increases the probability of a rebound later this week. Nevertheless, before we see such price action, one more downswing seems to be more likely scenario – especially when we take into account the fact that EUR/USD remains in the blue consolidation under the previously-broken 38.2% Fibonacci retracement. This means that an invalidation of the earlier breakouts (above the retracement and the upper line of the blue consolidation) and its negative impact on the value of EUR/USD are still in effect, supporting currency bears.
Trading position (short-term; our opinion): Short positions (with a stop-loss order at 1.2806 and the initial downside target at 1.2186) are justified from the risk/reward perspective. We will keep you informed should anything change, or should we see a confirmation/invalidation of the above.
GBP/USD
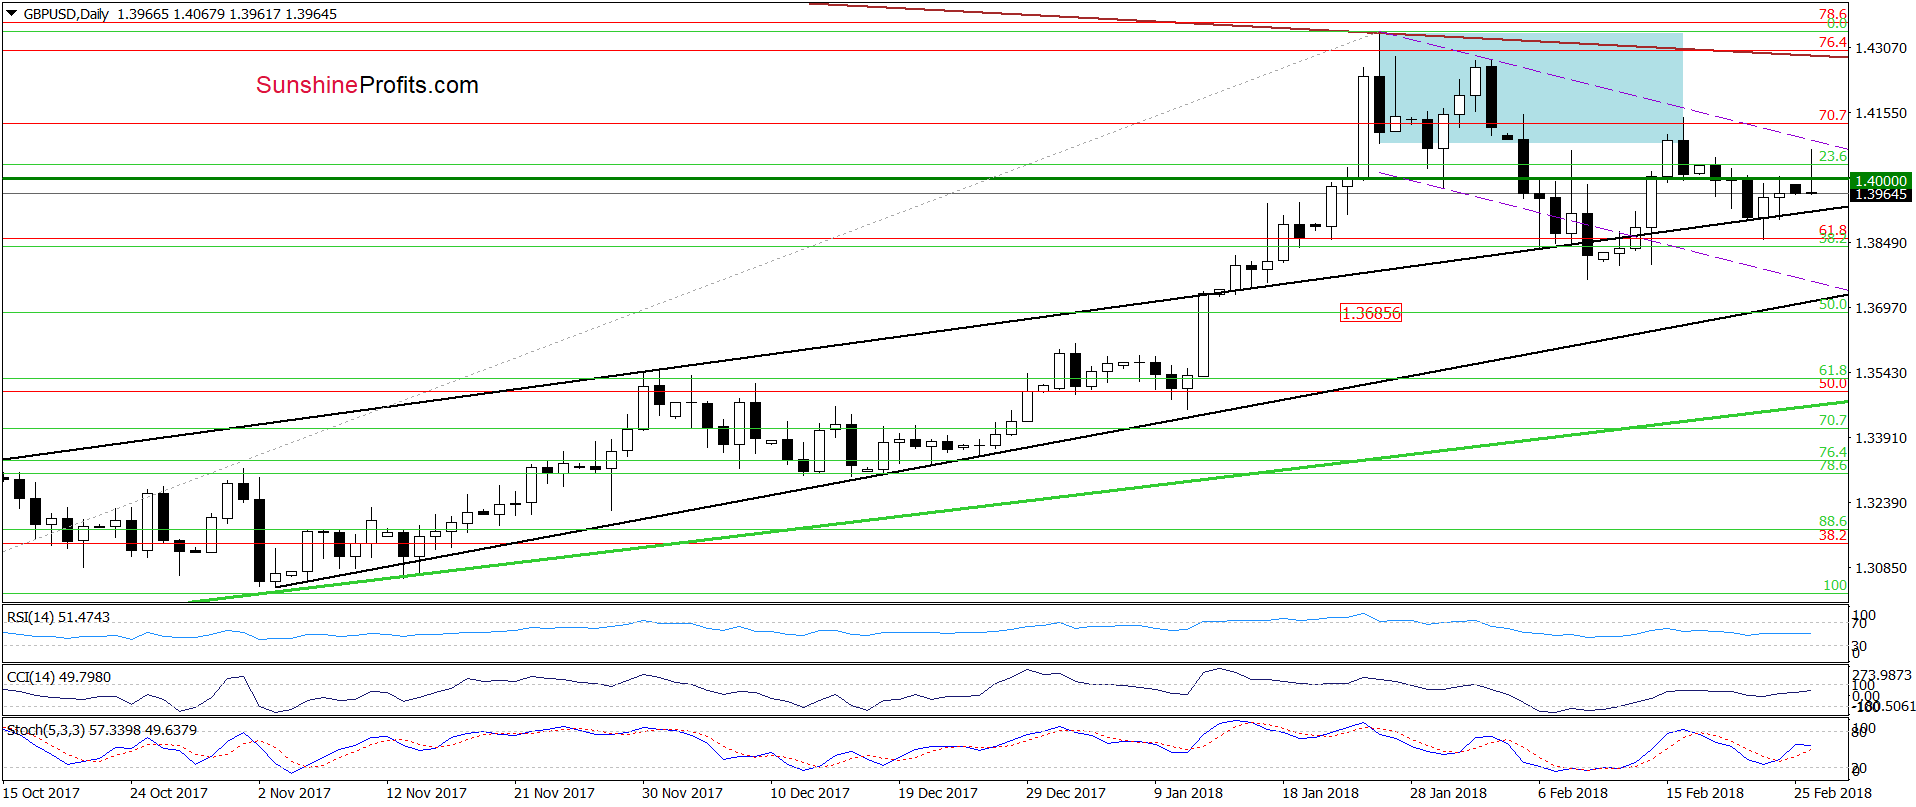
Looking at the daily chart, we see that currency bulls pushed GBP/USD higher, which approached the exchange rate to the upper border of the short-term purple declining trend channel earlier today. Despite this improvement, they didn’t manage to break above this resistance, which triggered a decline in the following hours.
Thanks to this price action the exchange rate came back under the barrier of 1.4000, which suggests that currency bears didn’t say the last word yet and further deterioration is just around the corner – especially when we factor in the sell signals generated by the medium-term indicators (seen on the weekly chart below).
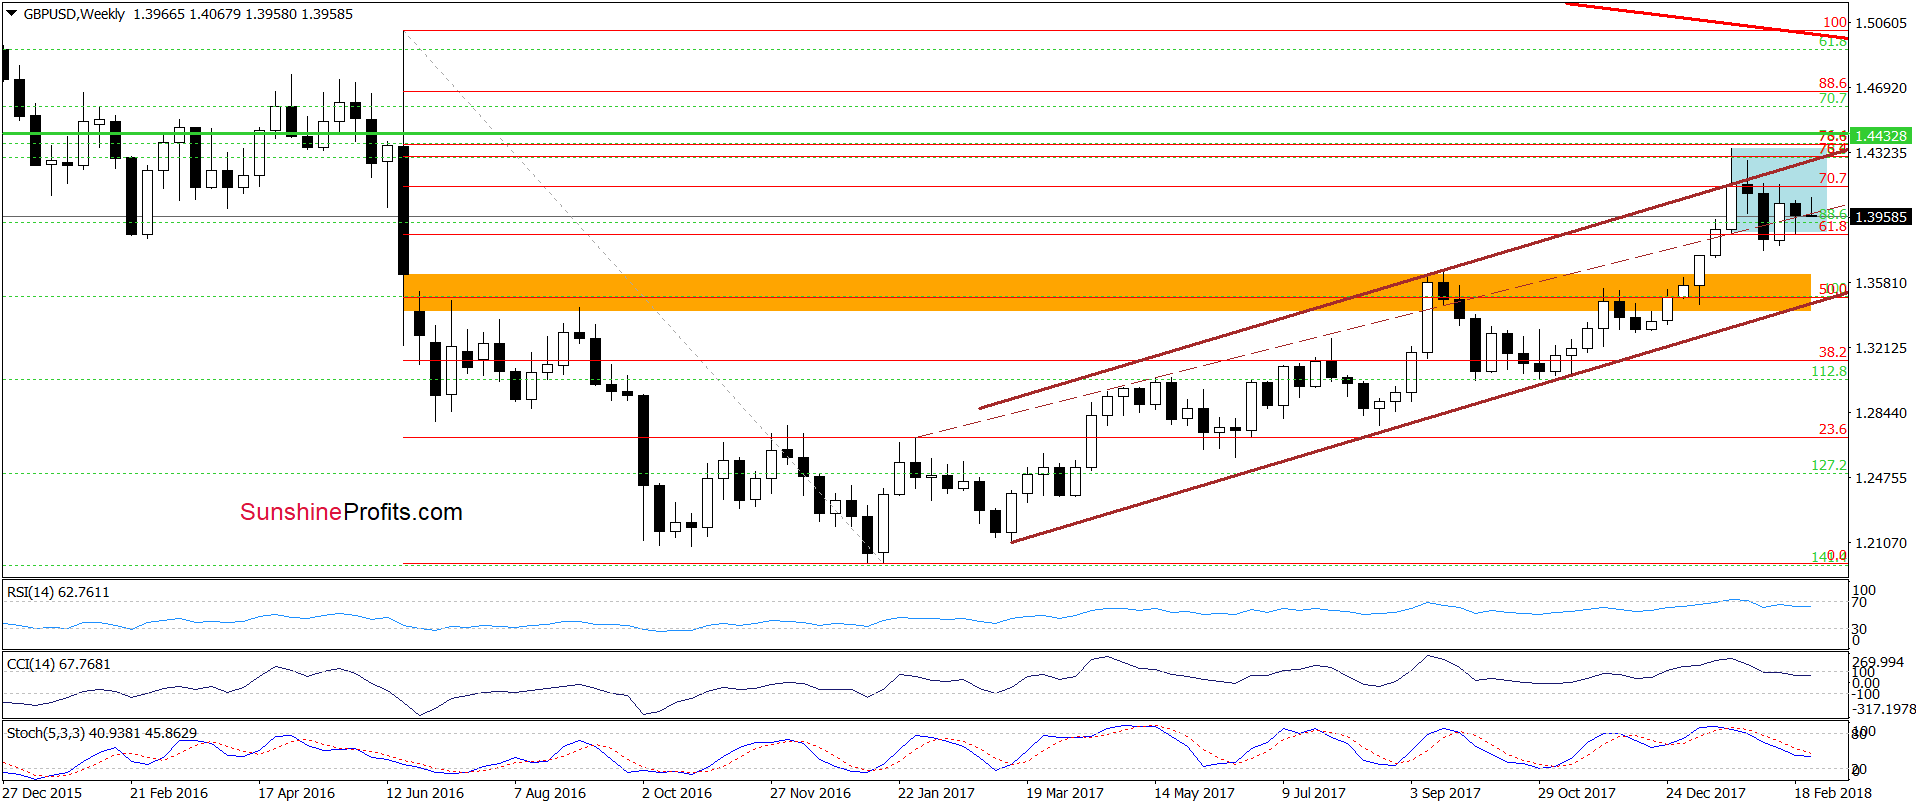
What could happen if GBP/USD declines under the black support line and the recent lows? In our opinion, we’ll likely see a test of the 50% Fibonacci retracement (marked on the daily chart), which is currently intersected by the lower line of the black rising wedge (around 1.3685).
Trading position (short-term; our opinion): Short positions (with a stop-loss order at 1.4548 and the next downside target at 1.3685) are justified from the risk/reward perspective. We will keep you informed should anything change, or should we see a confirmation/invalidation of the above.
Thank you.
Nadia Simmons
Forex & Oil Trading Strategist
Przemyslaw Radomski, CFA
Founder, Editor-in-chief, Gold & Silver Fund Manager
Gold & Silver Trading Alerts
Forex Trading Alerts
Oil Investment Updates
Oil Trading Alerts


