Earlier today, the USD Index extended losses and slipped to mid-August 2016 lows. How did this drop affect the technical picture of the euro, the British pound and the Australian dollar?
In our opinion the following forex trading positions are justified - summary:
- EUR/USD: none
- GBP/USD: short (a stop-loss order at 1.3232; the initial downside target at 1.2375)
- USD/JPY: none
- USD/CAD: none
- USD/CHF: none
- AUD/USD: none
EUR/USD
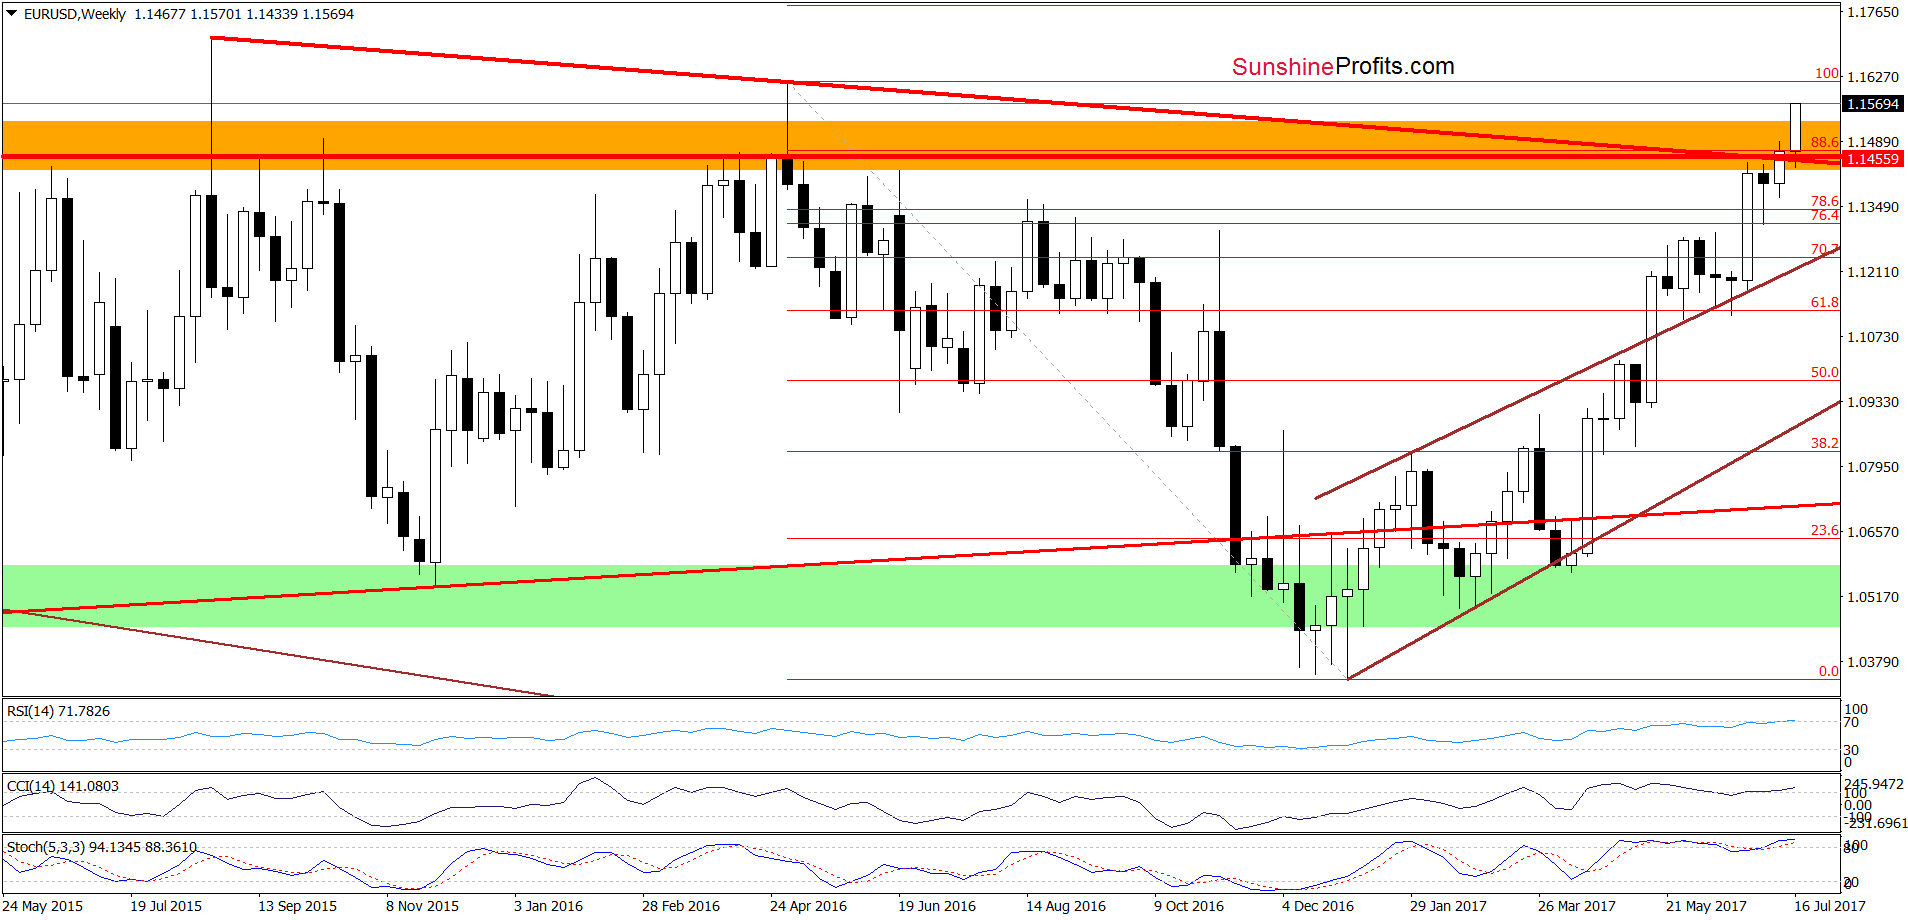
Looking at the weekly chart, we see that EUR/USD moved sharply higher earlier this week, which resulted in a breakout above two major red resistance lines. This bullish development suggests that we’ll likely see a test of the May 2016 high of 1.1615 in the very near future.
In this area is also the upper border of the brown rising trend channel, which together could stop currency bulls in the coming day(s).
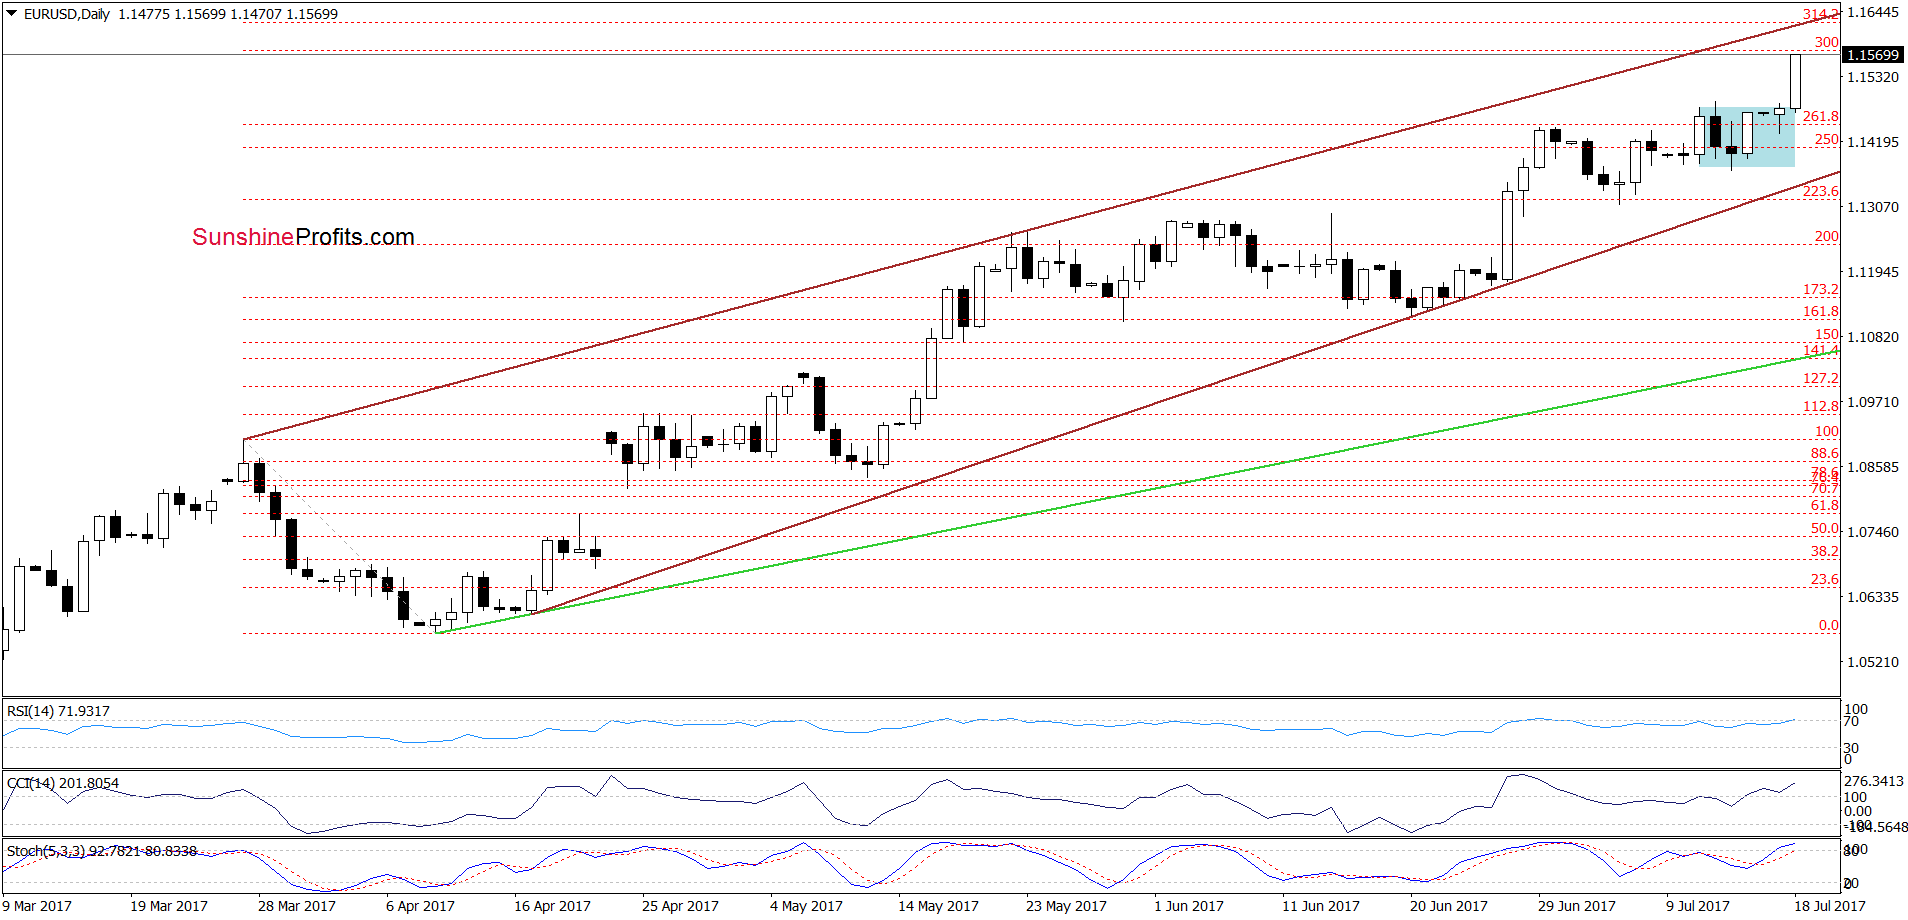
Nevertheless, if this resistance area is broken, the way to the August 2015 high of 1.1713 and the 112.8% Fibonacci extension of 1.1780 will be open.
Very short-term outlook: bullish
Short-term outlook: mixed
MT outlook: mixed
LT outlook: mixed
Trading position (short-term; our opinion): No positions are justified from the risk/reward perspective. We will keep you informed should anything change, or should we see a confirmation/invalidation of the above.
GBP/USD
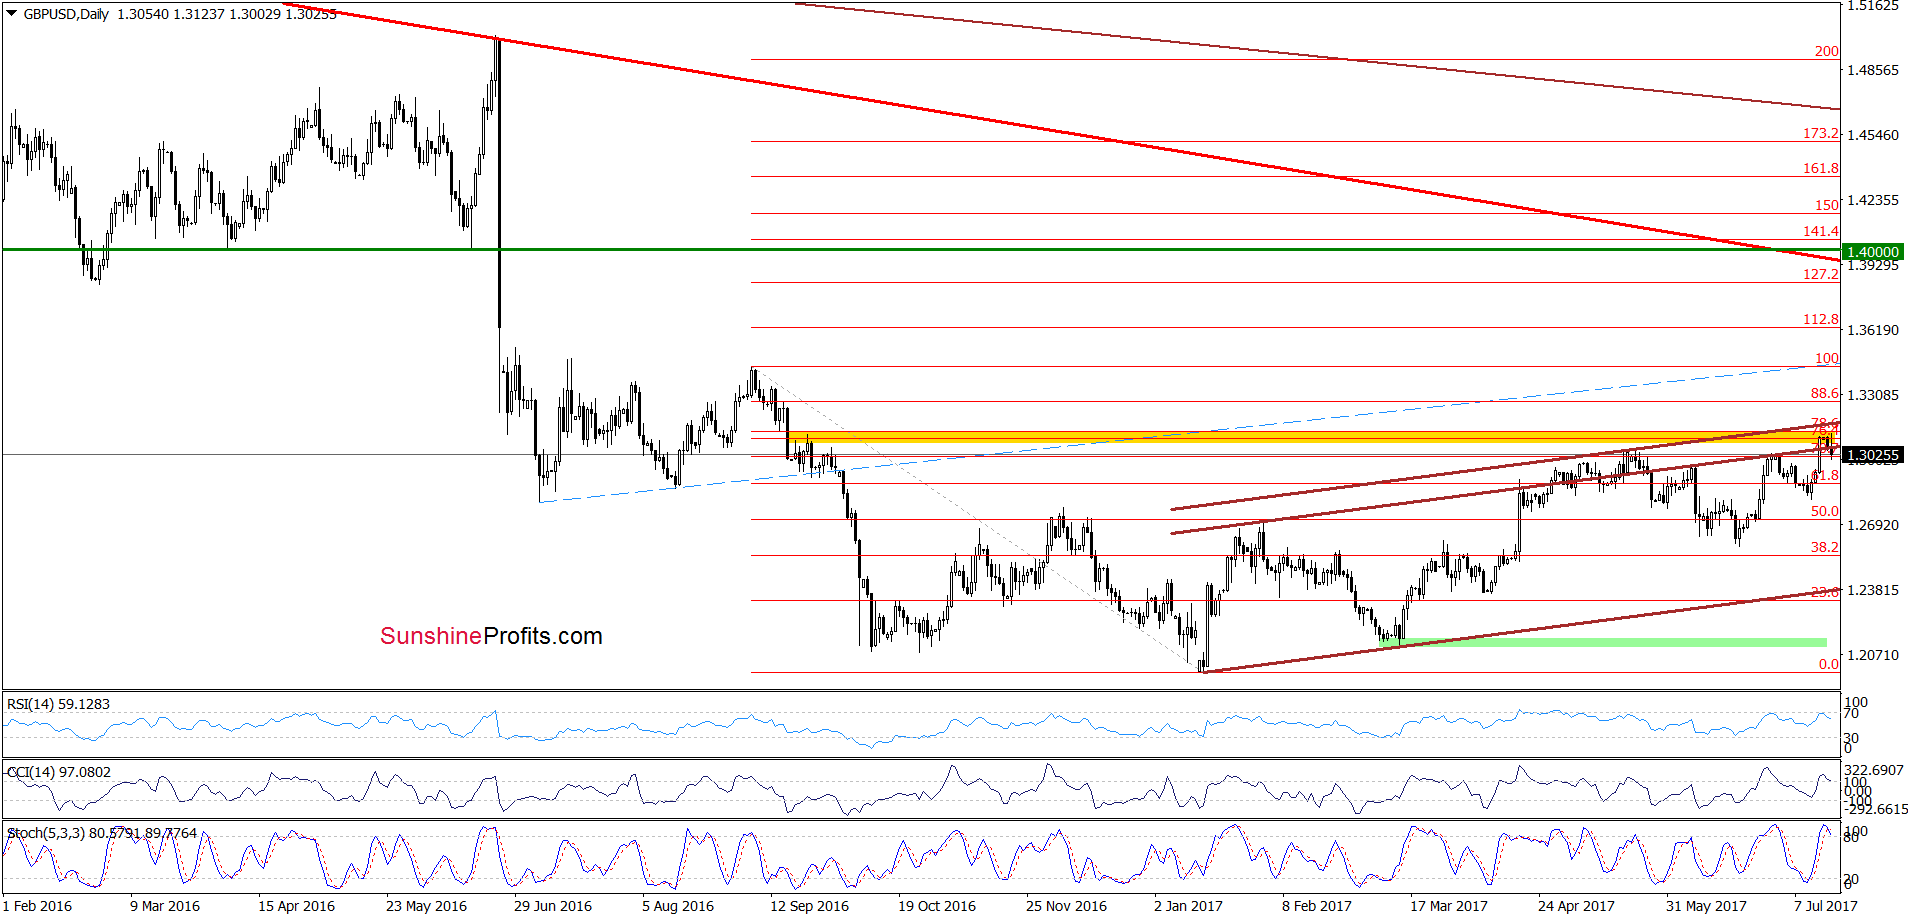
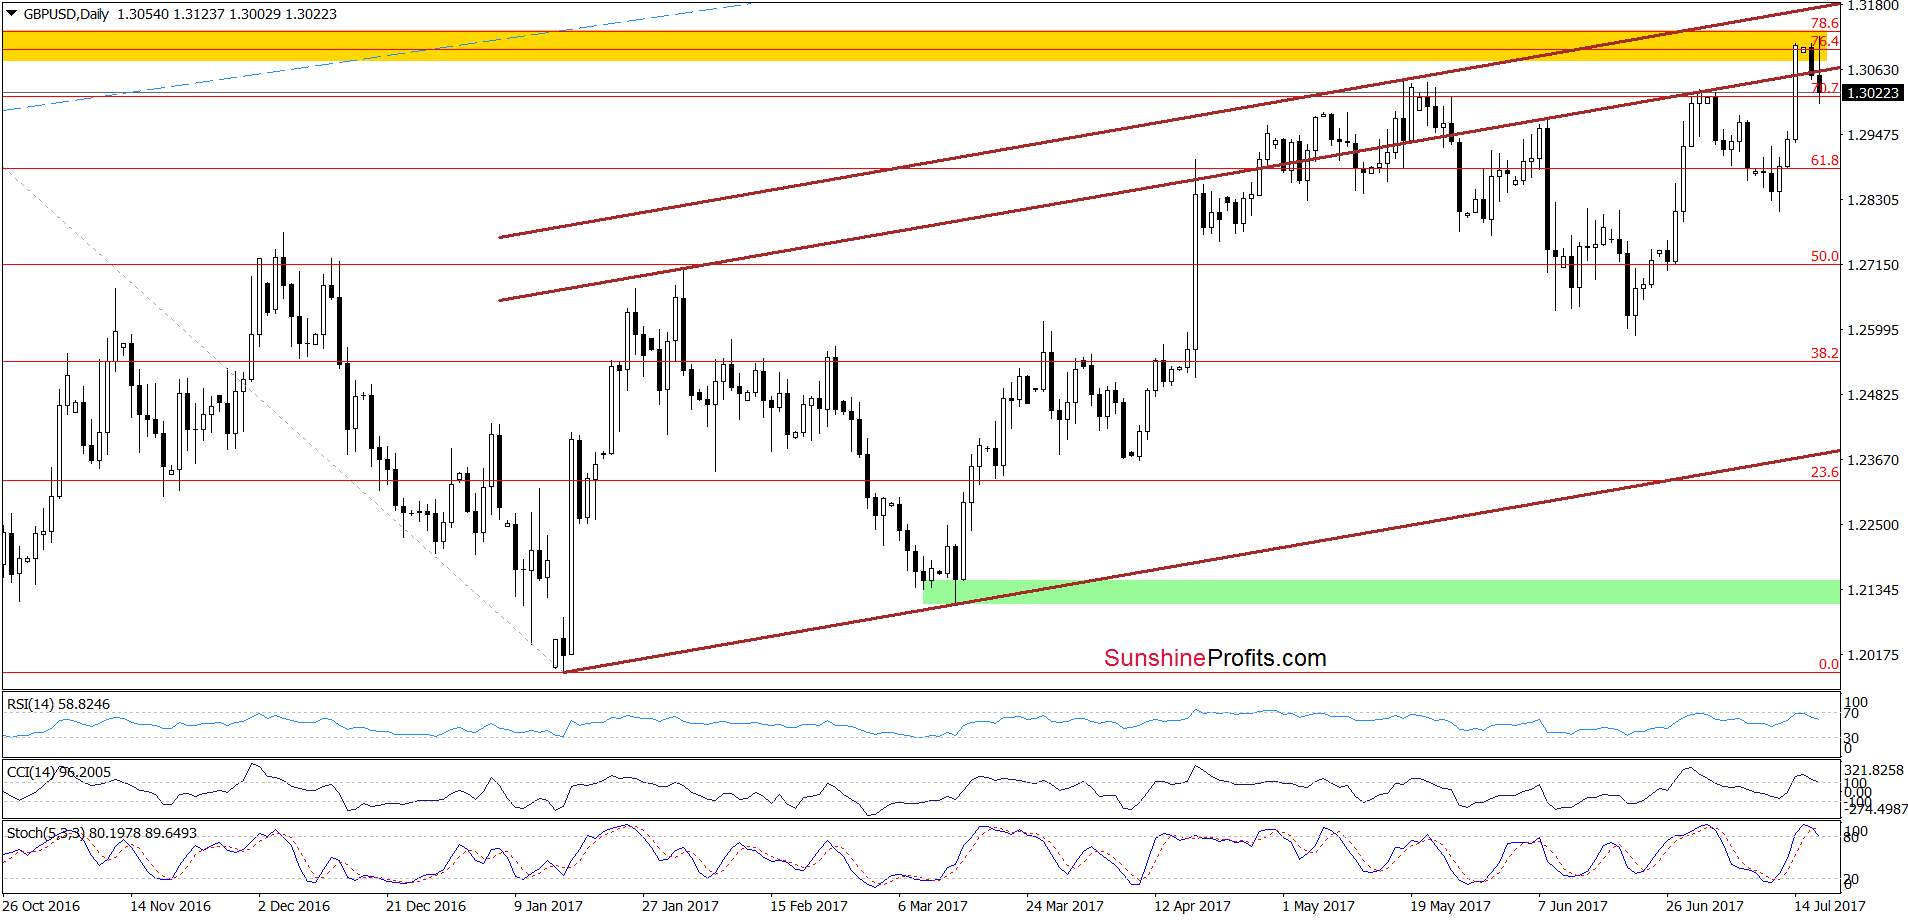
Looking at the charts, we see that although GBP/USD broke above the upper border of the brown rising trend channel and hit a fresh 2017 high, the yellow resistance zone stopped currency bulls triggering a pullback. As a result, the exchange rate slipped below the brown line, which suggests that we may see an invalidation of the breakout later in the day. In other words, if the pair closes today’s session under the upper border of the brown rising trend channel and the May highs, currency bears will receive important bearish factors to act. If this is the case, we’ll see and acceleration of declines and a test of the mid-July or even late June lows in the coming days.
Very short-term outlook: bearish
Short-term outlook: mixed with bearish bias
MT outlook: mixed with bearish bias
LT outlook: mixed
Trading position (short-term; our opinion): Short positions (with a stop-loss order at 1.3232 and the initial downside target at 1.2375) are justified from the risk/reward perspective. We will keep you informed should anything change, or should we see a confirmation/invalidation of the above.
AUD/USD
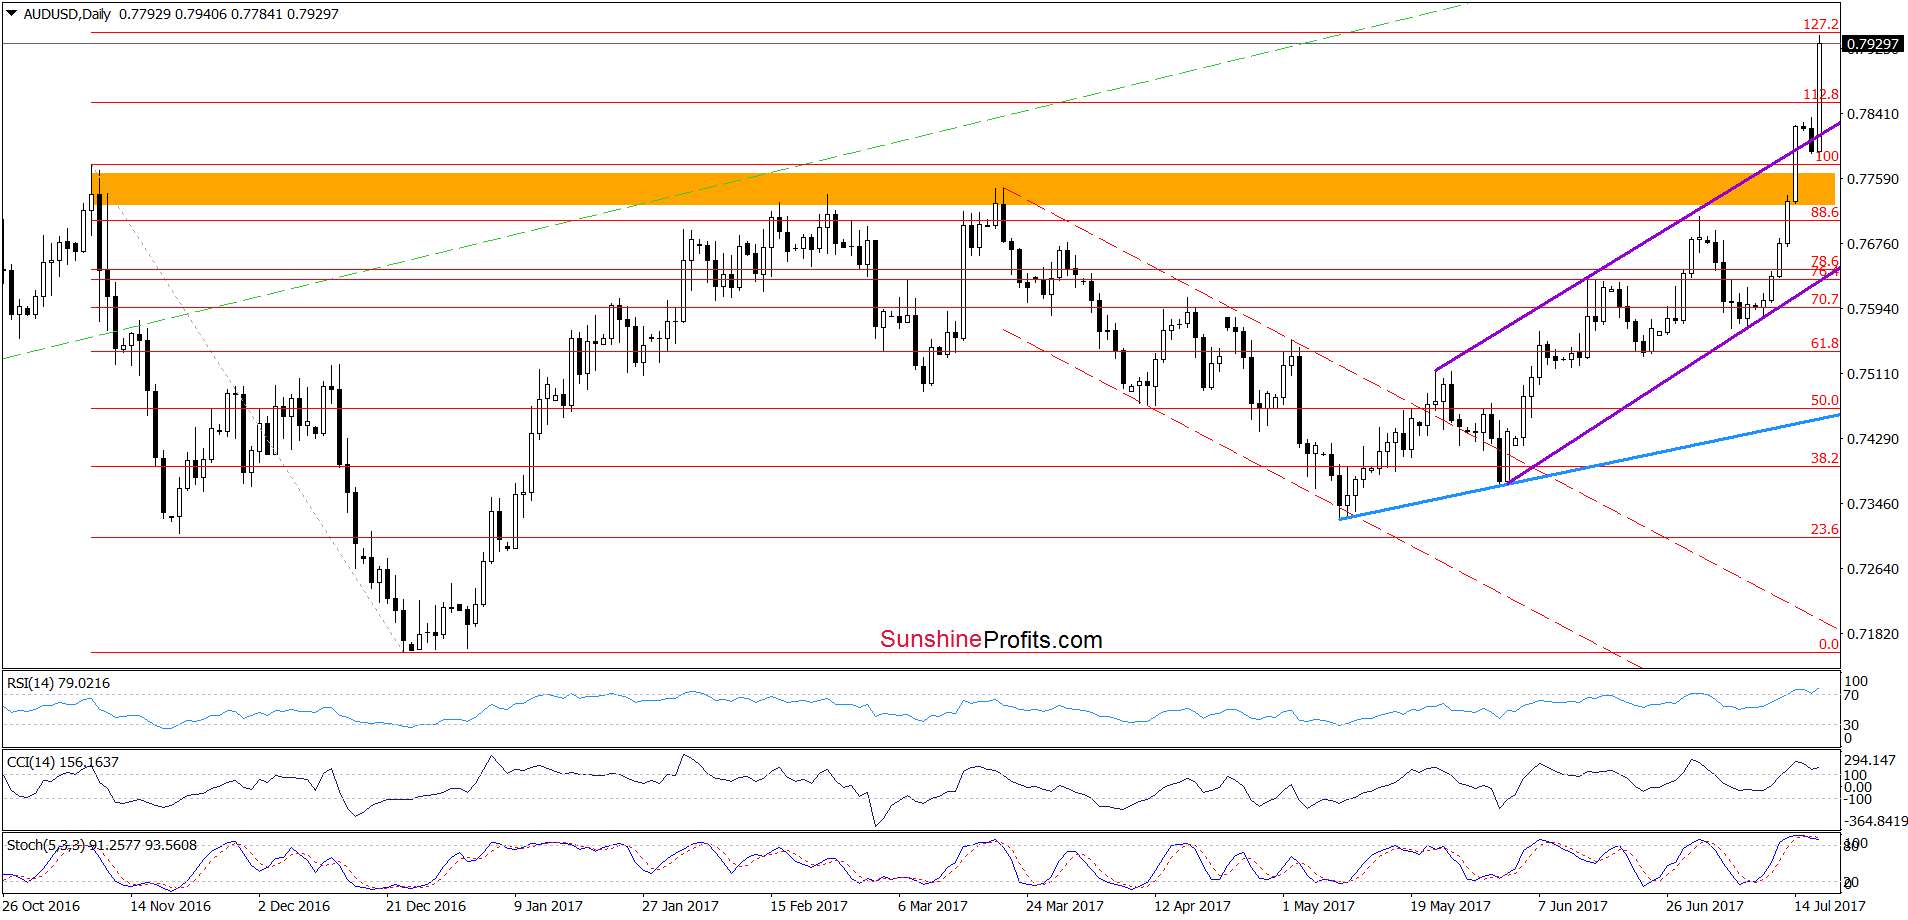
On the daily chart, we see that AUD/USD moved sharply higher and broke not only above the orange resistance zone, but also above the upper border of the purple rising trend channel, which is a bullish development, which suggests a test of the 127.2% Fibonacci extension later in the day.
What could happen if this resistance is broken? Let’s zoom out our picture and take a look at the weekly chart.
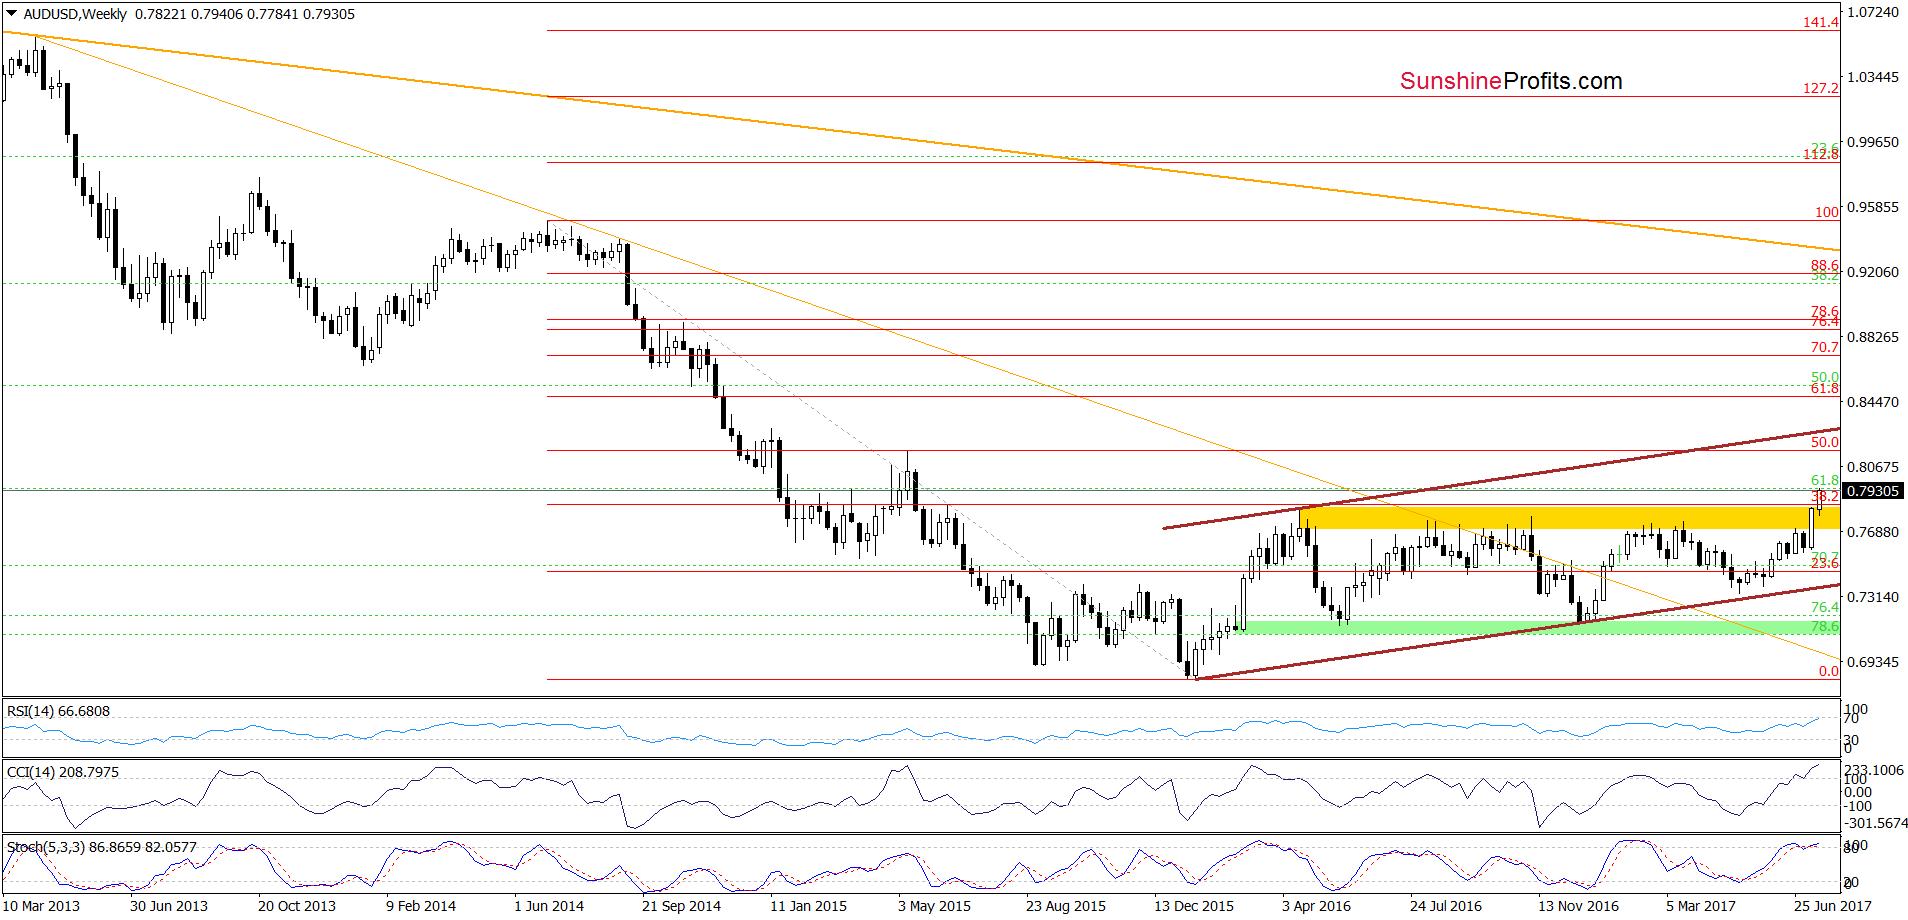
From this perspective, we see that this week’s increase took AUD/USD above the yellow resistance zone and the 38.2% Fibonacci retracement, which suggests that we may see a test of the May 2015 high of 0.8161 and the 50% Fibonacci retracement in the coming week.
Very short-term outlook: bullish
Short-term outlook: mixed
MT outlook: mixed
LT outlook: mixed
Trading position (short-term; our opinion): No positions are justified from the risk/reward perspective. We will keep you informed should anything change, or should we see a confirmation/invalidation of the above.
Thank you.
Nadia Simmons
Forex & Oil Trading Strategist
Przemyslaw Radomski, CFA
Founder, Editor-in-chief, Gold & Silver Fund Manager
Gold & Silver Trading Alerts
Forex Trading Alerts
Oil Investment Updates
Oil Trading Alerts


