Earlier today, GBP/USD moved sharply lower, approaching the last week lows as renewed UK political uncertainty affected negatively investors’ sentiment. In this environment the exchange rate dropped under important support line, but is it enough to open the way to lower levels?
In our opinion the following forex trading positions are justified - summary:
- EUR/USD: short (a stop-loss order at 1.2250; the initial downside target at 1.1510)
- GBP/USD: short (a stop-loss order at 1.3773; the next downside target at 1.3000)
- USD/JPY: none
- USD/CAD: none
- USD/CHF: none
- AUD/USD: none
EUR/USD
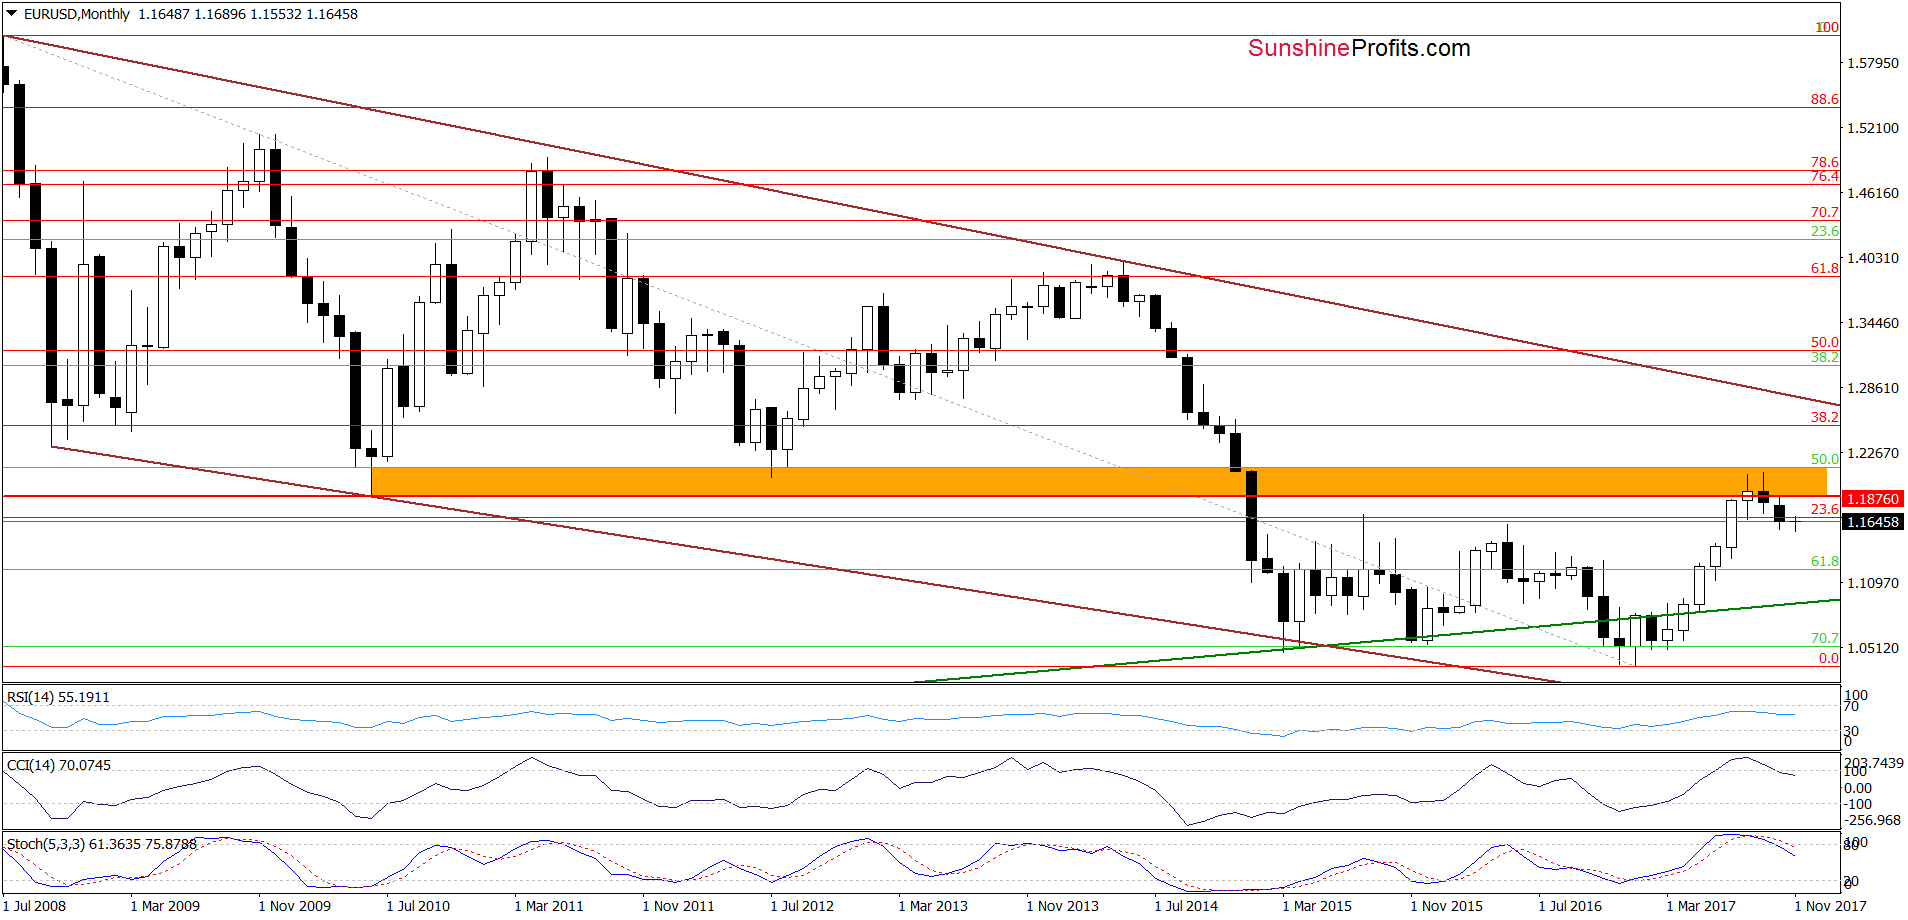
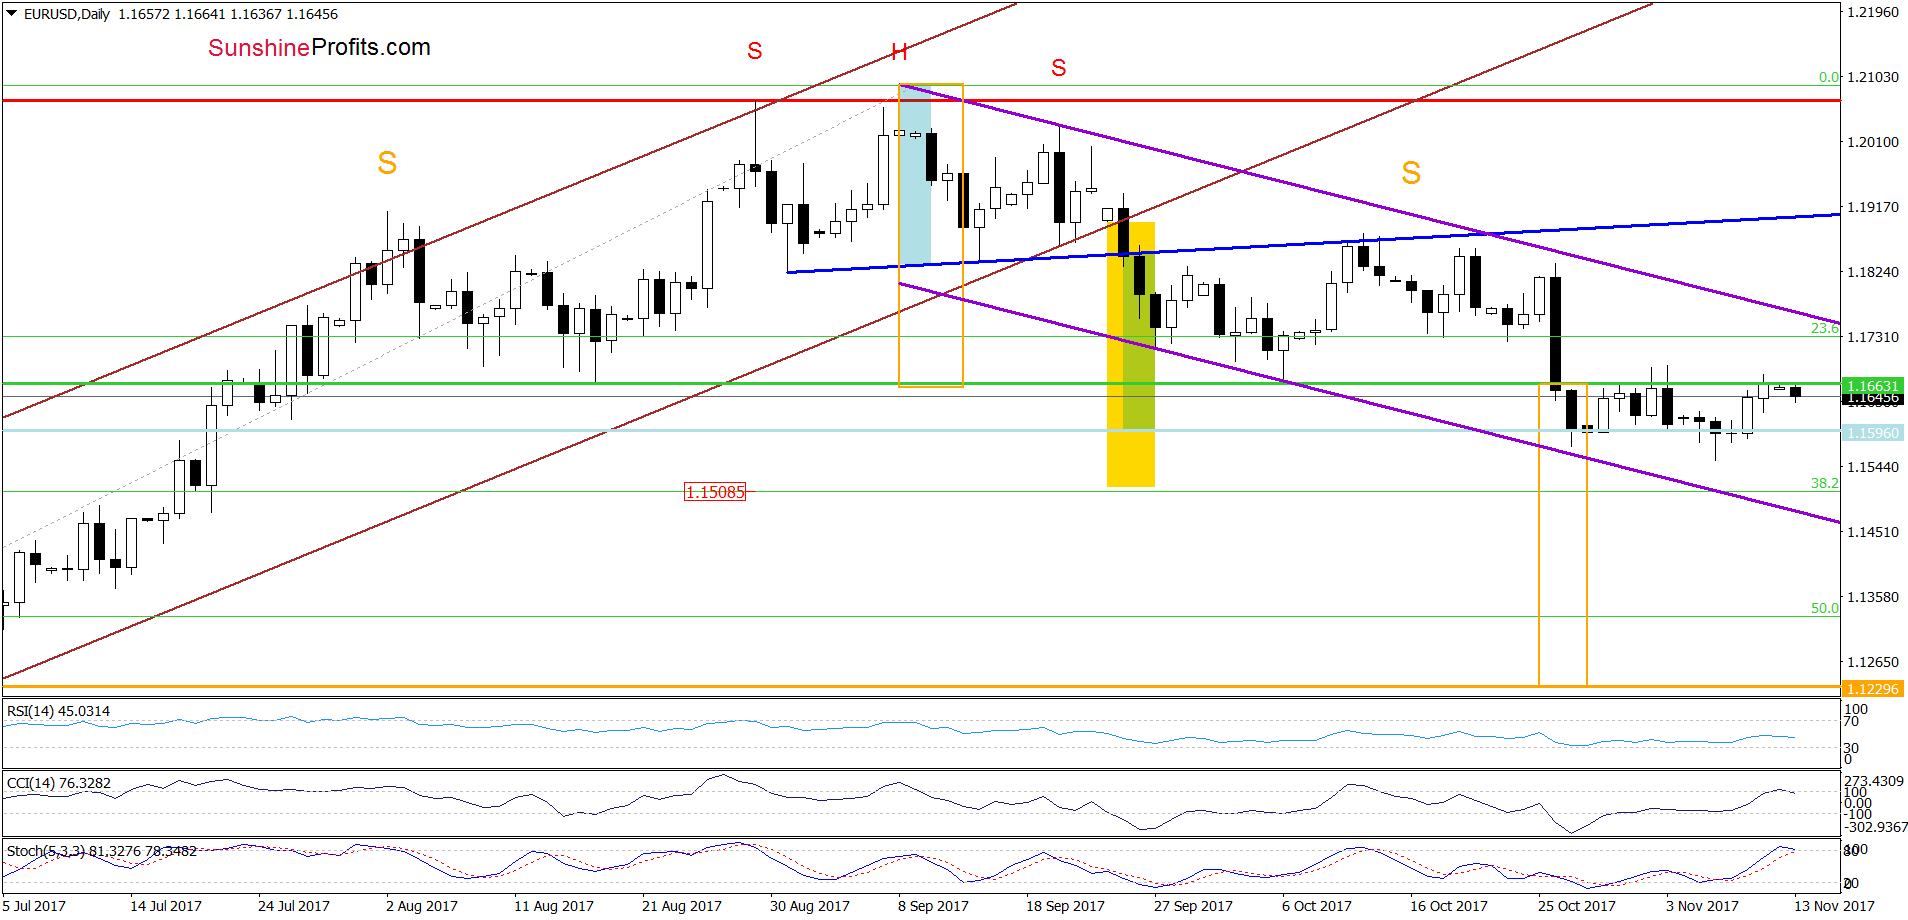
On the daily chart, we see that although EUR/USD re-tested the previously-broken green line based on the August and October lows, the resistance line withstood the buying pressure and triggered a pullback earlier today. As you see, this is a repeat of what we already saw at the beginning of the month, which increases the probability of another move to the downside in the very near future. Therefore, if the exchange rate declines from current levels, we’ll likely see a test of the 38.2% Fibonacci retracement in the coming week.
Very short-term outlook: bearish
Short-term outlook: mixed with bearish bias
MT outlook: mixed
LT outlook: mixed
Trading position (short-term; our opinion): Profitable short positions (with a stop-loss order at 1.2250 and the initial downside target at 1.1510) are justified from the risk/reward perspective. We will keep you informed should anything change, or should we see a confirmation/invalidation of the above.
GBP/USD
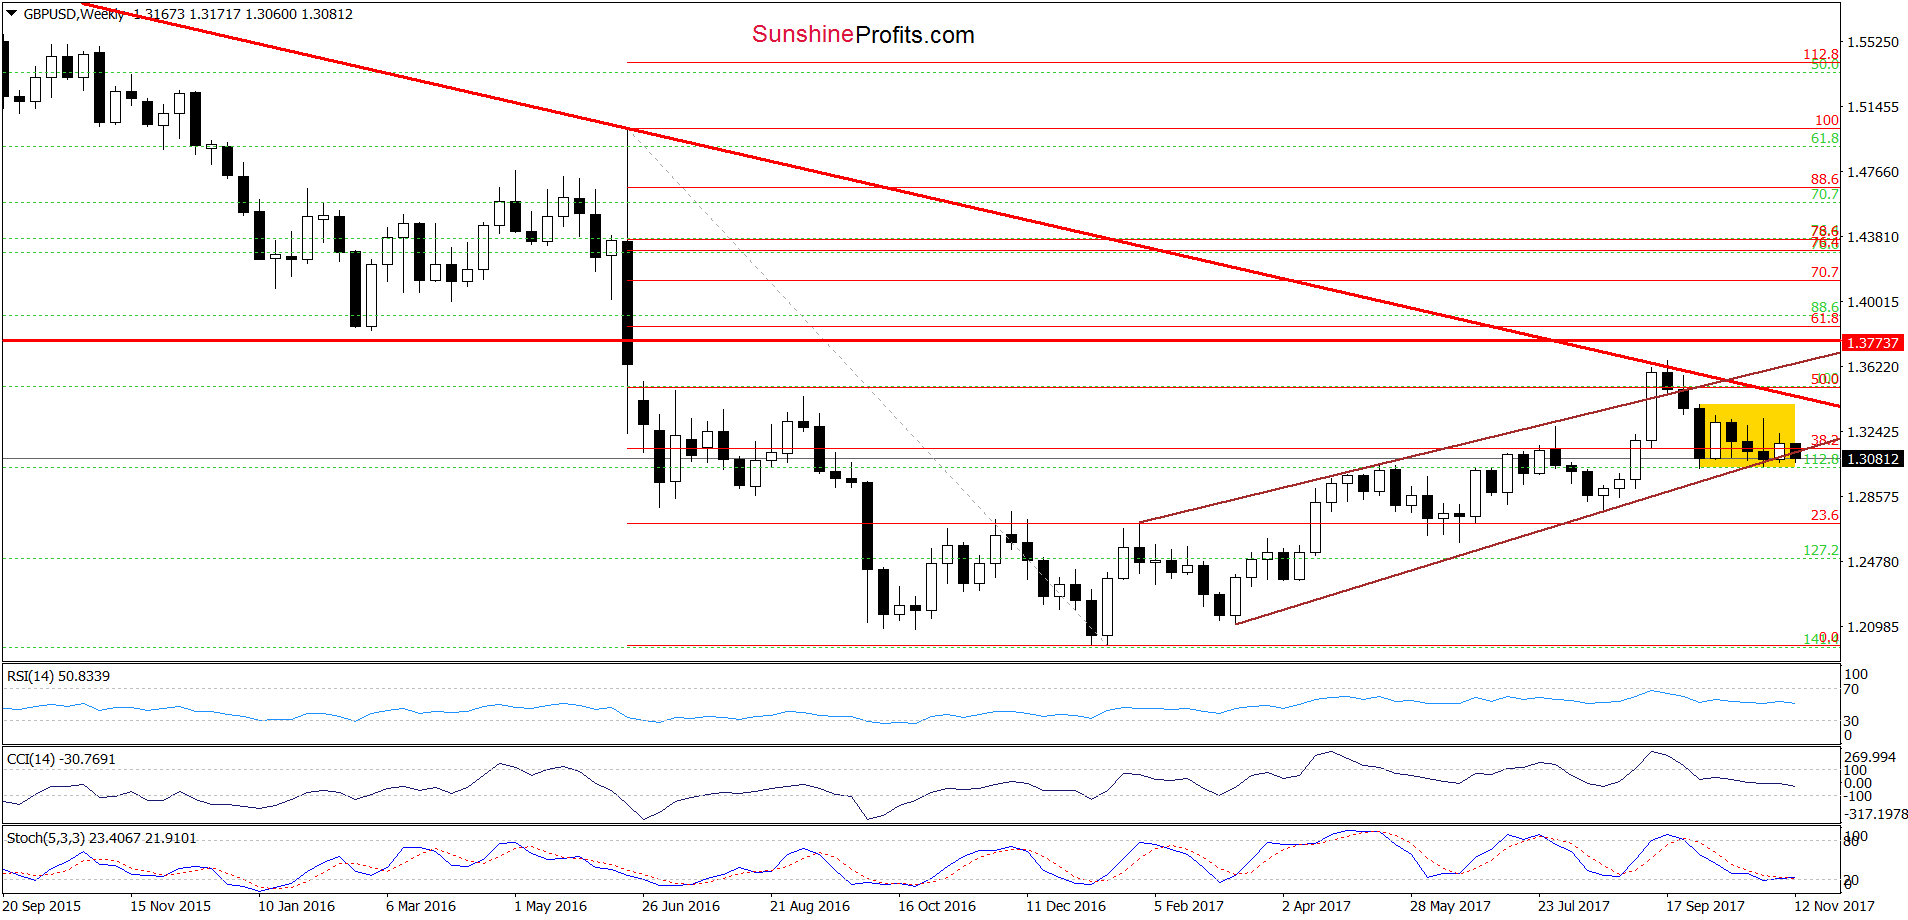
Looking at the weekly chart, we see that although GBP/USD is still trading in the yellow consolidation inside the brown rising trend channel, the exchange rate dropped under the lower border of the brown rising rend channel, which doesn’t bode well for currency bulls, suggesting further deterioration.
Will the very short-term chart confirm this pro-bearish scenario? Let’s examine the daily chart and find out.
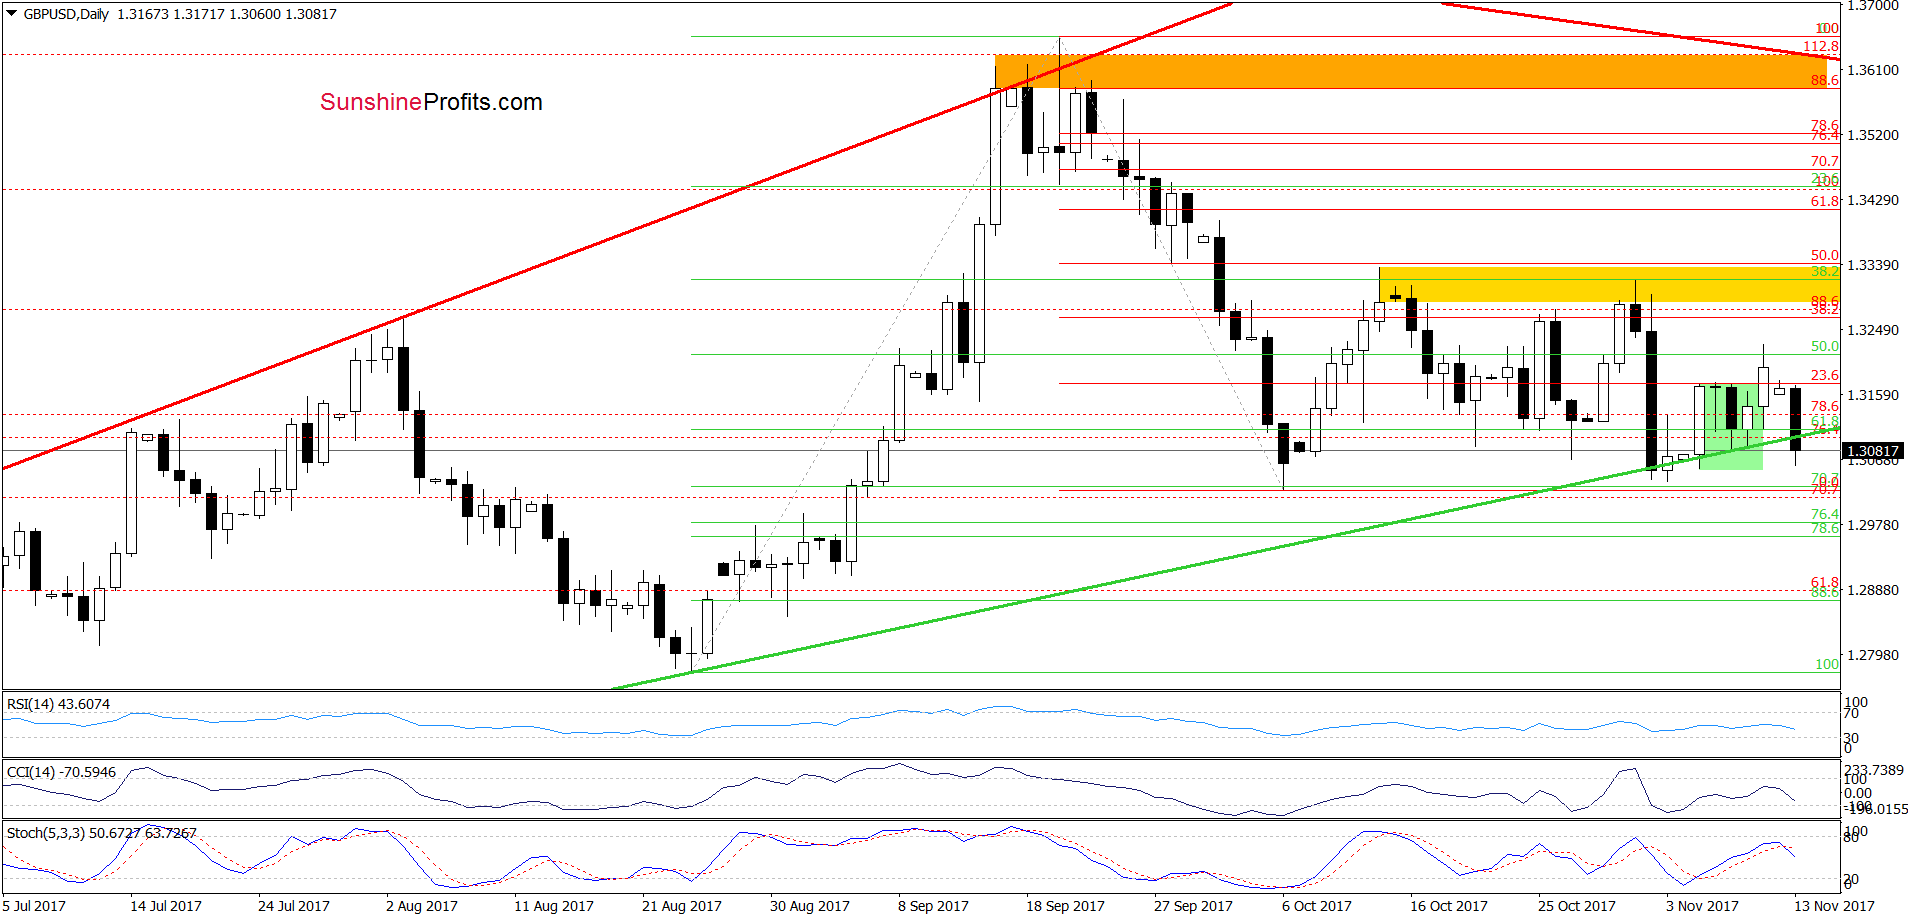
From this perspective, we see that although GBP/USD rebounded after a drop to the green support line (the lower border of the brown rising trend channel seen on the weekly chart) in the previous week, currency bulls didn’t manage to hold these levels, which resulted in a reversal and a sharp decline earlier today.
Thanks to today’s drop, the pair approached the last week lows, which together with the sell signal generated by the Stochastic Oscillator suggests (at least) a re-test of the October lows in the coming week.
Finishing today’s commentary on this currency pair, we would like to draw your attention to the long-term picture of GBP/USD.
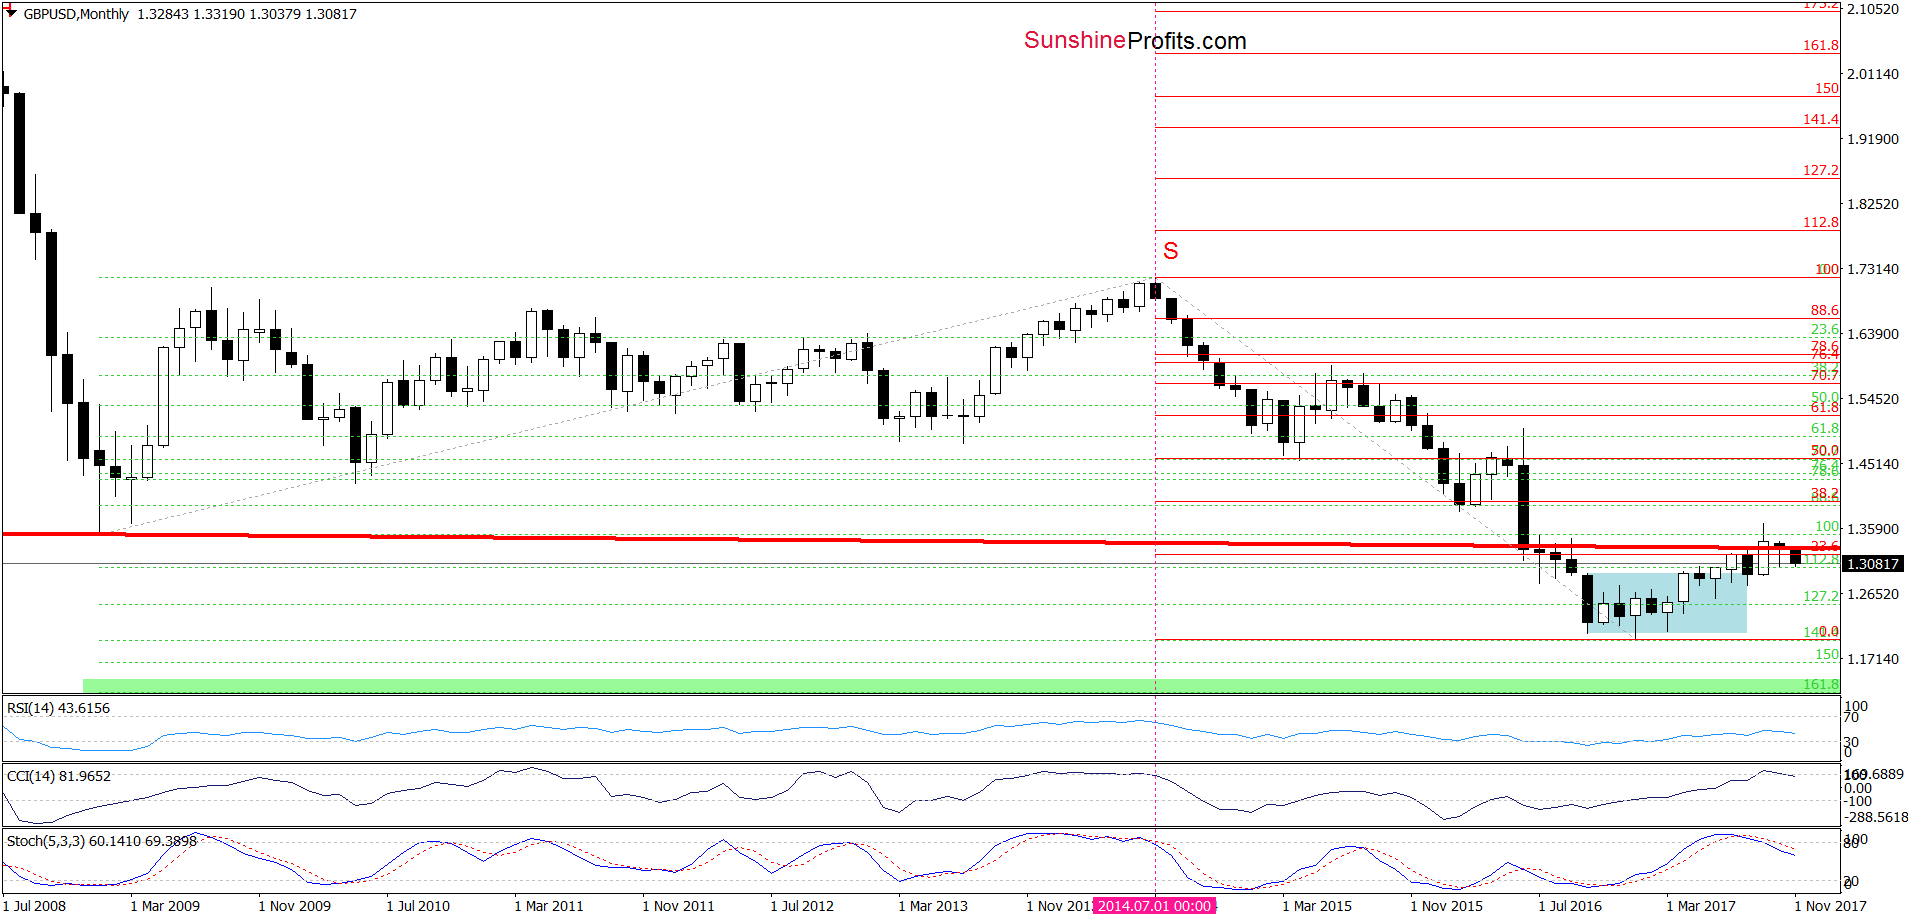
The first thing that catches the eye on the monthly chart is an invalidation of the tiny breakout above the red resistance line (the neck line of the long-term head and shoulders formation). Such price action looks like a verification of the earlier breakdown under this line, which increases the likelihood of further declines in the coming weeks – especially when we factor in the sell signals generated by the long-term indicators.
Very short-term outlook: bearish
Short-term outlook: mixed with bearish bias
MT outlook: mixed with bearish bias
LT outlook: mixed
Trading position (short-term; our opinion): Profitable short positions (with a stop-loss order at 1.3773 and the next downside target at 1.3000) are justified from the risk/reward perspective. We will keep you informed should anything change, or should we see a confirmation/invalidation of the above.
USD/JPY
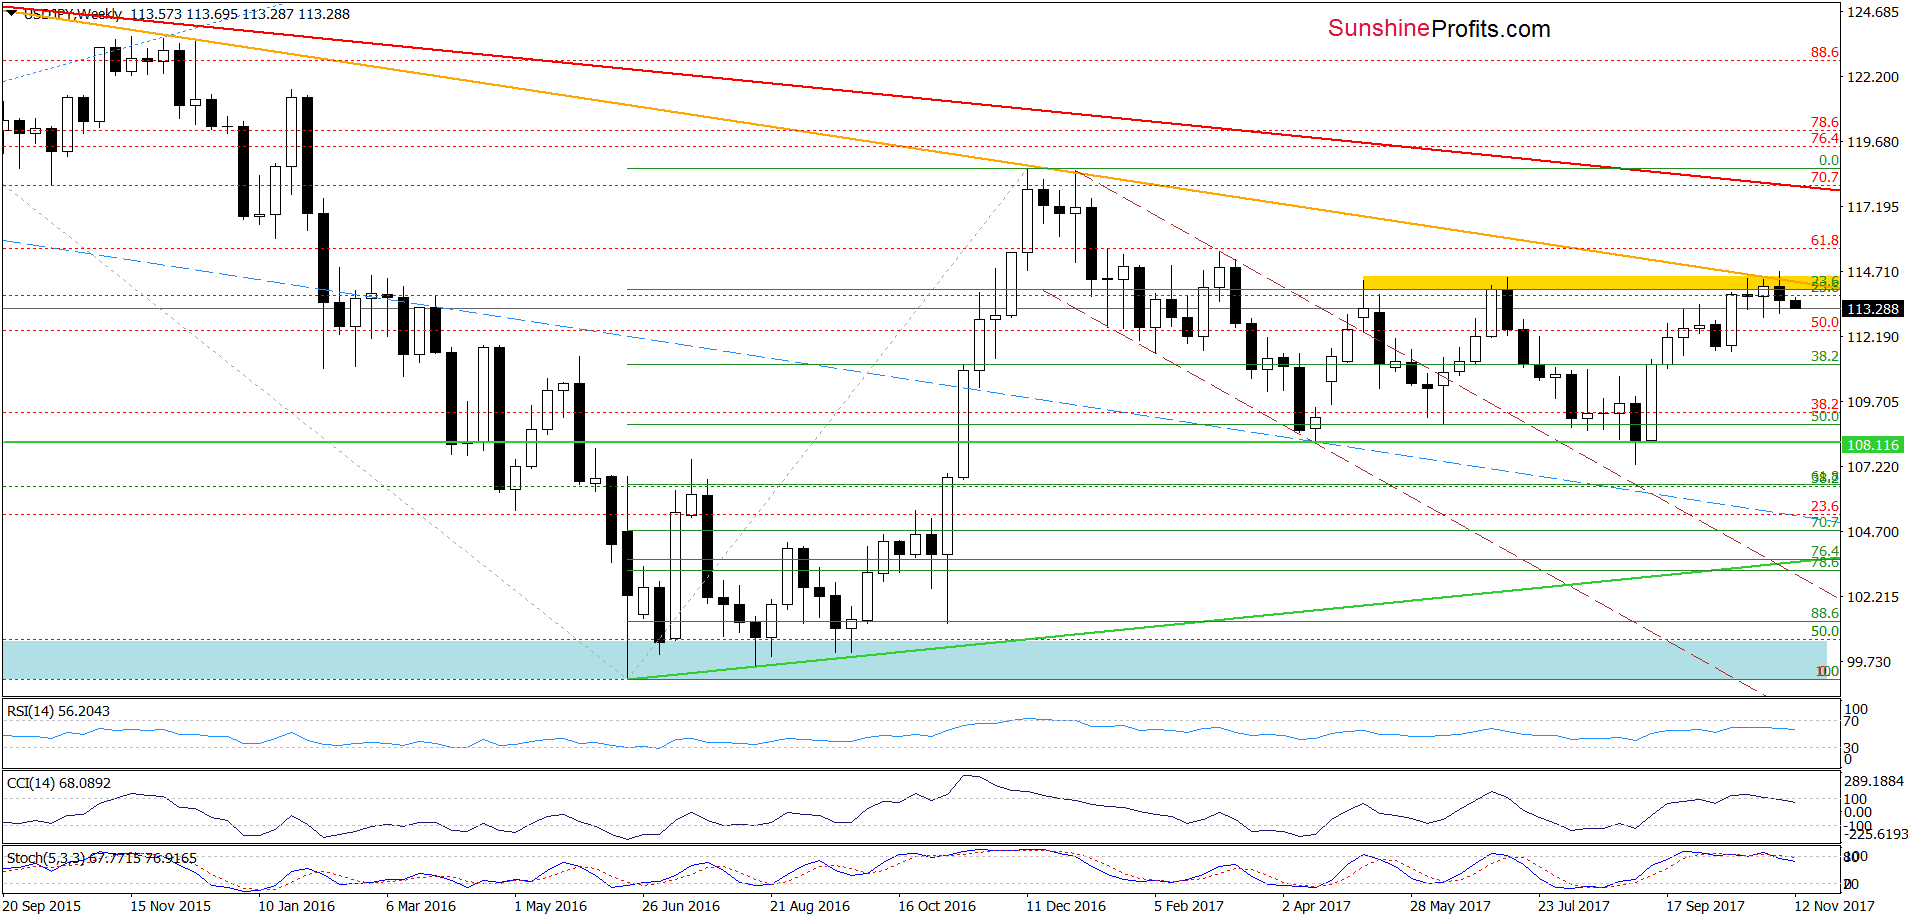
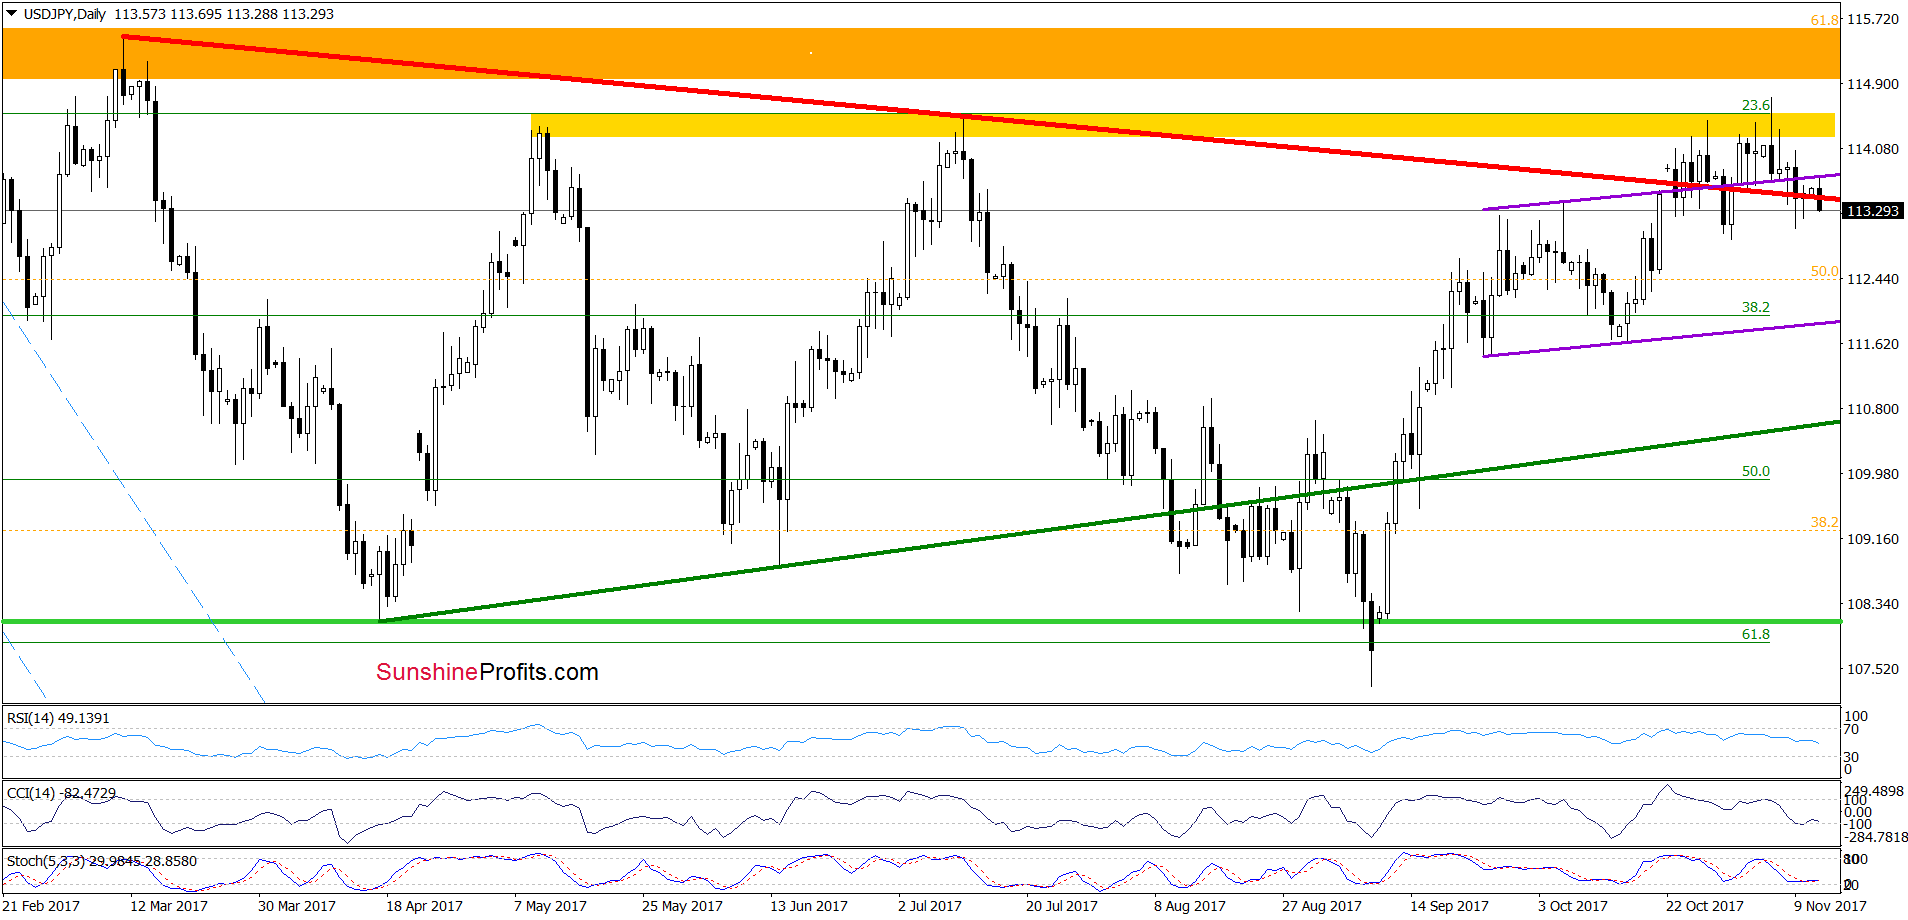
Quoting our last commentary on this currency pair:
(…) the exchange rate slipped under the upper border of the purple rising trend channel and the long-term red declining resistance line (both marked on the daily chart), which suggests a test of the October 31 low or even a decline to the lower border of the purple rising trend channel (currently around 111.83) in the following days.
Looking at the chart, we see that although USD/JPY moved a bit higher earlier today, the previously-broken upper border of the purple rising trend channel sopped currency bulls, triggering a pullback, which took the exchange rate under the long-term red declining resistance line. This suggests that we’ll likely see further decline and a realization of the above-mentioned scenario.
Very short-term outlook: mixed
Short-term outlook: mixed
MT outlook: mixed
LT outlook: mixed
Trading position (short-term; our opinion): No positions are justified from the risk/reward perspective at the moment. We will keep you informed should anything change, or should we see a confirmation/invalidation of the above.
Thank you.
Nadia Simmons
Forex & Oil Trading Strategist
Przemyslaw Radomski, CFA
Founder, Editor-in-chief, Gold & Silver Fund Manager
Gold & Silver Trading Alerts
Forex Trading Alerts
Oil Investment Updates
Oil Trading Alerts


