In our opinion the following forex trading positions are justified - summary:
- EUR/USD: short (a stop-loss order at 1.2250; the initial downside target at 1.1510)
- GBP/USD: short (a stop-loss order at 1.3773; the next downside target at 1.3000)
- USD/JPY: none
- USD/CAD: none
- USD/CHF: none
- AUD/USD: none
While we usually discuss individual currency pairs in our alerts, in today’s issue we would like to say more about the general direction of the USD Index – it provides the context for moves in the individual currency pairs and can thus help us to determine what’s likely to happen not only in the coming days, but also in the coming months.
Let’s start with the short-term outlook (charts courtesy of http://stockcharts.com):

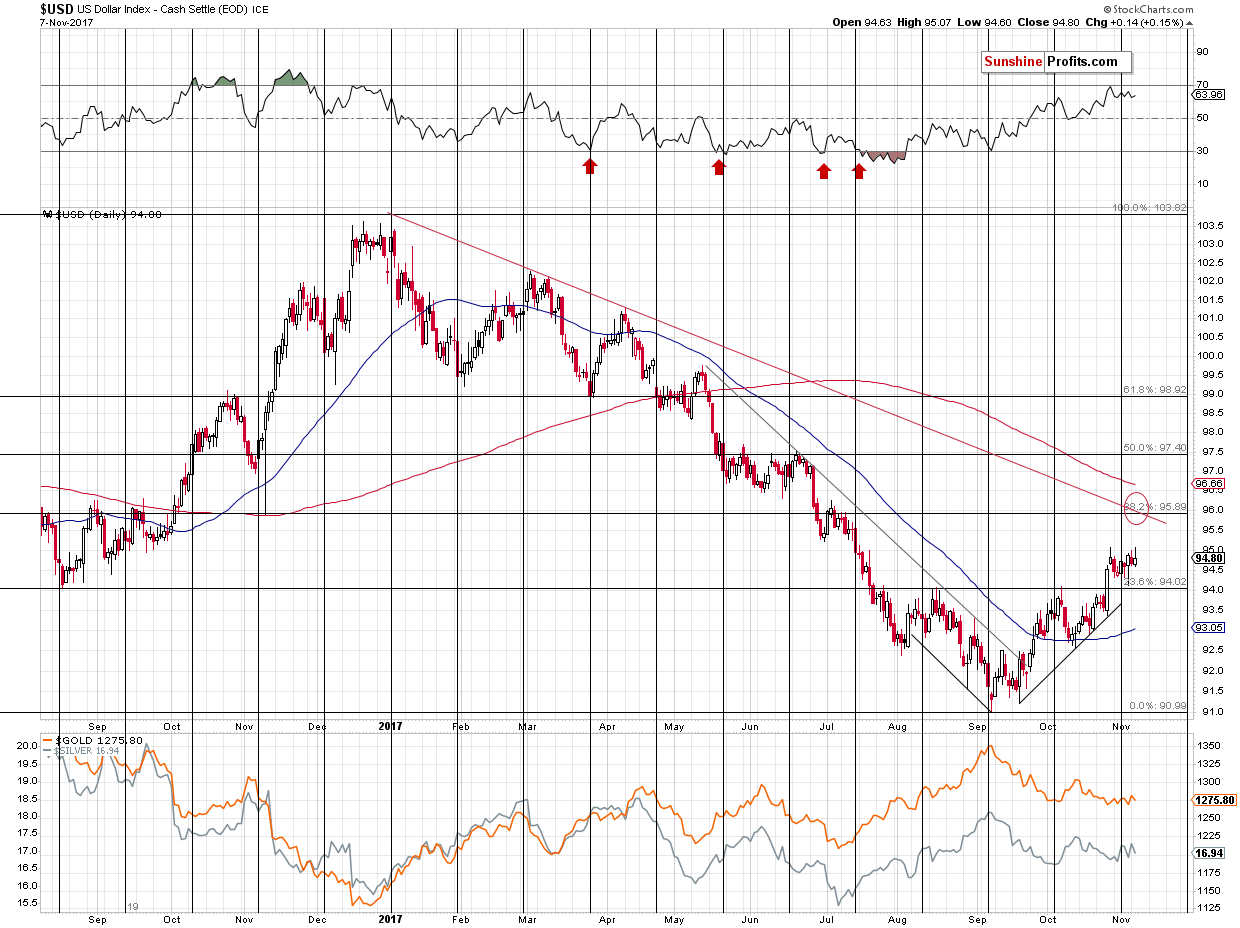
In short, the USD Index points to a reversal after an additional move in the most recent direction - up.
The breakout above the neck level of the reverse head and shoulders pattern is more than confirmed, so another rally appears very likely to be seen this week. The target at about 96 level (precisely 95.89) is supported by the declining red resistance line and the 38.2% Fibonacci resistance level. Both are based on a clearly visible, medium-term move, so they are important.
Now, let’s consider the follow-up action and in order to do this, we’ll have to look at the index from the long-term perspective.

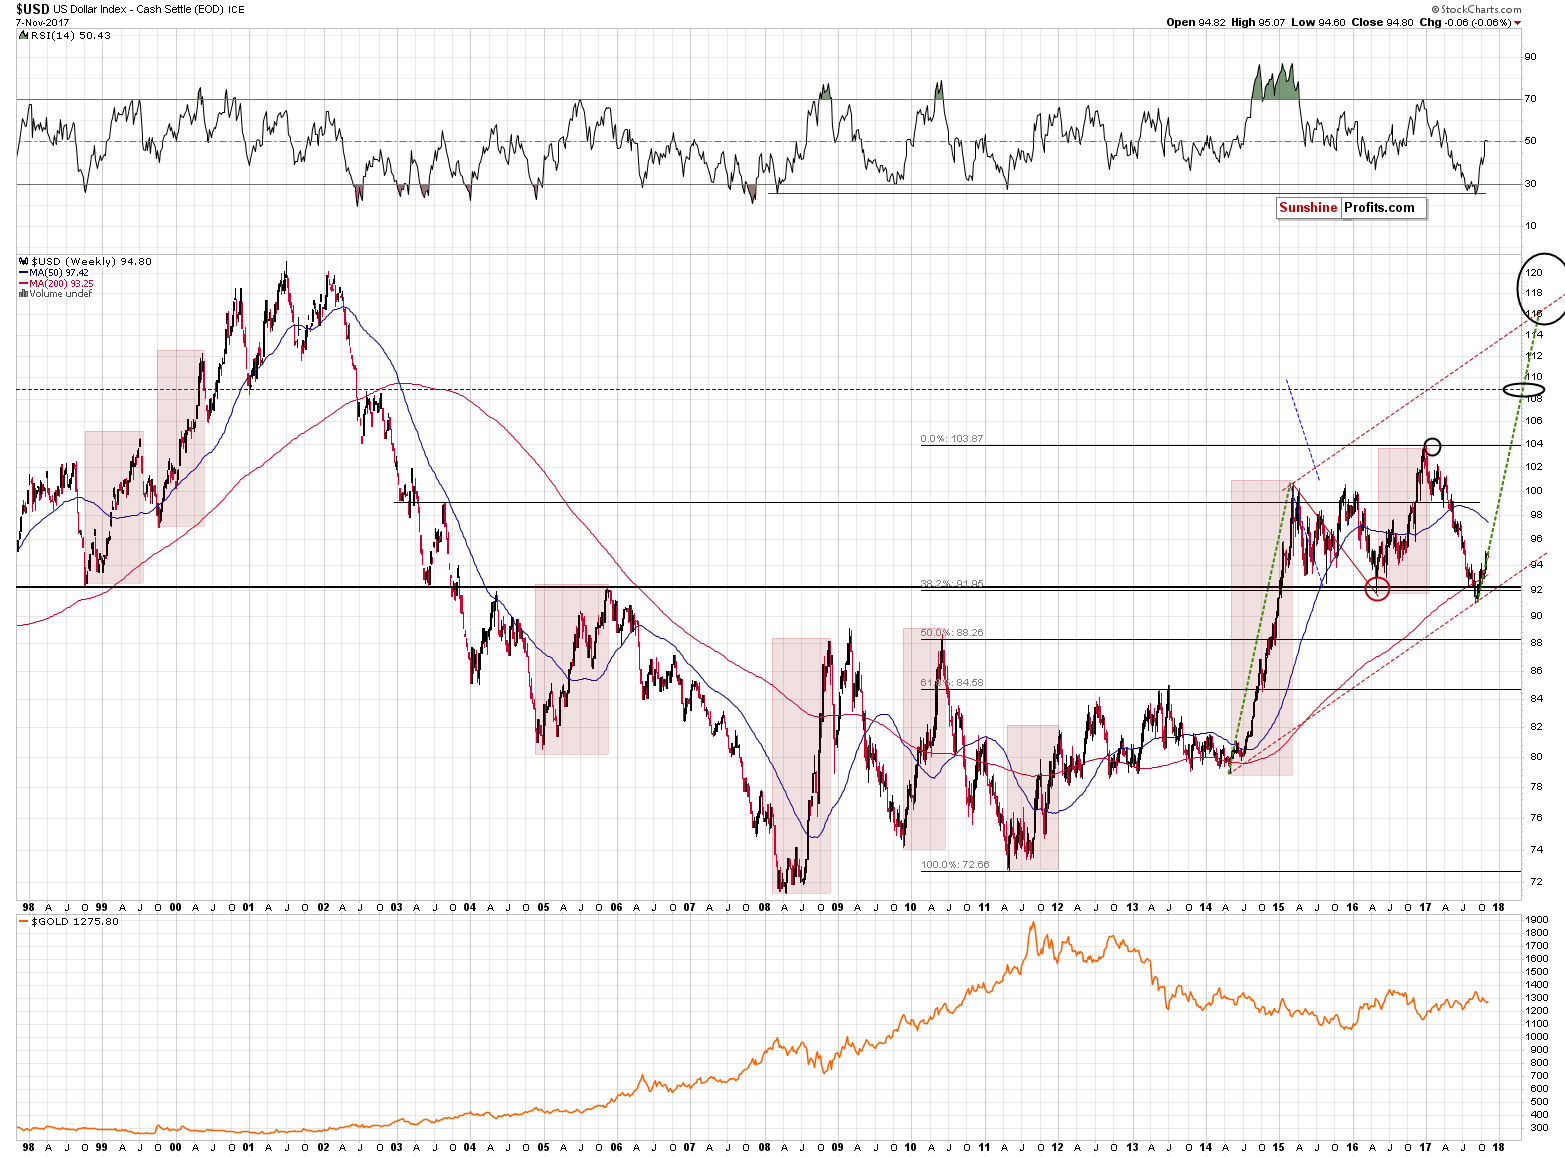
If the USD Index is starting a huge rally, just like it’s likely to based on where we are in the series of interest rate hikes, then it’s a good idea to check how the previous big USD rallies looked like and look for similarities. In this way we could spot trading opportunities (and look for confirmations at particularly important moments / price levels) and even if we don’t, the above should still prepare one for what’s to come and one would not panic in light of an event that would appear a game-changer on a day-to-day basis, but would be normal when looked at from the long-term perspective.
We marked 8 big rallies on the above 20-year chart. They vary in terms of length, size and sharpness, but there are a few similarities between them. The rallies took between (approximately) 30 and 45 weeks, so the current possible rally could end between April and July 2018, but that’s not something that has implications for the nearby days and weeks. However, analyzing the beginnings of the big rallies has such implications.
The first part of 6 out of 8 big rallies was characterized by a rather large pullback. In 1998, 2005, 2008, 2011, 2014 and 2016 the biggest, most stable and bullish part of the rally took place only after an initial correction that erased more than half of the very initial rally.
In the remaining two cases, the correction was still present, but it was not that significant.
So, should we expect the current rally to continue much higher without a bigger correction? No, such a correction would be something rather likely and normal. If the 50% correction is to be the minimum range for the pullback and the USD tops at about 96, then we can expect it to decline to about 93 – 93.5. The decline could be even bigger, but the above chart does not provide clear indications thereof – only that it should take USD at least approximately 2.5 index points lower.
That would not be a small move, so adjusting one’s trading positions (like our current short positions in EUR/USD and GBP/USD) might be a good idea should it become very likely. That’s what we are planning to do, but whether we will proceed or not will depend on the confirmations that we’ll get from the individual currency pairs.
We will keep you informed should anything change, or should we see a confirmation / invalidation of the above.
Thank you.
Nadia Simmons
Forex & Oil Trading Strategist
Przemyslaw Radomski, CFA
Founder, Editor-in-chief, Gold & Silver Fund Manager
Gold & Silver Trading Alerts
Forex Trading Alerts
Oil Investment Updates
Oil Trading Alerts


