Although the USD Index had some troubles at the end of the previous week, we didn’t notice the U.S. dollar’s weakness against its Canadian counterpart. Are there any signs on the horizon that currency bears will attack in the near future?
In our opinion the following forex trading positions are justified - summary:
EUR/USD
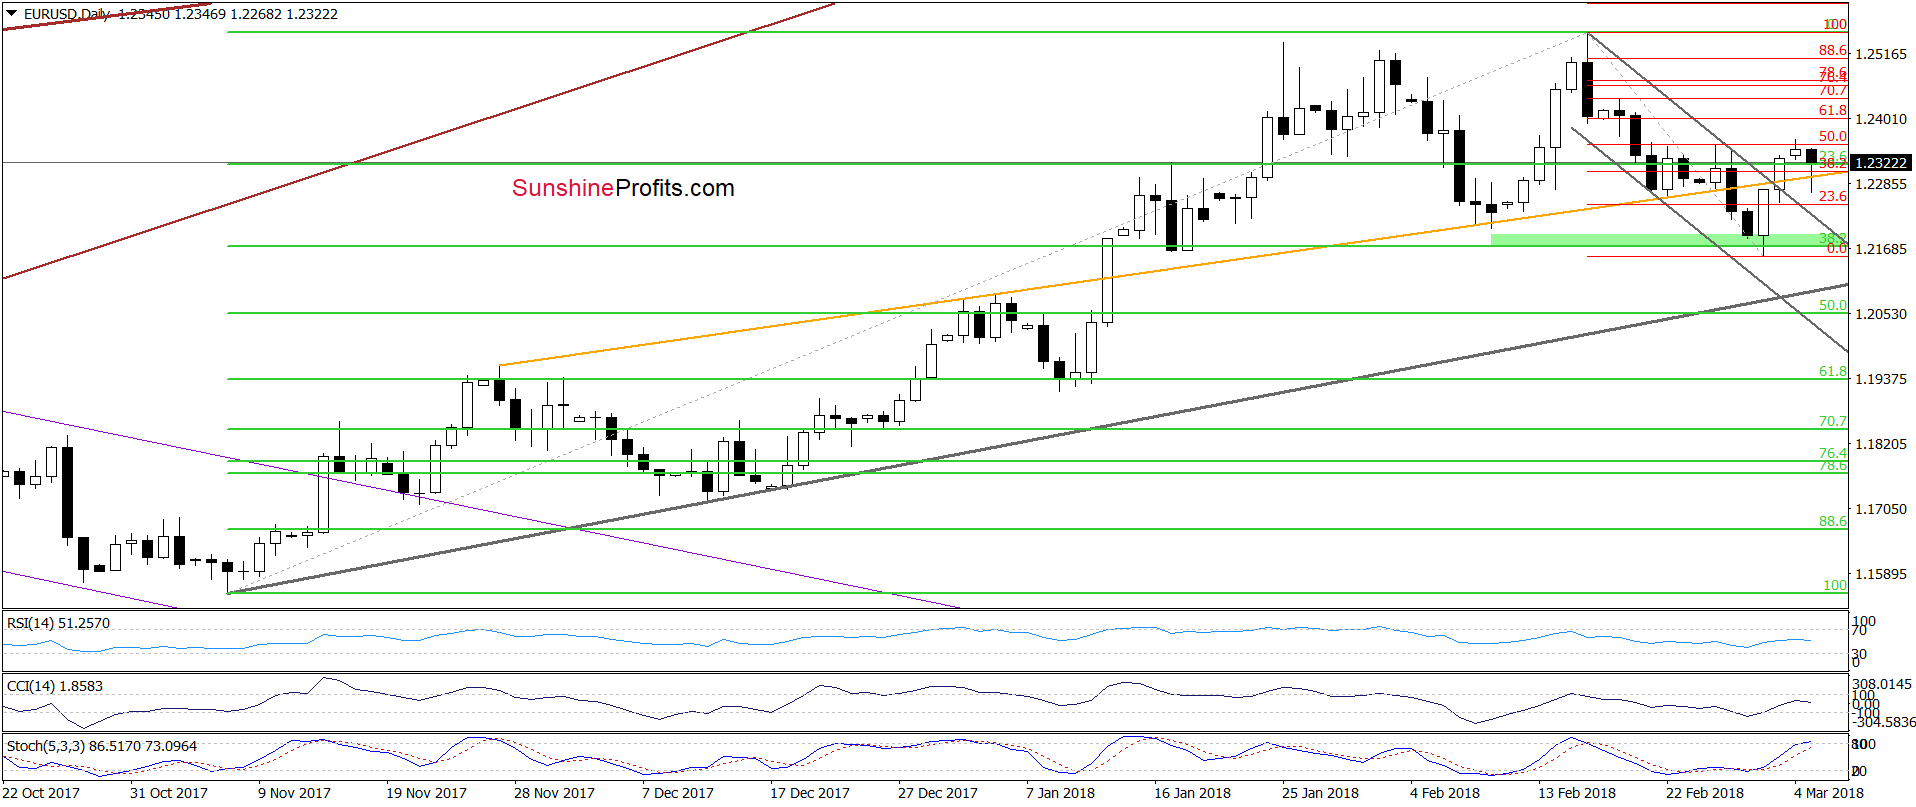
Looking at the daily chart, we see that although currency bears pushed EUR/USD a bit lower earlier today, their opponent didn’t give up without a fight and triggered a rebound. As a result, the pair came back above the previously-broken orange line, invalidating today’s short-lived breakdown.
Despite this positive development, the current position of the daily indicators doesn’t look encouraging from the bulls’ point of view. Nevertheless, as long as there are no sell signals another attempt to move higher can’t be ruled out.
What could happen if EUR/USD climbs above the last week’s peaks? Let’s zoom in the daily chart to find out.
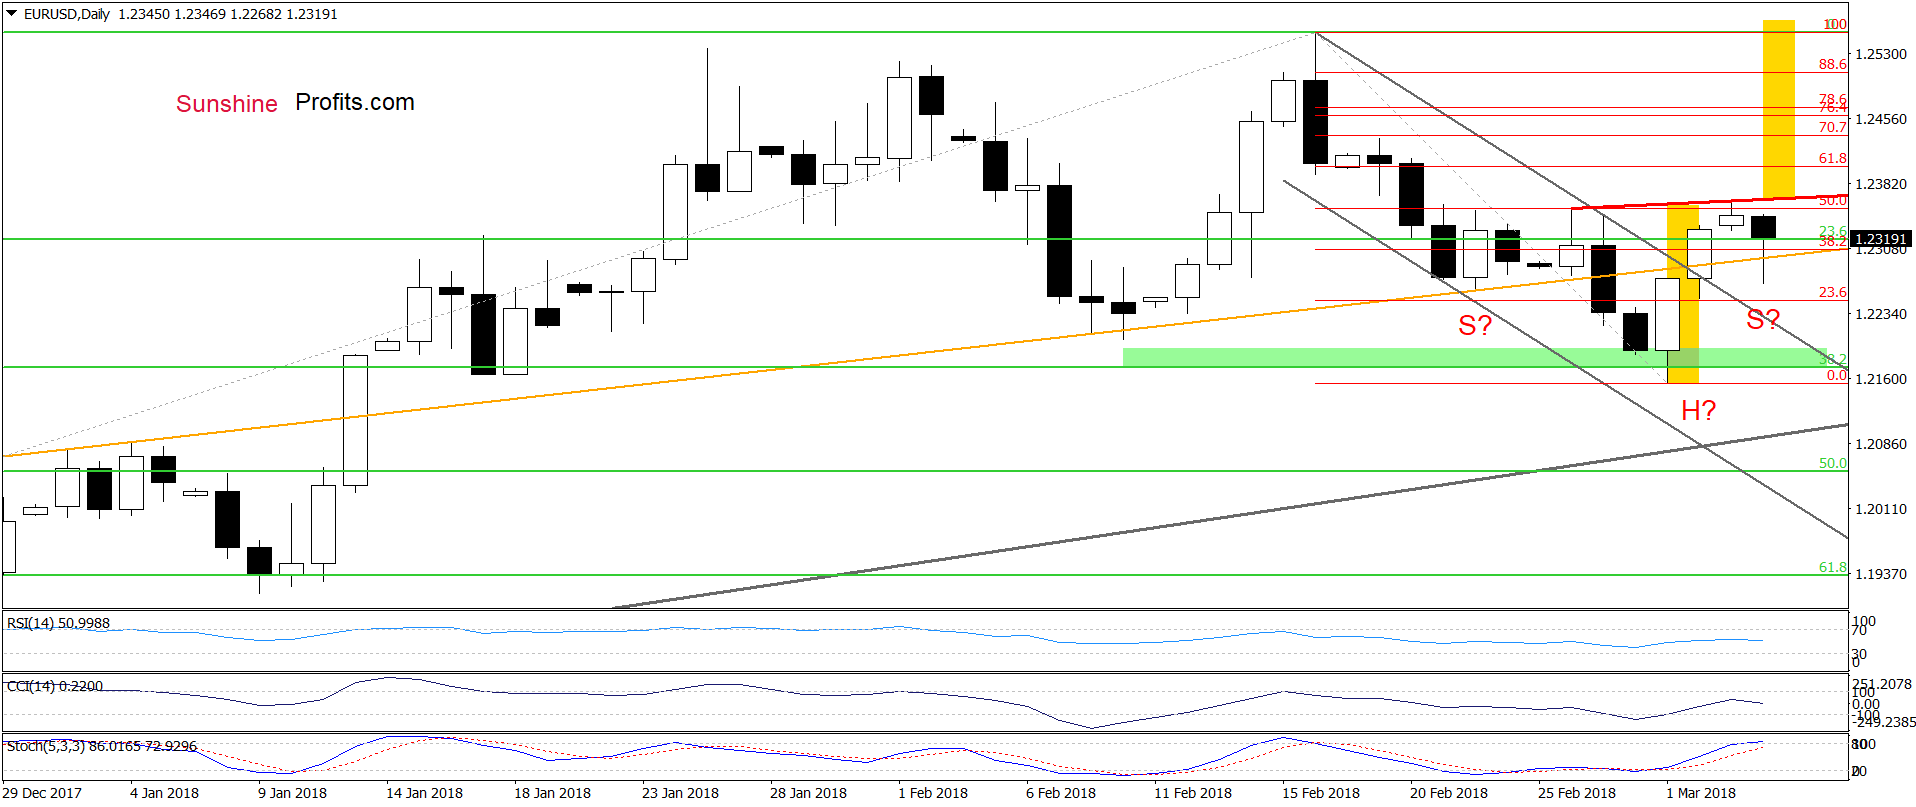
When we take a closer look at the above chart, we can notice a potential reverse head and shoulders formation. Nevertheless, we emphasize once again that it is a potential pattern and there are no bullish implications at the moment of writing these words.
It will, however, become a bulls’ ally when the exchange rate rises above the red resistance line based on the recent highs. At this point, it is also worth noting that if we see a daily closure above this line, the bulls may even take the pair to the 2018 peak.
On the other hand, if currency bulls show weakness in the coming week – for example they do not hold EUR/USD above the previously-broken upper border of the grey declining trend channel, we’ll consider re-opening short positions.
Trading position (short-term; our opinion): no positions are justified from the risk/reward perspective now. We will keep you informed should anything change, or should we see a confirmation/invalidation of the above.
USD/JPY
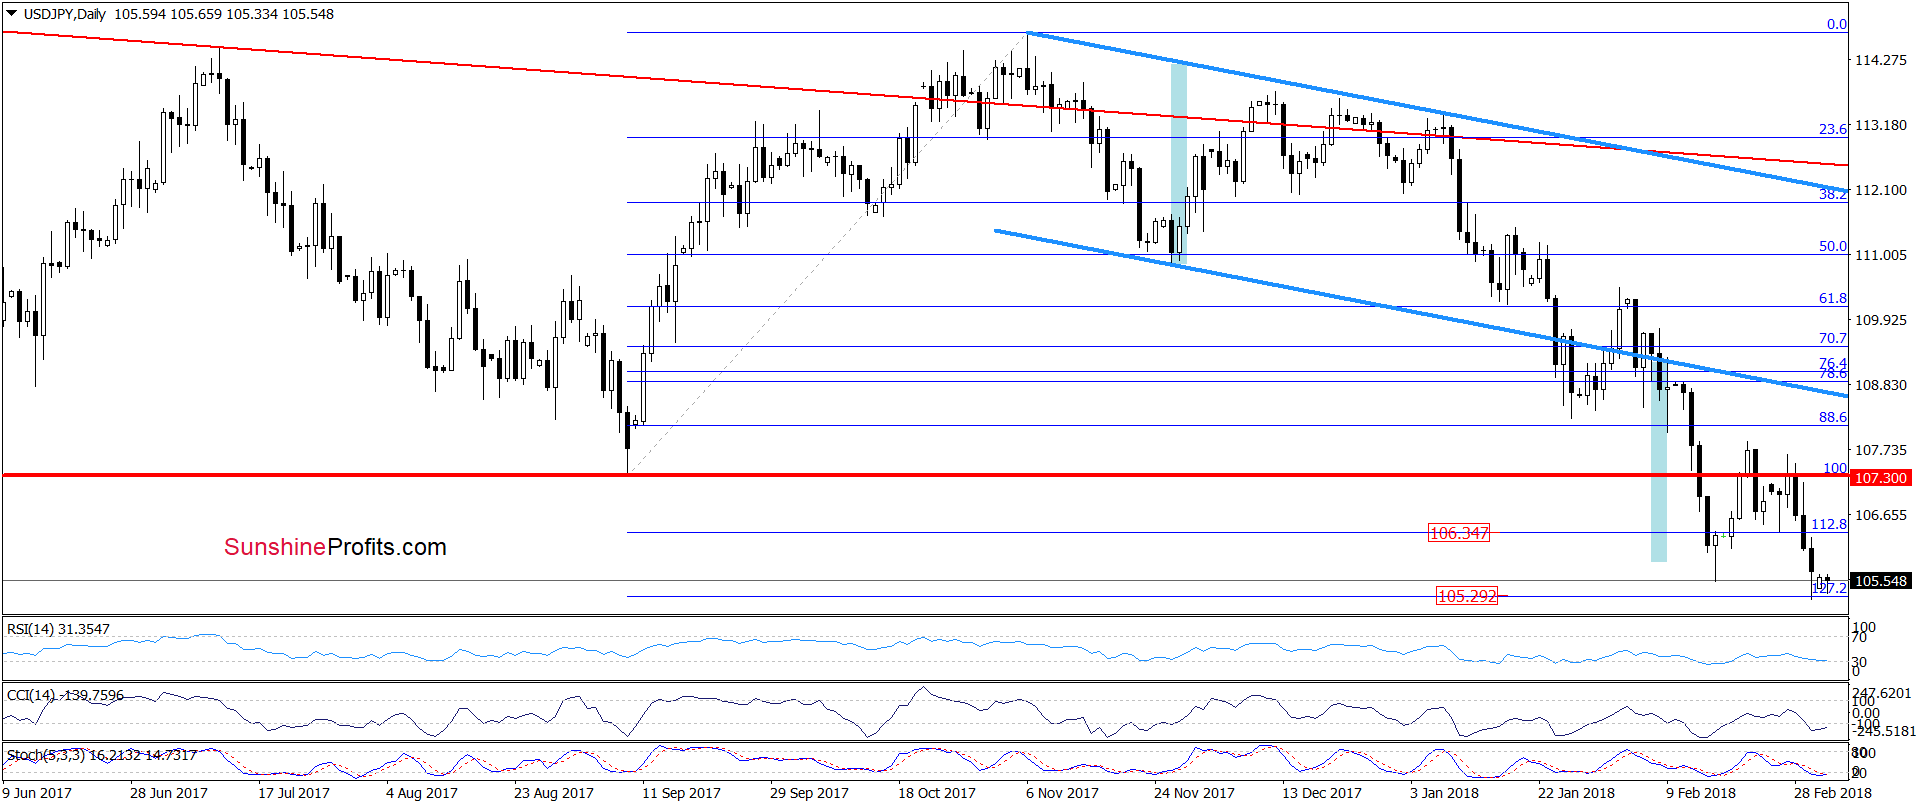
On Wednesday, we wrote the following:
Yesterday, currency bulls pushed USD/JPY above the September low once again, but as it turned out this improvement was very temporary, and the exchange rate came back under the red horizontal line.
This is a repeat of what we already saw in the previous week, which increases the probability that another attempt to move lower should not surprise us. If this is the case and USD/JPY declines from the current levels, we think that the pair will test the strength of the recent low (or even the 127.2% Fibonacci extension) in the very near future.
From today’s point of view, we see that the situation developed in line with the above scenario and USD/JPY reached our downside targets on Friday. At the moment of writing these words the pair is consolidating slightly above the 127.2% Fibonacci extension, but we think that as long as there are no buy signals generated by the indicators, currency bears can hit a fresh low.
How low could the pair g if we see such price action?
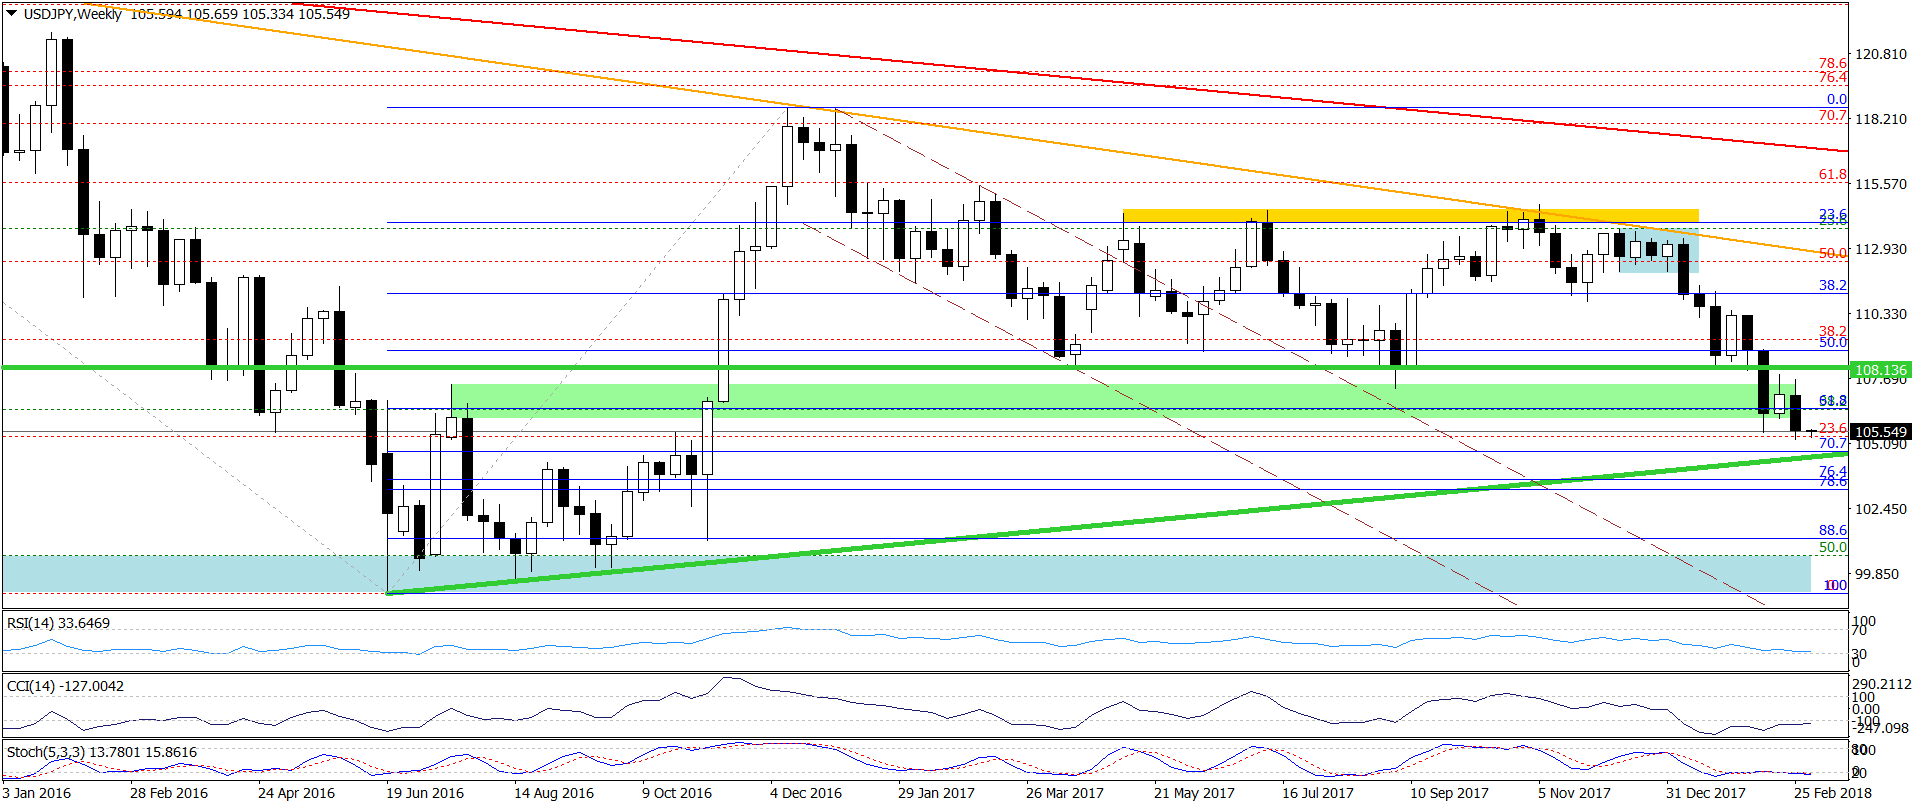
In our opinion, in the case of the breakdown below the last week’s low, the first downside target for the sellers will be the long-term green support line based on the June, August and September 2016 lows (currently around 104.66).
Trading position (short-term; our opinion): No positions are justified from the risk/reward perspective. We will keep you informed should anything change, or should we see a confirmation/invalidation of the above.
USD/CAD
Quoting our last commentary on this currency pair:
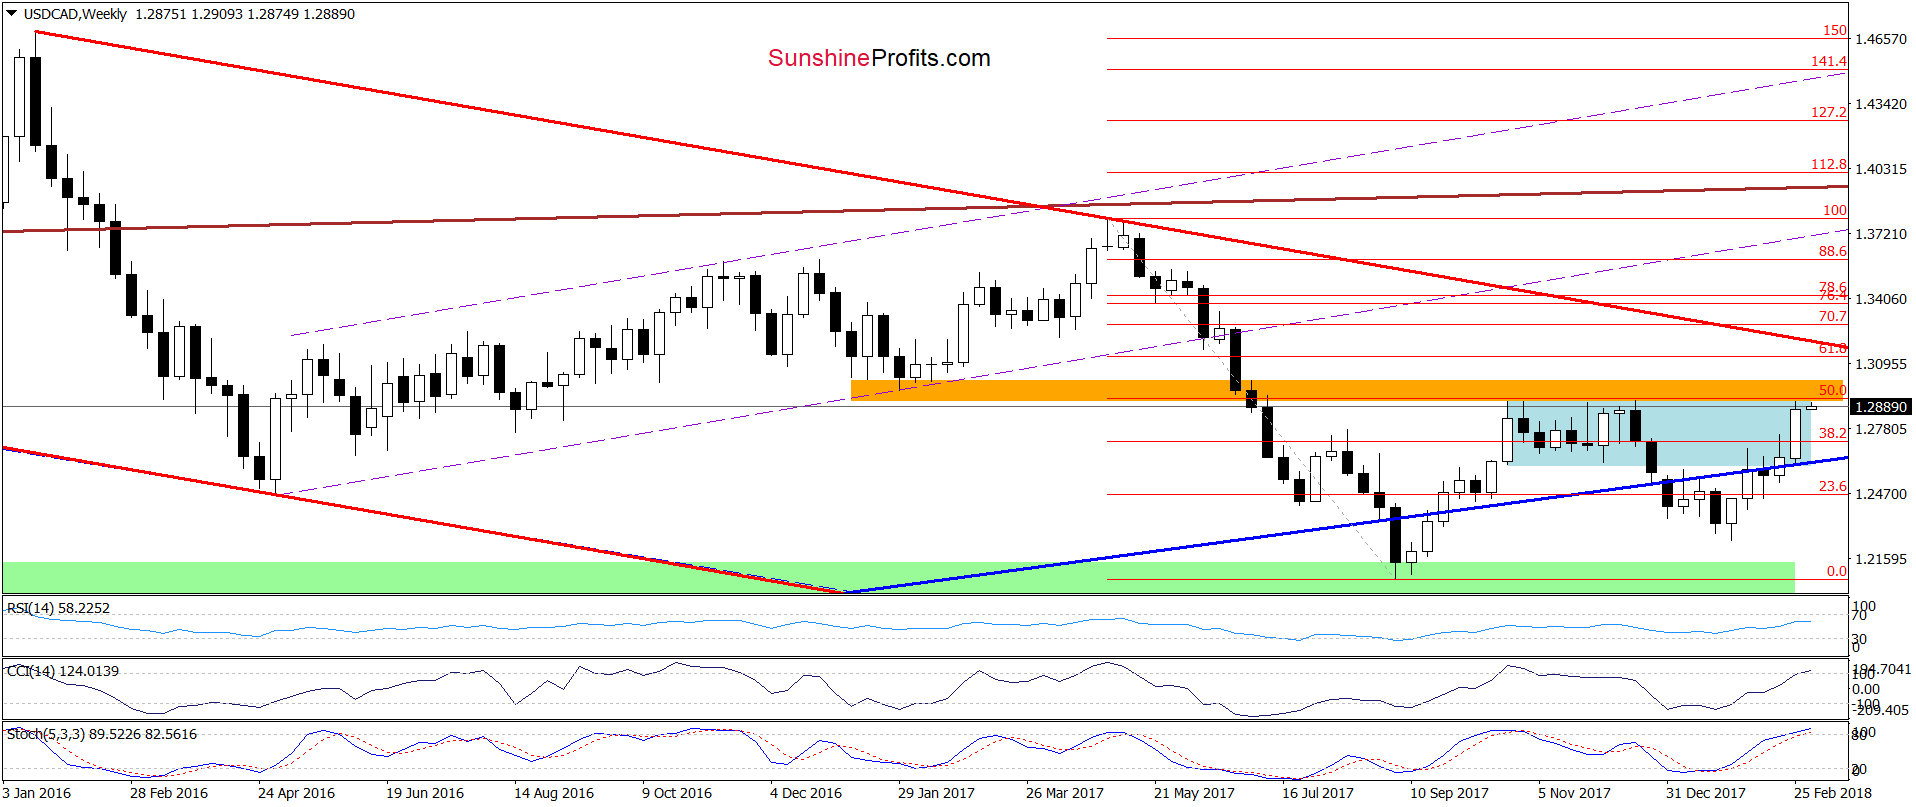
On the medium-term chart, we see that invalidations of the breakdown under the long-term blue support line and the lower border of the blue consolidation and their potential positive impact on the exchane rate are still in effect, supporting currency bulls.
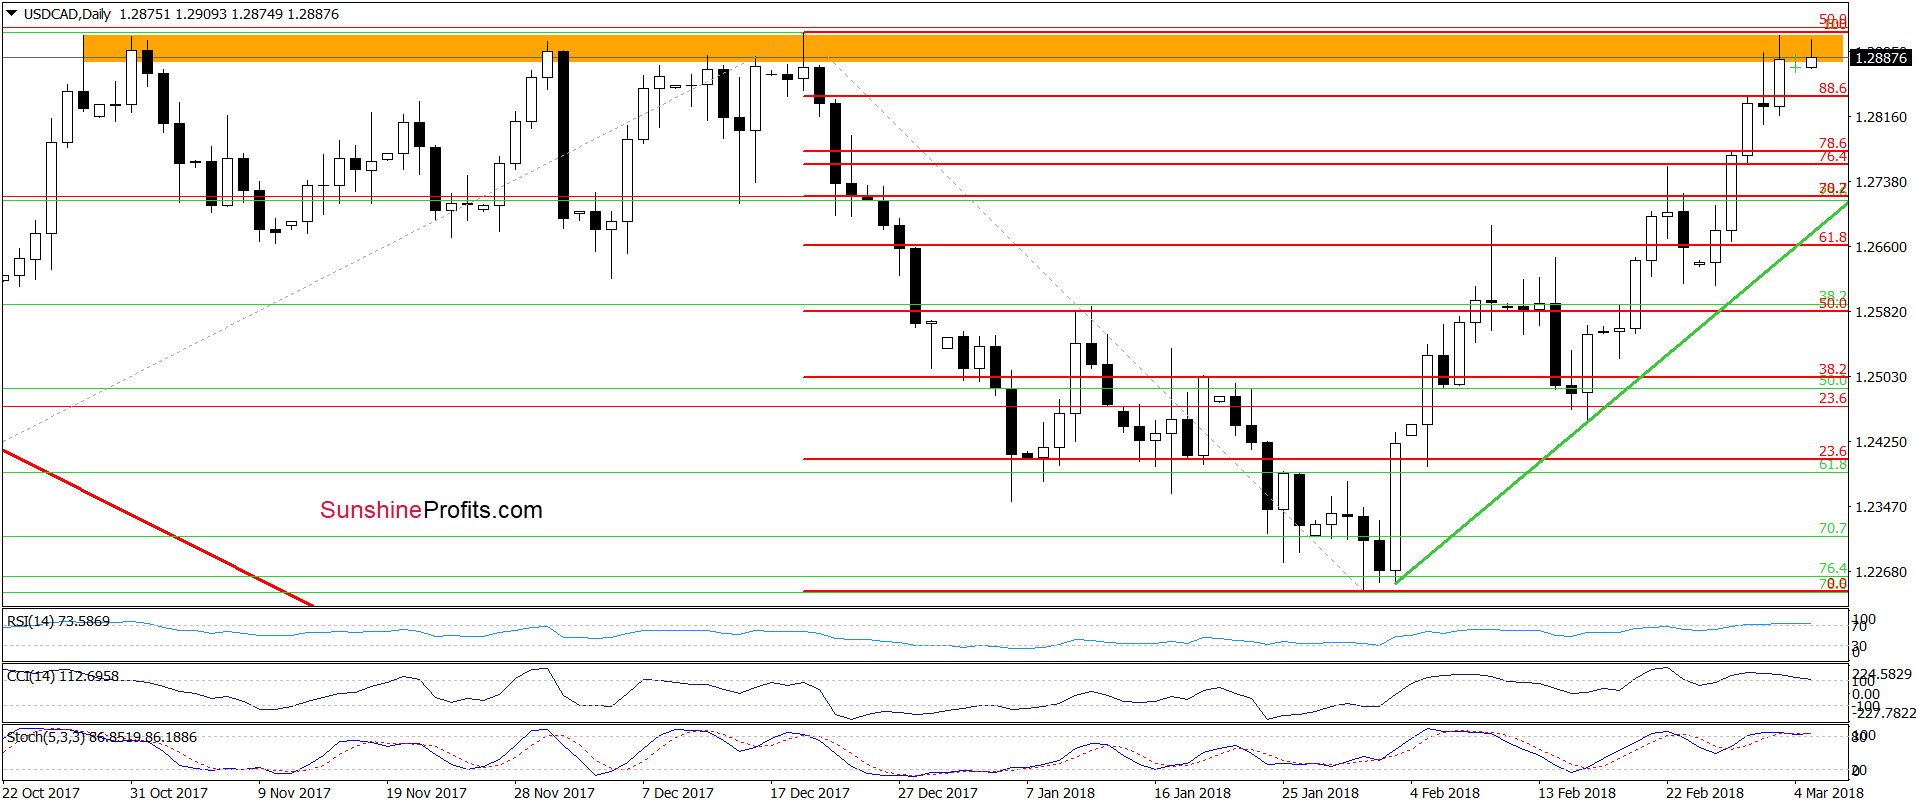
(...) which together with (…) the current position of the daily indicators suggests that we’ll see a re-test of the last week’s high (or even the upper border of the resistance zone) in the coming day(s).
Looking at the above charts, we see that currency bulls pushed USD/CAD higher (as we had expected) and the pair reached the orange resistance zone once again. As you see on the medium-term chart, this area was strong enough to stop further improvement in October, November and December 2017, which suggests that we could see a similar reversal from here in the very near future – especially when we factor in the current position of the weekly and daily indicators (they climbed to their overbought areas, increasing the likelihood of generating sell signals.
If we see such price action and any sign of currency bulls’ weakness, we’ll likely open short positions. As always, we will keep you informed.
Trading position (short-term; our opinion): no positions are justified from the risk/reward perspective now. We will keep you informed should anything change, or should we see a confirmation/invalidation of the above.
Thank you.
Nadia Simmons
Forex & Oil Trading Strategist
Przemyslaw Radomski, CFA
Founder, Editor-in-chief, Gold & Silver Fund Manager
Gold & Silver Trading Alerts
Forex Trading Alerts
Oil Investment Updates
Oil Trading Alerts


