Thanks to recent increases USD/CHF extended gains and climbed above the previously-broken long-term declining line. Is it enough to trigger further rally?
In our opinion the following forex trading positions are justified - summary:
- EUR/USD: short (a stop-loss order at 1.1505; the initial downside target at 1.1009)
- GBP/USD: short (a stop-loss order at 1.3232; the initial downside target at 1.2375)
- USD/JPY: long (a stop-loss order at 111.67; the initial upside target at 114.87)
- USD/CAD: none
- USD/CHF: none
- AUD/USD: short (a stop-loss order at 0.7724; the initial downside target at 0.7473)
EUR/USD
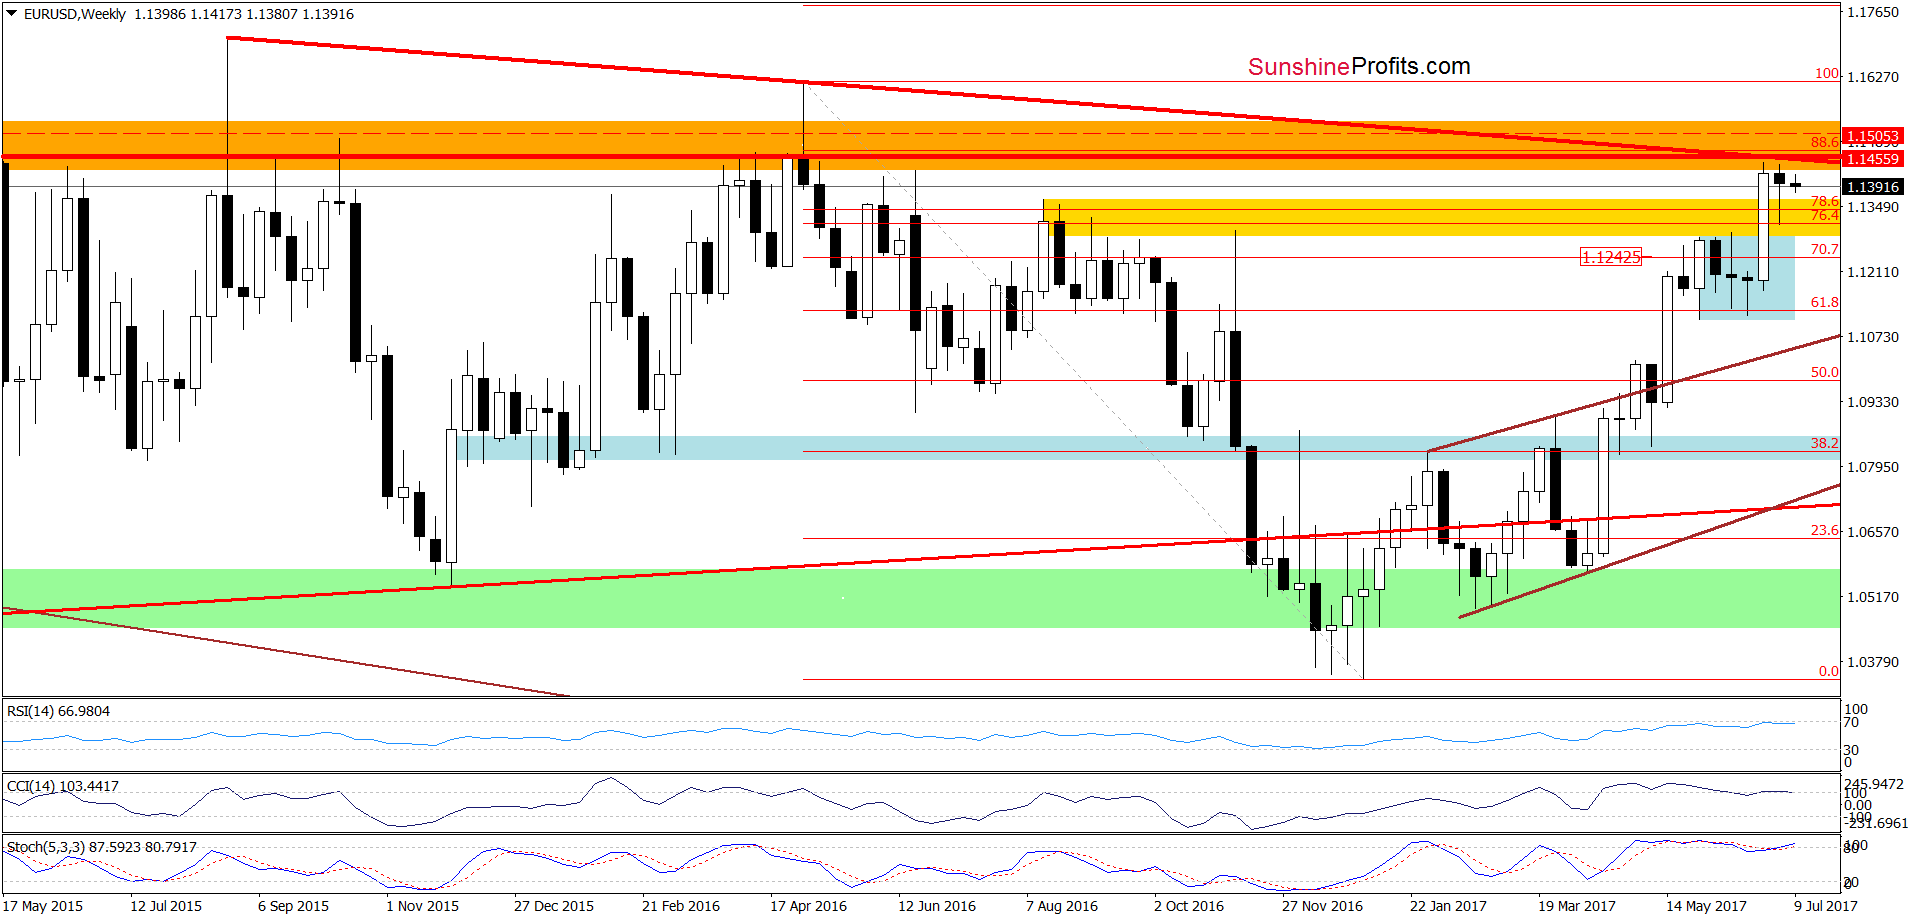
Looking at the medium-term chart, we see that overall situation hasn’t changed much as EUR/USD remains under two key resistance lines: the long-term red resistance line based on the August 2015 and May 2016 peaks and the red horizontal resistance line cased on the highest weekly closures.
What does it mean for the exchange rate? We believe that the best answer to this question will be quotes from our Wednesday’s commentary:
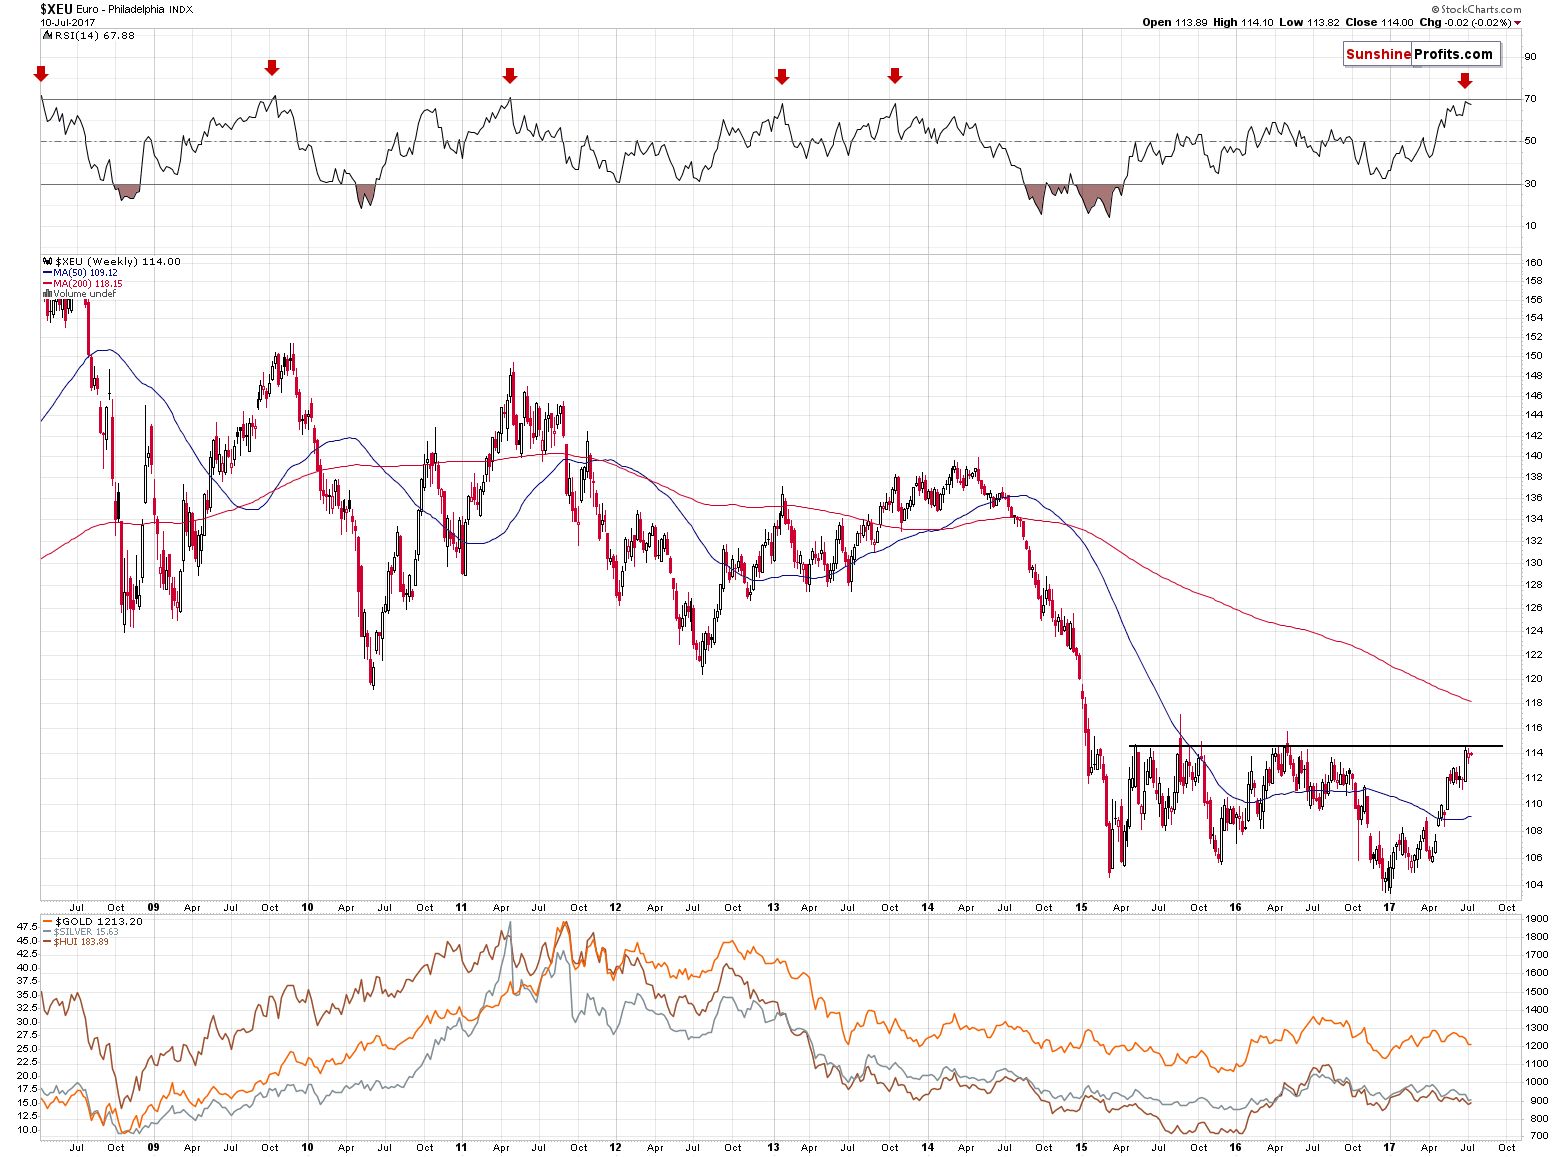
(…) it strongly appears that the euro has either reached its top or is about to do so shortly (perhaps today). The horizontal resistance line that you can see on the above chart is based on the highest weekly closes of the previous years. The weekly closing prices are the key closes to keep in mind in the case of bigger trends and the level that was just reached stopped the rally twice. There were temporary moves above it, but they all were very temporary. Since the week is ending today, it appears that the top is in or that we will see only a temporary upswing and a weekly close back at/below the resistance line.
A strong bearish confirmation comes from the RSI indicator – practically in all recent cases (the last 9 years), the readings of the RSI that were as high as the current ones meant that the euro was going to reverse shortly.
So, despite the bullish action [last] week, the outlook for the euro is actually very bearish and the chart is quite clear about that.
Monday’s session seems to have confirmed the above – the Euro Index declined, just like it did previously when it approached similar price levels in terms of the weekly closing prices. The outlook remains strongly bearish – it seems that another sizable decline has already started.
Very short-term outlook: bearish
Short-term outlook: mixed with bearish bias
MT outlook: mixed
LT outlook: mixed
Trading position (short-term; our opinion): Short positions with a stop-loss order at 1.1505 and the initial downside target at 1.1009) are justified from the risk/reward perspective. We will keep you informed should anything change, or should we see a confirmation/invalidation of the above.
USD/CAD
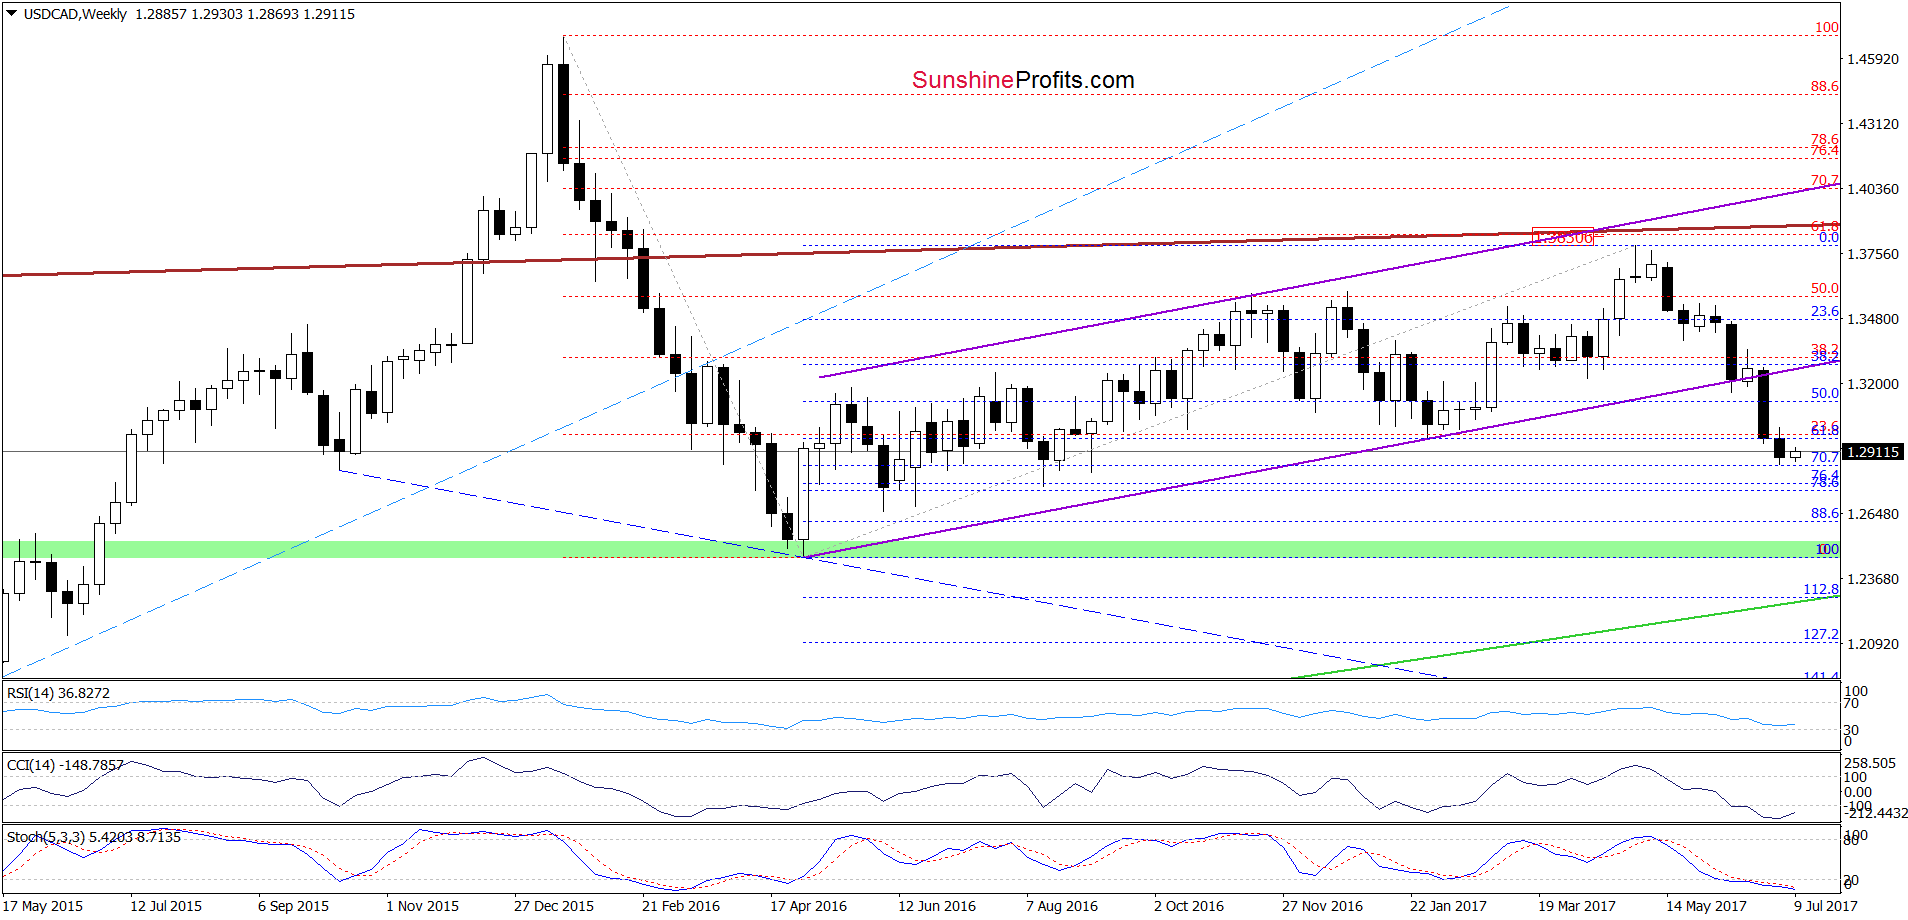
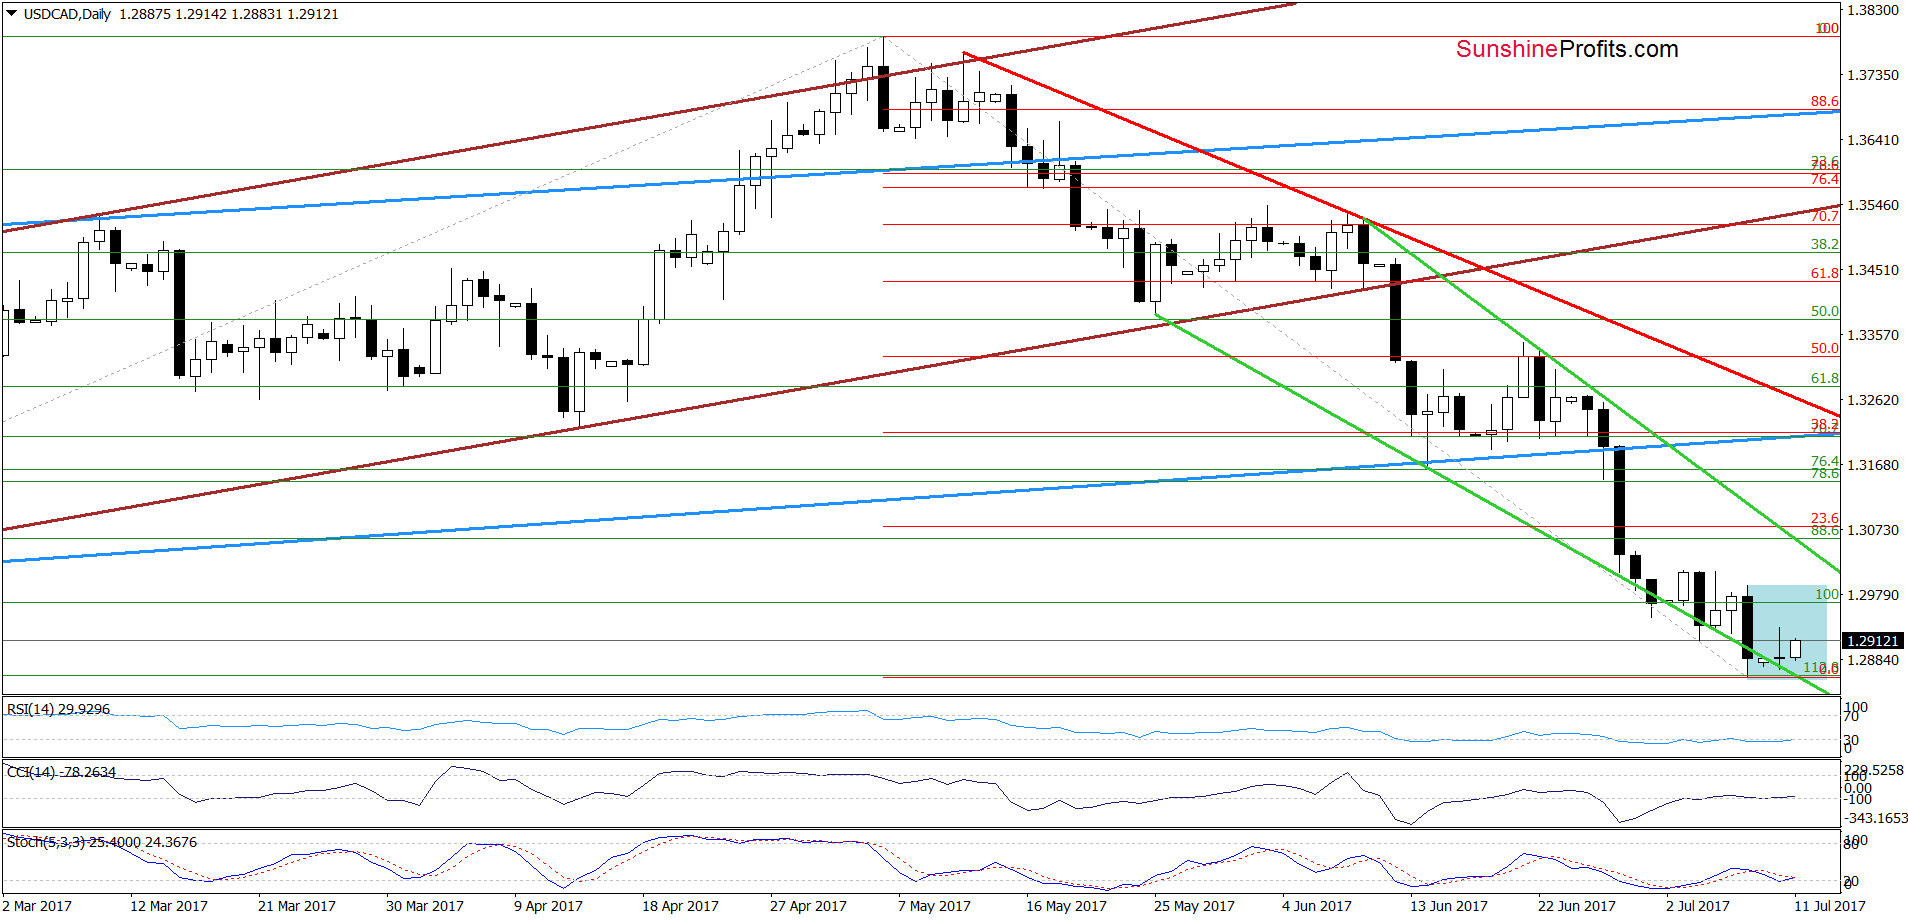
From today’s point of view, we see that currency bears pushed USD/CAD lower, which resulted in a drop to the 70.7% Fibonacci retracement (seen on the weekly chart), the 112.8% Fibonacci extension and the lower border of the green declining wedge (both marked on the daily chart). As you see this area triggered a small (compared to the size of declines) rebound recently, but the pair is still trading in the blue consolidation.
What’s next for the exchange rate? Taking into account the proximity to the above-mentioned support zone and the buy signals generated by the indicators, it seems to us that further improvement is just around the corner. However, bigger and more reliable move will be more likely if USD/CAD breaks above the upper line of the consolidation and the upper border of the green declining wedge. If we see such price action, we’ll consider opening long positions.
Very short-term outlook: mixed with bullish bias
Short-term outlook: mixed with bullish bias
MT outlook: mixed
LT outlook: mixed
Trading position (short-term; our opinion): No positions are justified from the risk/reward perspective at the moment. We will keep you informed should anything change, or should we see a confirmation/invalidation of the above.
USD/CHF
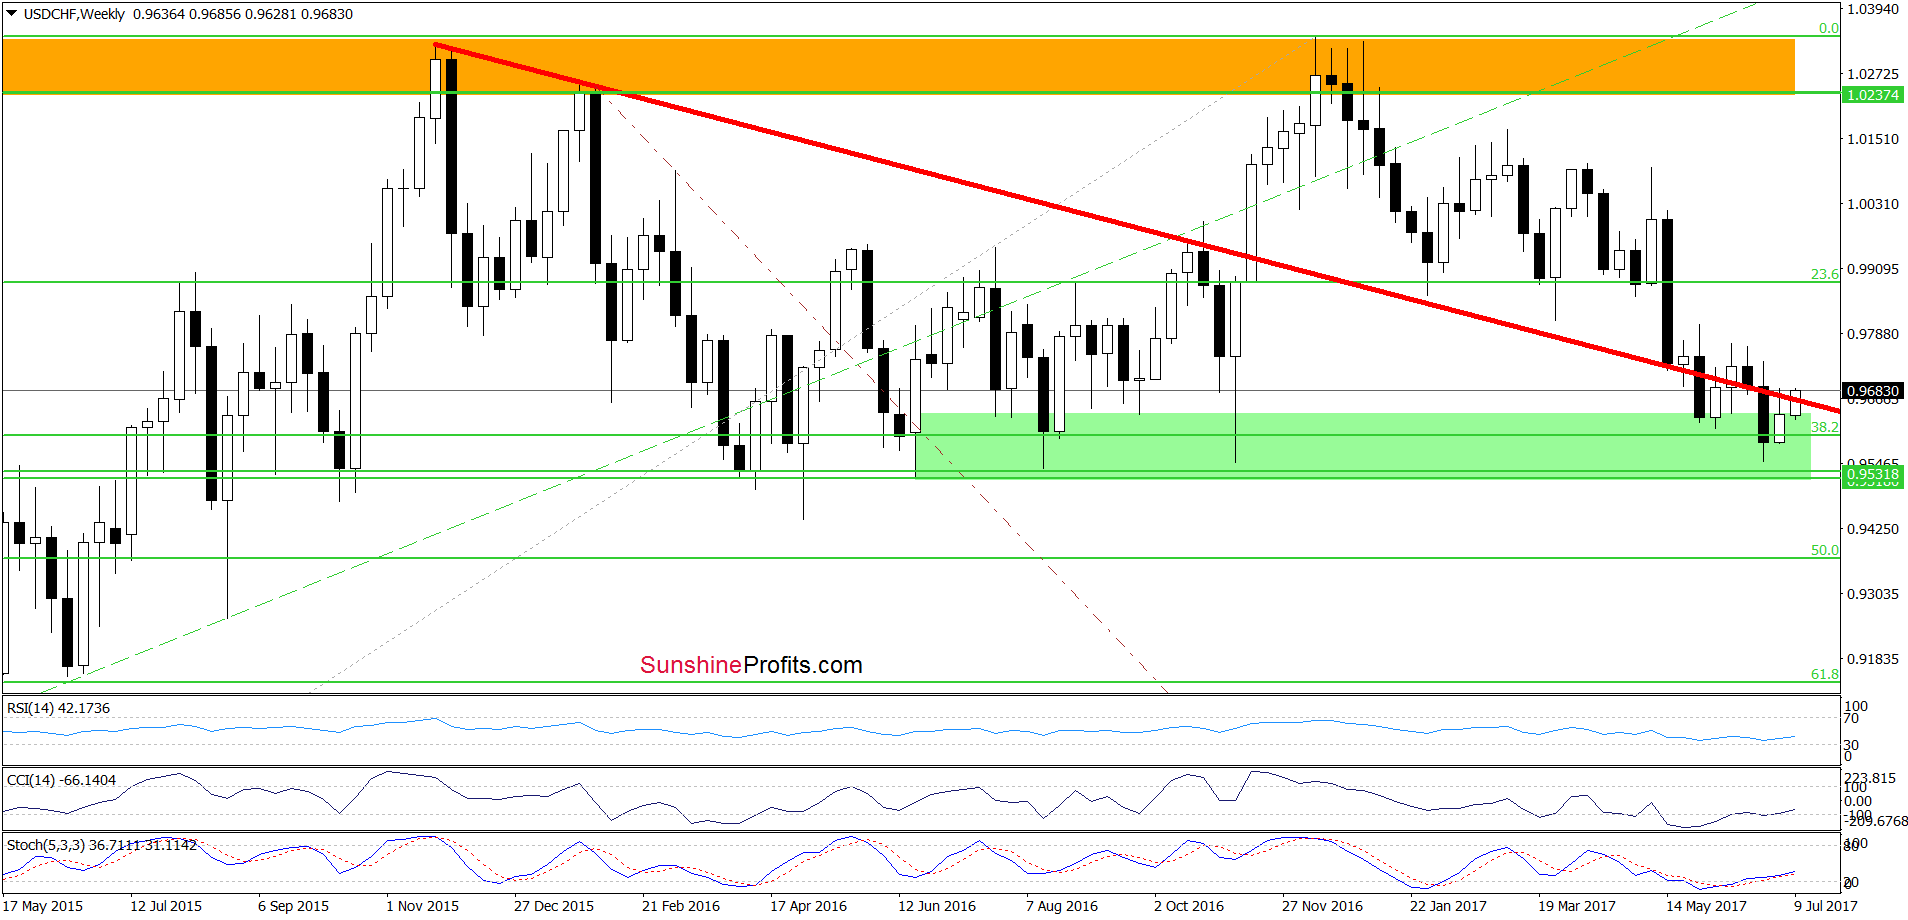
The first think that catches the eye on the weekly chart is a comeback above the previously-broken red declining resistance line. Although this is a positive sign, it will turn into bullish if the pair closes the week above the red line. Nevertheless, it is worth keeping in mind that the CCI and the Stochastic Oscillator generated the buy signals, increasing the probability of further improvement.
Having said the above let’s examine the very short-term chart.
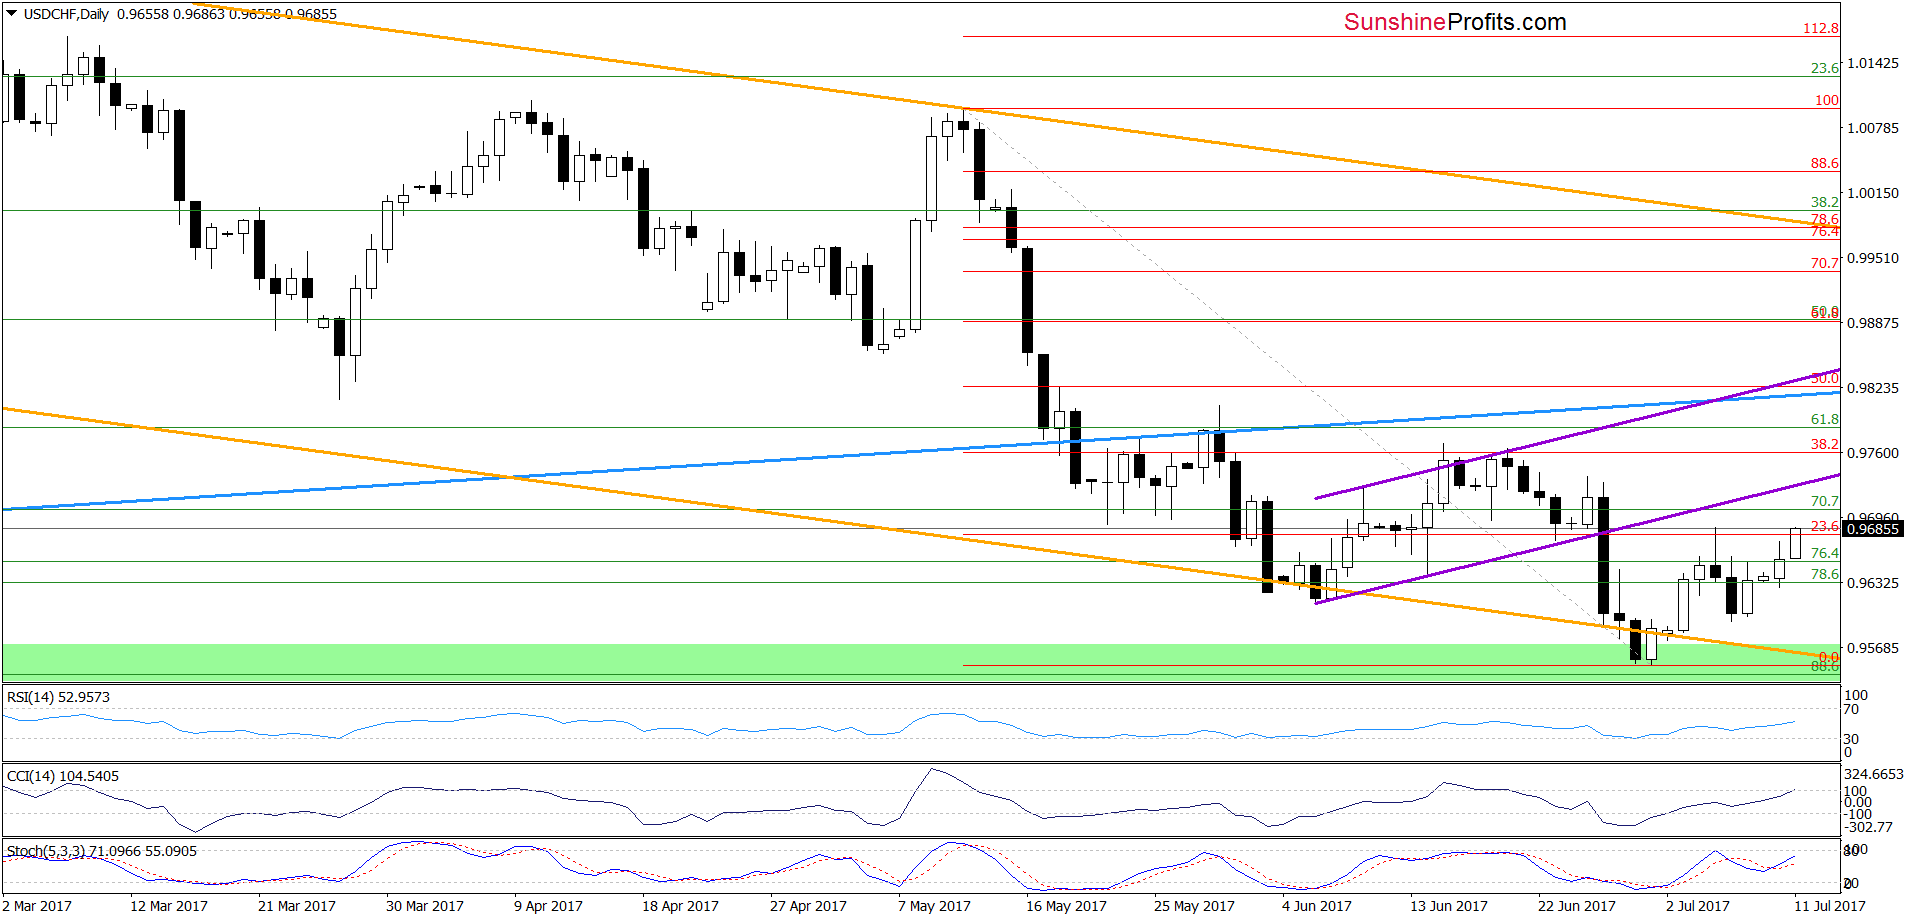
From this perspective, we see that the recent upward move took USD/CHF to the last week’s high. Additionally, the buy signals generated by the CCI and the Stochastic Oscillator remain in cards, supporting currency bulls and another attempt to move higher.
How high could the exchange rate go in the coming week? In our opinion, the first upside target will be around 0.9726, where the previously-broken lower border of the rising purple trend channel (marked on the daily chart) currently is. If we see an invalidation of this breakdown, the next target will be around 0.9760, where the 38.2% Fibonacci retracement and the mid-Jun highs are.
Very short-term outlook: mixed with bullish bias
Short-term outlook: mixed with bullish bias
MT outlook: mixed
LT outlook: mixed
Trading position (short-term; our opinion): No positions are justified from the risk/reward perspective. We will keep you informed should anything change, or should we see a confirmation/invalidation of the above.
Thank you.
Nadia Simmons
Forex & Oil Trading Strategist
Przemyslaw Radomski, CFA
Founder, Editor-in-chief, Gold & Silver Fund Manager
Gold & Silver Trading Alerts
Forex Trading Alerts
Oil Investment Updates
Oil Trading Alerts


