Earlier today, the data showed that the U.S. economy added 313,000 jobs in February, beating expectations for 200,000. Despite these bullish numbers, the unemployment rate and average hourly earnings disappointed investors, which pulled the U.S. dollar away from the earlier peaks. Does it mean that another downswing in the greenback is just around the corner?
In our opinion the following forex trading positions are justified - summary:
EUR/USD – Currency Bulls Disappointed
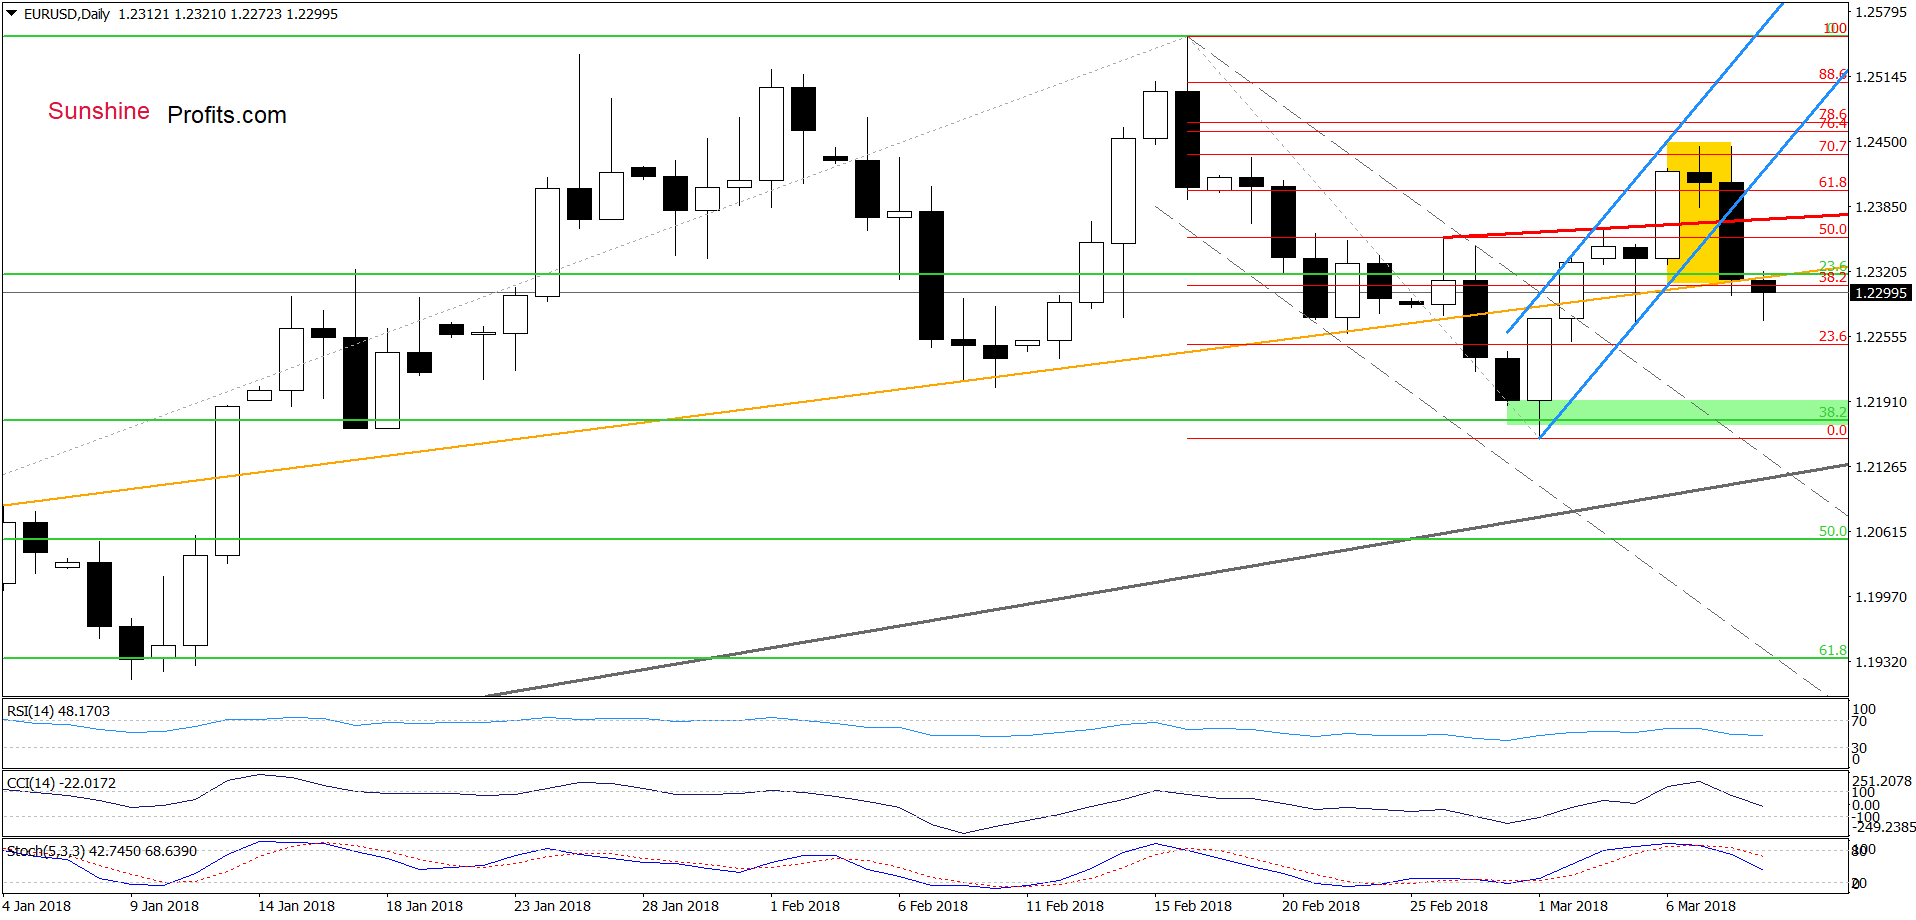
Looking at the daily chart, we see that although currency bulls pushed EUR/USD a bit higher yesterday, they failed around Wednesday’s high, which resulted in a sharp decline. Thanks to this move, the exchange rate not only dropped below the previously-broken lower border of the blue rising trend channel, but also under the neck line of the reverse head and shoulders formation (the red resistance line marked on the above chart).
This bearish development triggered further deterioration, which took the pair to the orange support line – similarly to what we saw a month ago. Although the exchange rate closed yesterday’s session above this line, currency bears pushed EUR/USD below it earlier today. Additionally, the sell signals generated by the indicators remain in place, suggesting further deterioration.
Nevertheless, the euro’s reaction to today's positive U.S. data is surprisingly weak, which raises some doubts about the legitimacy of opening short positions. Therefore, we decided to wait at the sidelines for today’s closing price, because it seems to us that we could see an unexpected move to the upside first and an attempt to create the right shoulder of the pro-bearish formation.
Trading position (short-term; our opinion): no positions are justified from the risk/reward perspective now. We will keep you informed should anything change, or should we see a confirmation/invalidation of the above.
USD/CAD – Too Weak Bulls
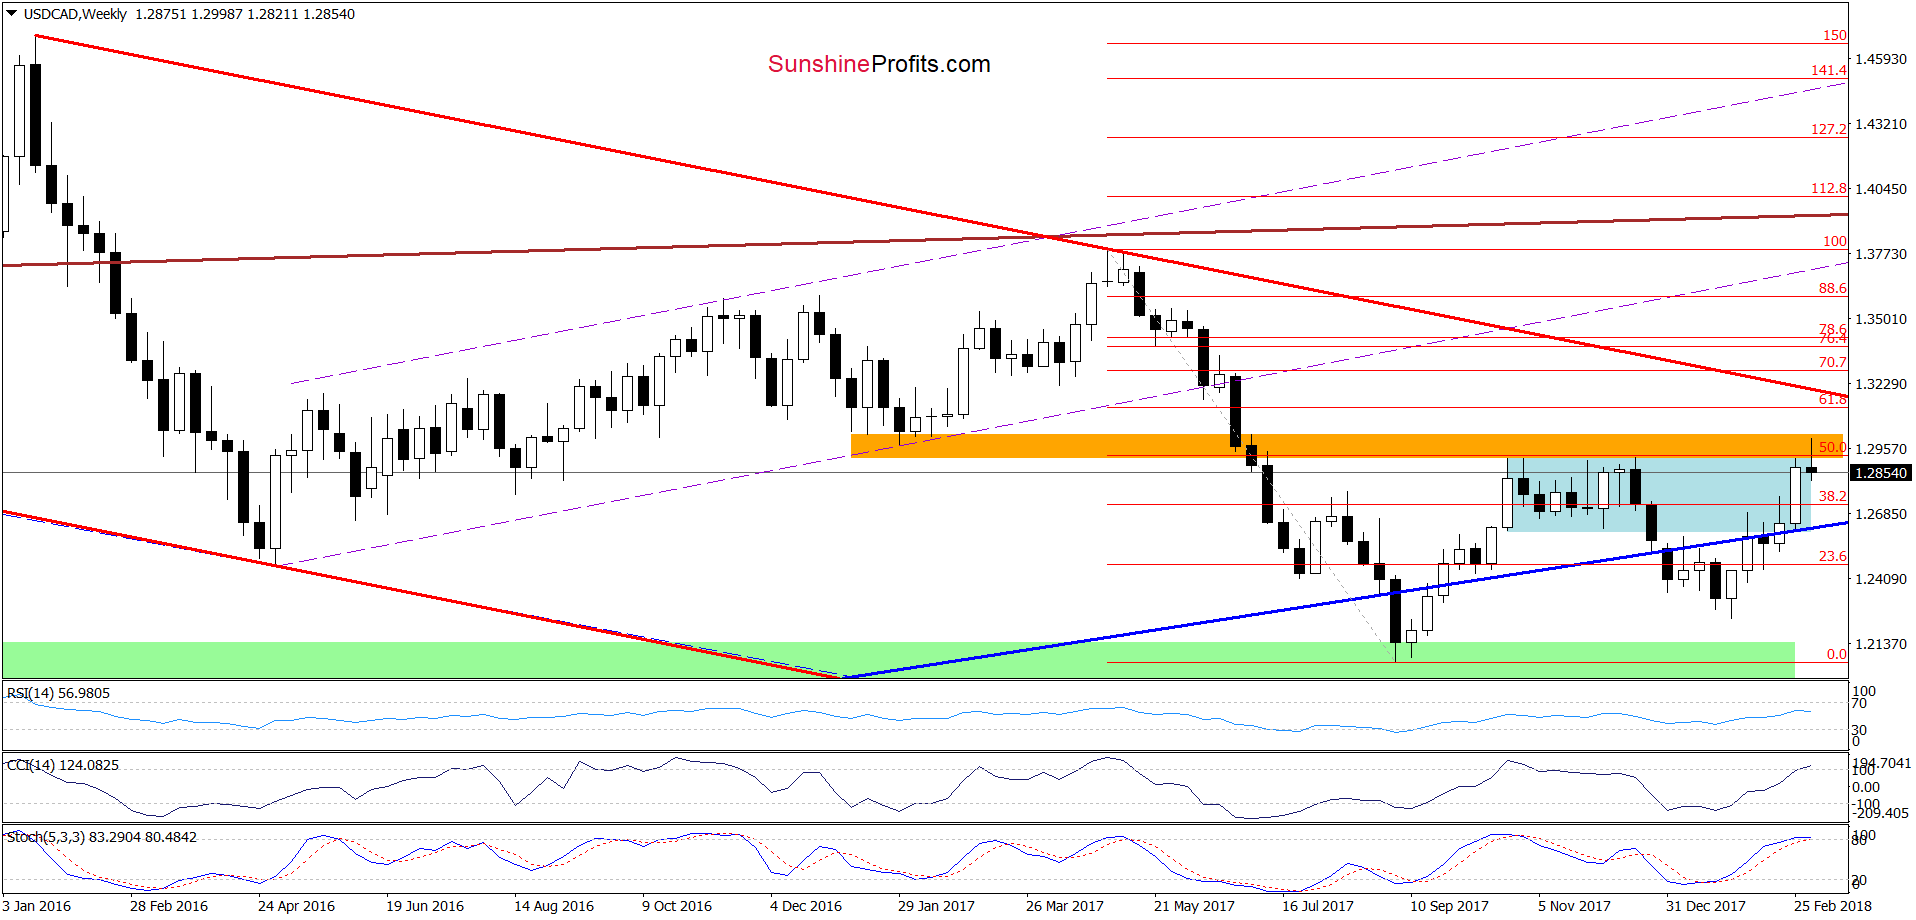
In our Forex Trading Alert posted on Monday, we wrote:
(…) currency bulls pushed USD/CAD higher (as we had expected) and the pair reached the orange resistance zone once again. As you see on the medium-term chart, this area was strong enough to stop further improvement in October, November and December 2017, which suggests that we could see a similar reversal from here in the very near future – especially when we factor in the current position of the weekly and daily indicators (they climbed to their overbought areas, increasing the likelihood of generating sell signals.
From today’s point of view, we see that the situation developed in line with the above scenario as currency bulls failed to pushed USD/CAD higher. Although the exchange rate climbed above the October, November and December peaks, this improvement was only temporary, and the pair came back below this area, invalidating also the earlier tiny breakout above the 50% Fibonacci retracement, which doesn’t bode well for currency bulls.
What impact did this move have on the daily chart? Let’s take a look.
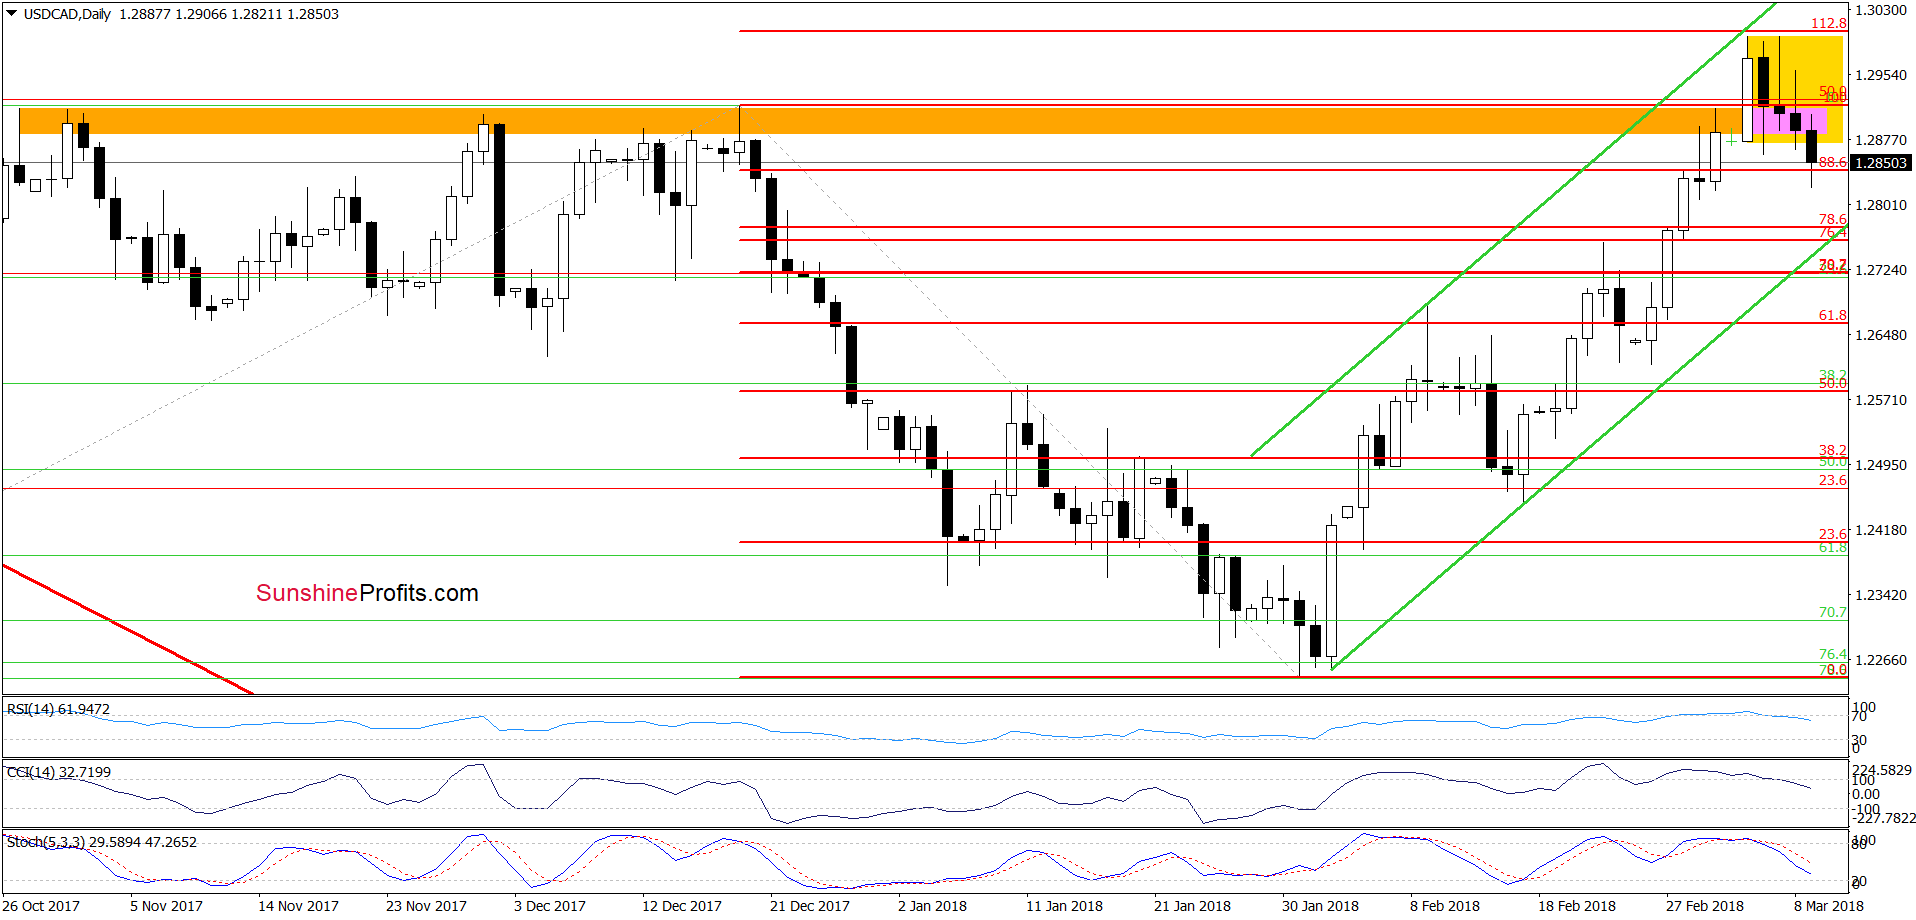
Looking at the above charts, we see that the recent increase approached USD/CAD to the upper border of the green rising trend channel and the 112.8% Fibonacci extension. This resistance area encouraged currency bears to act, which resulted in a pullback and a breakdown under the lower border of the yellow consolidation earlier today.
Taking this bearish signal into account and combining it with the medium-term picture and the sell signals generated by the daily indicators, we think that the pair will extend losses and test the lower line of the trend channel in the coming days.
Trading position (short-term; our opinion): No positions are justified from the risk/reward perspective now. We will keep you informed should anything change, or should we see a confirmation/invalidation of the above.
USD/CHF vs. Resistances
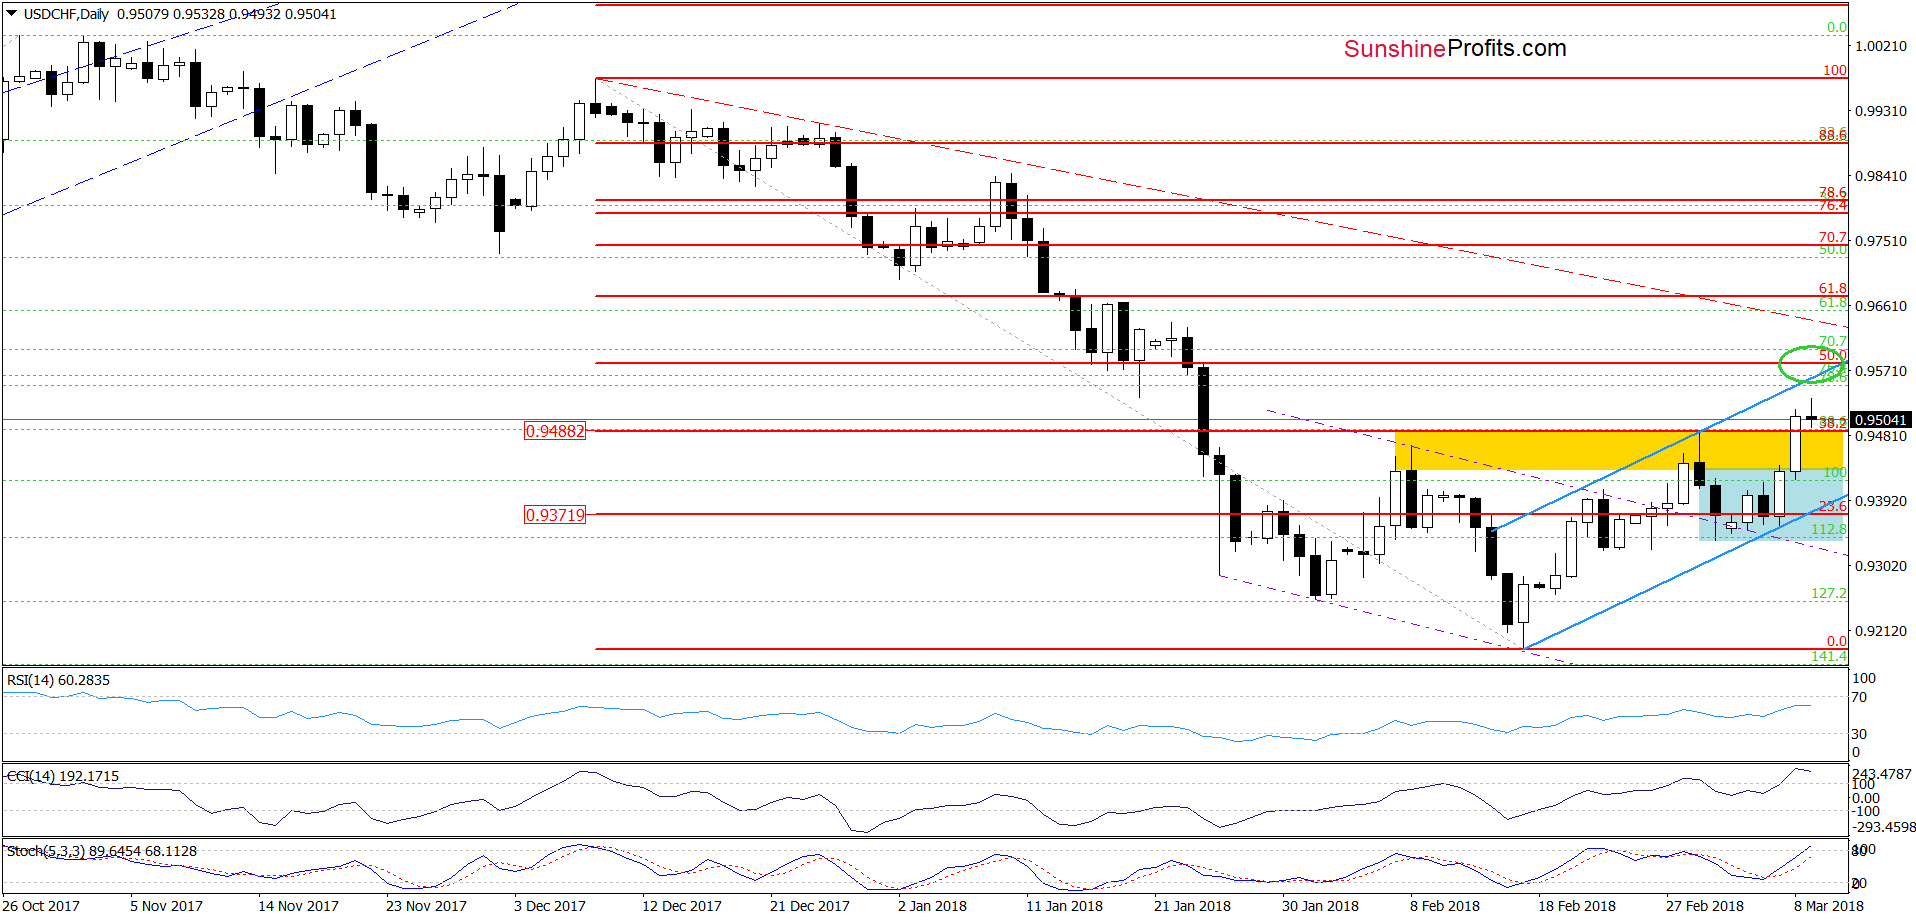
Looking at the daily chart, we see that the situation in the very short term improved in recent days as USD/CHF broke not only above the upper line of the blue consolidation, but also hit a fresh multi-week high, breaking above the 38.2% Fibonacci retracement and the yellow resistance zone.
What’s next for the exchange rate? Taking into account the fact that buy signals generated by the indicators remain in the cards, it seems that we could see a test if the upper line of the blue rising wedge and the 50% Fibonacci retracement in the coming days.
Nevertheless, when we zoom out our picture and focus on the medium-term chart, we’ll see some negative factors, which could thwart the pro-growth currency bulls’ plans.
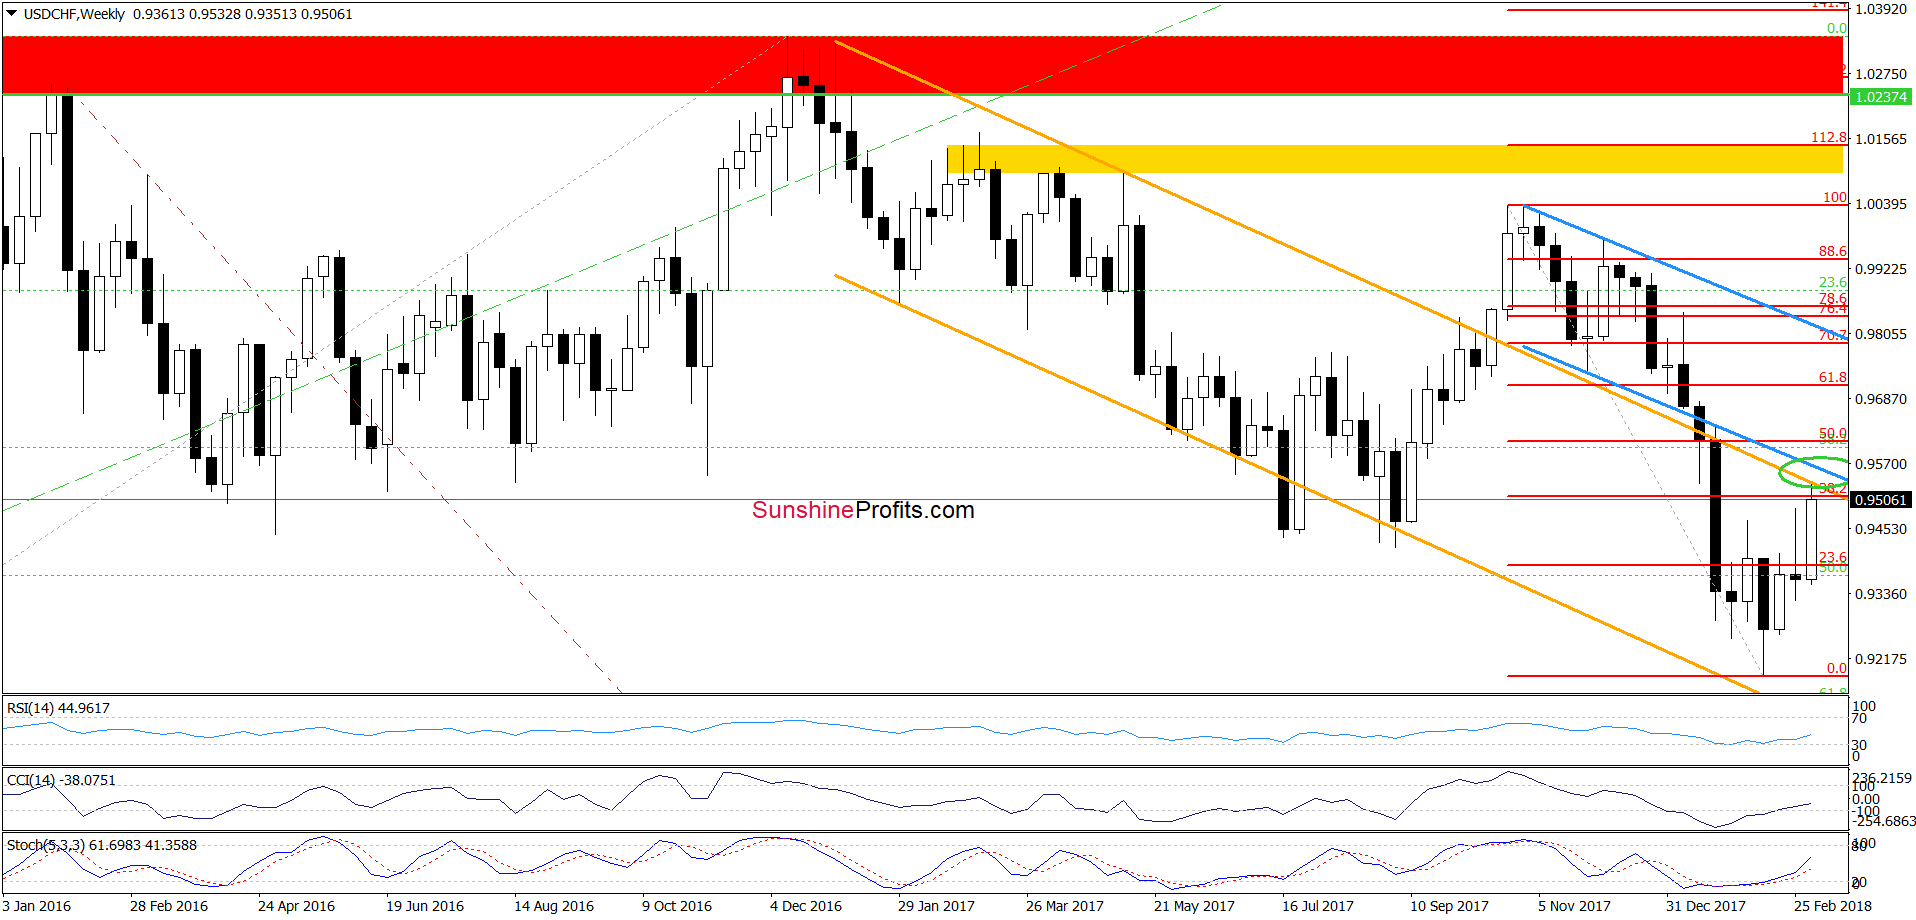
From this perspective, we see that USD/CHF climbed not only to the 38.2% Fibonacci retracement, but also to the upper line of the orange declining trend channel and approached the previously-broken lower line of the blue declining trend channel (we marked this resistance area with the green ellipse), which could pause or even stop further improvement.
Therefore, similarly to what we wrote in the case of EUR/USD, it seems to us that waiting at the sidelines until the end of the session is justified from the risk/reward perspective at the moment of writing these words.
Trading position (short-term; our opinion): No positions are justified from the risk/reward perspective. We will keep you informed should anything change, or should we see a confirmation/invalidation of the above.
Thank you.
Nadia Simmons
Forex & Oil Trading Strategist
Przemyslaw Radomski, CFA
Founder, Editor-in-chief, Gold & Silver Fund Manager
Gold & Silver Trading Alerts
Forex Trading Alerts
Oil Investment Updates
Oil Trading Alerts


