Based on the October 21st, 2011 Premium Update. Visit our archives for more gold & silver articles.
A recent International Monetary Fund report estimates that China exports more inflation to the developing countries than had been previously assumed. For every 1 percentage increase in Chinese inflation, the increase in Asia-Pacific countries is 0.25-0.5 percent. The report argues that the real danger for regional inflation is an up-tick in Chinese output driving commodity prices up. It notes that a 1 percent increase in Chinese output can raise global commodity price inflation by about 5 percent and that the Asian-Pacific region is especially vulnerable to commodity price increases since food and energy compose a sizable proportion of average daily spending.
Chinas strategy to build up an enormous export-led growth engine has been to use low wages and to keep its currency cheap. Experts estimate that the Chinese yuan is 40% undervalued, making Chinese products artificially cheap. China has also used its huge market to lure Western companies to transfer their next-generation technology to China. Goods are as much copied in China as made in China. Many Chinese realize that it is time to change that template but that will be difficult as long as Chinas entire system stifles creativity by putting emphasis on rote learning rather than innovation.
The U.S. Senate has recently voted for the Currency Exchange Rate Oversight Reform Act of 2011, which would allow the US to punish any country that manipulates its currency with special duties and import tariffs. The bill is targeted at China, even though it doesnt mention any country specifically. It is unlikely that the bill will pass the House. Even if it does, it is not likely that such a bill will persuade Beijing to change and it could ignite a trade war. It has already provoked a strong response from China. Beijing describes it as trade protectionism, condemning the bill as a serious violation of World Trade Organization rules and a ticking time-bomb that could ignite a trade war.
America has to get used to the idea that it will never get those labor intensive assembly jobs back. The differences in wage are too large, regardless of what China does with the yuan.
Keep in mind that China is the worlds largest holder of American debt. Or, as "Late Night" talk show host, David Letterman, said recently: "Two things you need to know about taxes. They've extended the deadline to April 18, and when you write your check, just make it out to China."
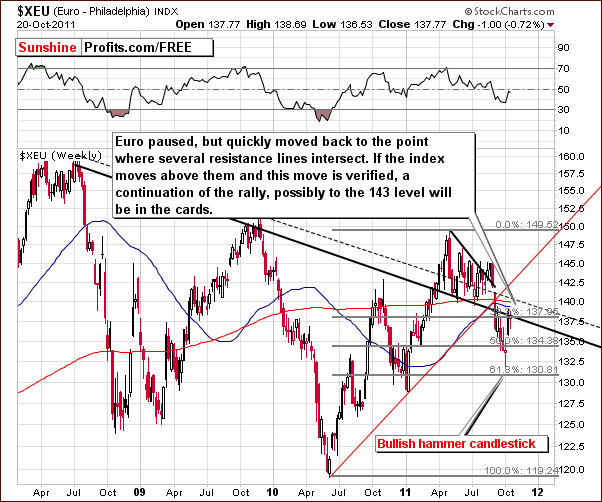
Having said so much about currencies, lets not delay any longer and lets turn to this weeks technical part with the analysis of currency markets. We will start with the long-term Euro Index chart (charts courtesy by http://stockcharts.com.)

In the long-term Euro Index chart, weve seen the index level bounce off the resistance line, move down to the support level and then pull back up to resistance. Now it is at the declining long-term resistance line, which coincides with the 61.8% Fibonacci retracement level (it moved only slightly higher since we created the above chart). These two lines now coincide and this likely helped keep the index from bigger rally this week.
If the index manages to move above the resistance level and hold for three days, the breakout will likely lead to even higher index levels with a target around 143. Its possible that the euro could rally even more. Clearly, the situation is currently tense. A decline from here would confirm the breakdown and a move higher would invalidate the breakdown. As is often the case, time will tell all and what eventually happens will be a key determining factor for the subsequent direction of the currency markets.
On a side note, please keep this chart in mind when you hear talk about technical analysis being no longer valid. The recent reversal after a bullish-hammer-candlestick-pattern coinciding precisely with the Fibonacci retracement level was no coincidence.

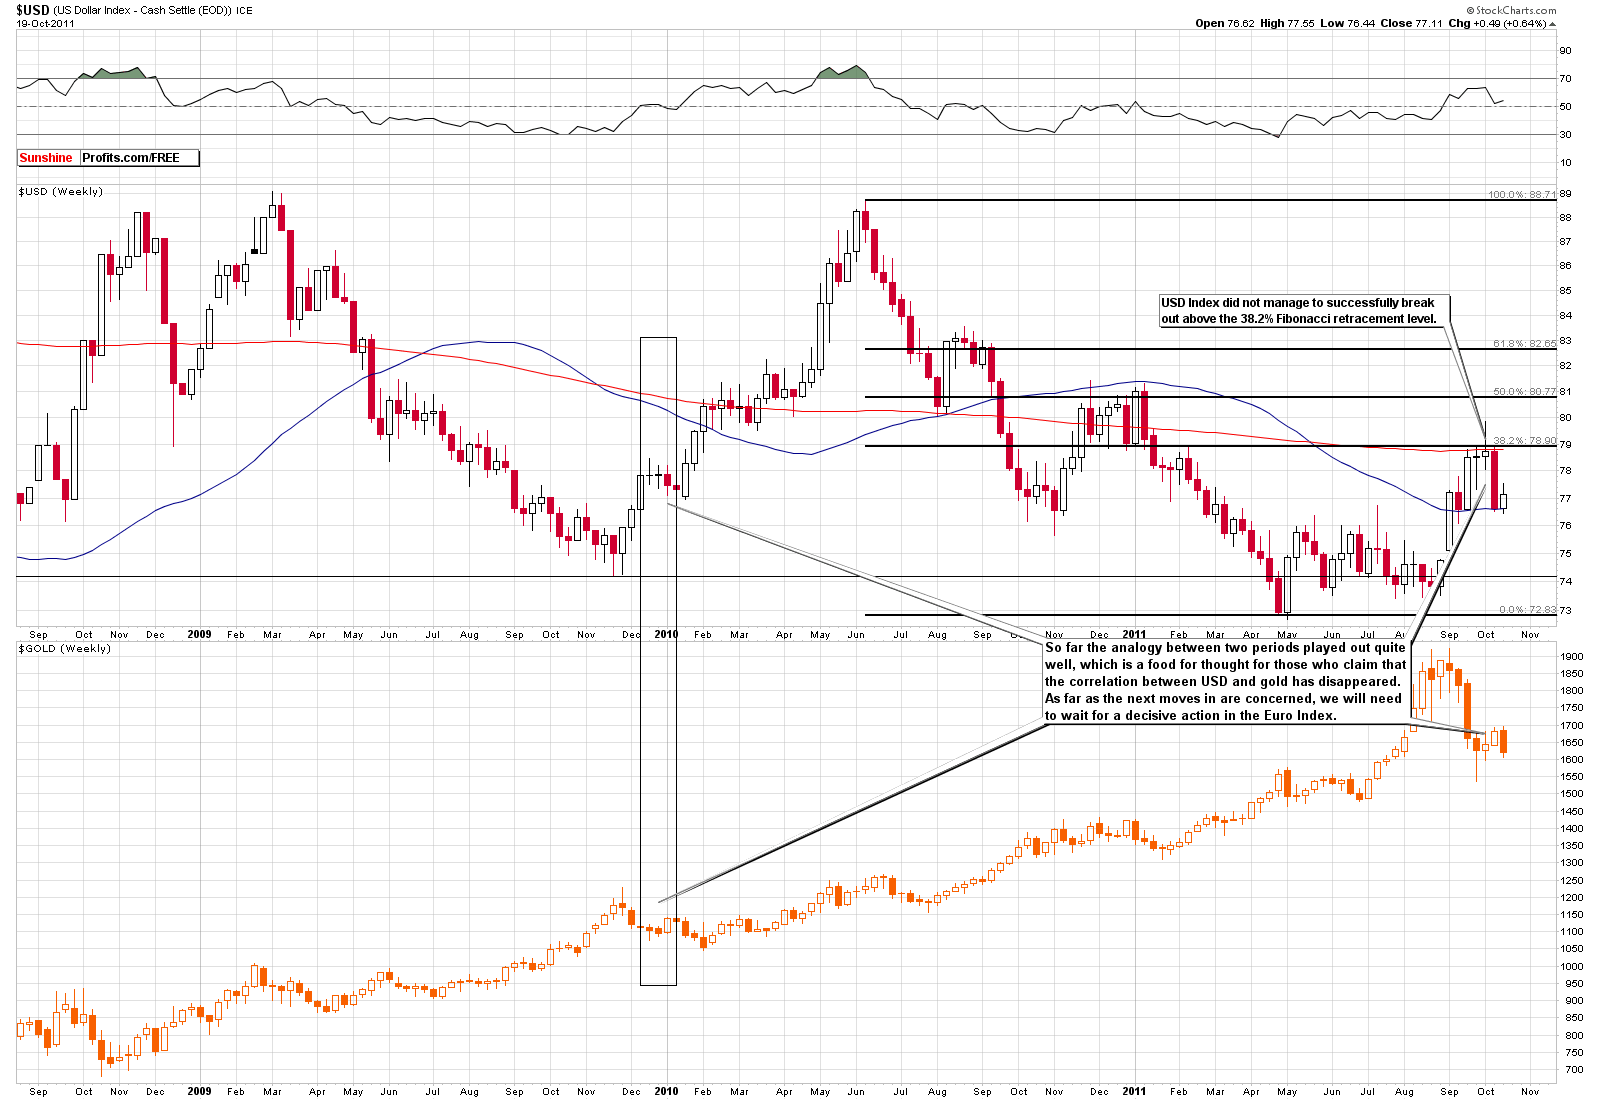
We look at the implications for the dollar and for the price of gold as we compare them side-by-side (please click the above chart to enlarge it). Here we have some food for thought for those who claim that the correlation between gold and the dollar has disappeared or is no longer applicable. The analogy between today and late 2009 played out remarkably well, as a decline in the dollar coincided with an upswing in gold's price. So where is the next move from here?
With the tense situation in the currency markets, especially with respect to the euro, the situation is quite blurry. The Eurozone tensions have diminished somewhat this week and a move higher for the euro appears to be about a 55-45 likelihood and would, of course, result in a likely decline in the USD Index.
If you recall what we wrote in our last essay on the bullish outlook for gold, you will notice that the current outlook for the USD Index confirms what we wrote then:
We are inclined to think that were relatively close to an upswing in gold. The point here is if a decline is seen before the upswing, it could simply be the formation of a double bottom with the rally yet to come. So a short move down did not invalidate any rally this week since the rally had not yet begun. We have simply seen a rebound after an initial bottom with a second bottom now being formed. As long as the two support levels in the $1,600 range hold, the outlook remains bullish.
Summing up, a move up in the Euro Index and a move down in the USD Index would have bullish implications for precious metals and the above-mentioned point is very much up-to-date. It fact, it seems that the precious metals market is already moving higher even without waiting for a signal from currencies, which means that if that signal comes, the rally could accelerate and our targets will be reached sooner (we will leave details for our subscribers).
Thank you for reading.
P. Radomski
--
Our most recent update includes not only up-to-date targets for gold and silver. More importantly, it provides details regarding the likely shape of the current/following move up (so far it's playing out as expected). The update includes also multiple important factors that are currently in play, including GDX:SPY ratio and 2 of our indicators that have recently flashed signals.
It's not too late to take advantage of our latest premium analysis, we suggest acting now.
So, we encourage you to join our subscribers today and get to know all above-mentioned details right away.

