Based on the March 9th, 2012 Premium Update. Visit our archives for more gold articles.
The recent precipitous plunge in precious metals was one of the biggest sell-offs in recent memory. The gold Flash Crash even prompted a serious newspaper such as the Financial Times to run a headline stating Flash Crash Rouses Suspicions of Witchcraft.
According to the Financial Times article; Apparently, someone, or, rather, two someones with proprietary trading algorithms decided it was time to sell the futures equivalent of 31 tons of gold on the Chicago Mercantile Exchange. The crash happened between 10.40am and 10.54am eastern US time, with the biggest part of the decline taking place between 10.43 and 10.44, with a further drop in the couple of minutes before 10.54.
Our comment is that even if it were two entities that ignited the downswing wasnt it the case many times in the past when only a few entities start a downswing?
Consequently, couldnt it be that simply someone had to start it because the decline was very much in the cards based on emotional (a.k.a. psychological / technical) reasons that we outlined previously? Finally, couldnt it be the case that the big entities that started the rally shared the same emotional approach that the rest of the market did?
This certainly could have been the case in fact, its quite likely that it was actually the case and thats why such unpredictable moves can be sometimes predicted (not all of them, but enough to make serious money on this phenomenon).
The bottom line of the crash is that somebody must have been happy to buy 31 million ounces of gold at a discount. The crash shook out the weak hands; the small investors and speculators who are flushed out of the market by stop loss sell orders and margin calls.
Lets keep things in perspective. The crash was insignificant in the context of golds past performance - up some 500 percent or 19 percent annually over the past ten years and 14 percent this year through Tuesday evening before the flash crash.
If the Fed tightens monetary policy will that mark the end of golds decade-long rally?
At least for now the Fed has promised to keep rates at zero until 2014, which is very bullish for the gold market. Rates are on hold and it is not likely that it is going to change.
Let's begin the technical part with the analysis of gold itself. We will start with the very long-term chart (charts courtesy by http://stockcharts.com.)

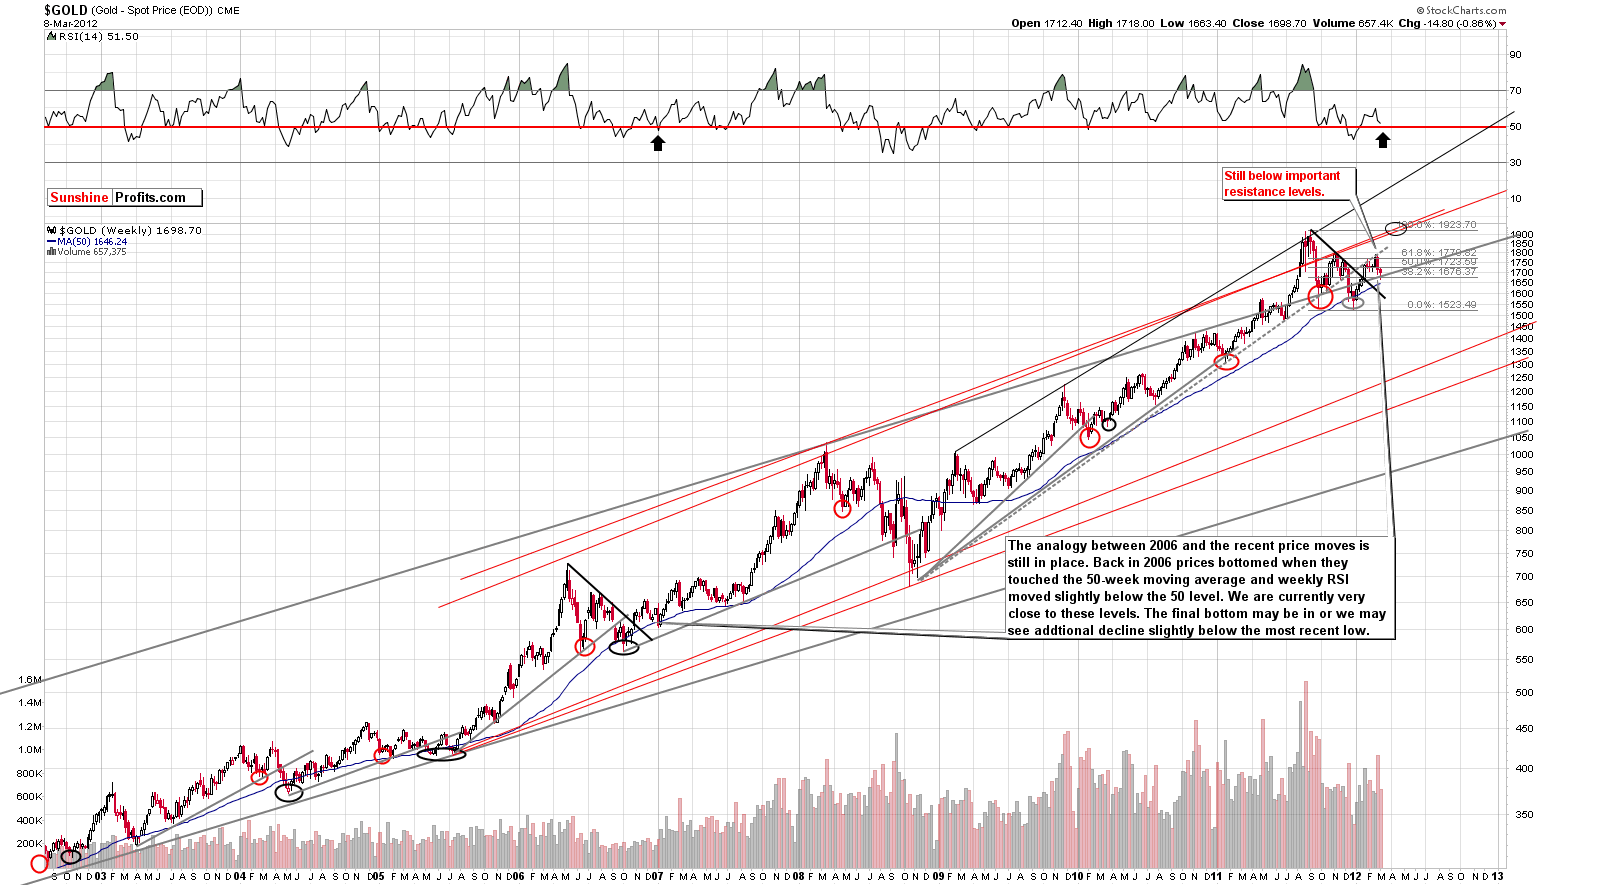
We begin with a look at the very long-term chart (you can click the chart to enlarge it if youre reading this essay on sunshineprofits.com). Last week saw several important developments as golds price decline approached the 50-week moving average while the RSI level remained slightly above the 50 level. This is a bit ambiguous with respect to what likely seemed to be needed for the final bottom to form.
It seems that the moves may be close enough to the final bottom if, in fact, its not already in. The risk of being out of the market appears to outweigh the risk of being in the market at this time, as the downside is limited and upside is huge. Even with the ambiguities in the trading patterns, we view the situation as bullish.

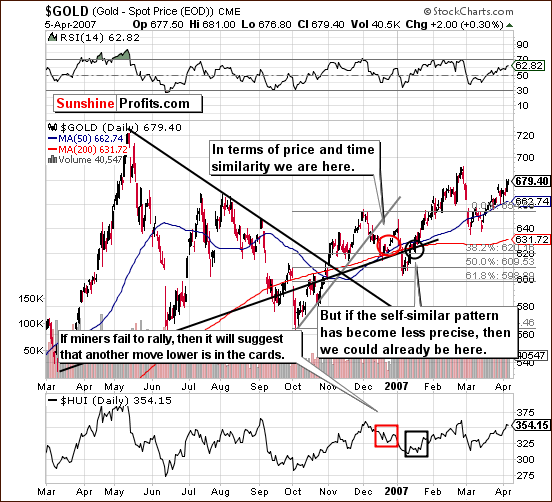
Looking back to golds 2006-07 chart, we have the most interesting analysis of todays essay. We have attempted here to show how the trading patterns of gold in 2006 (red and black ellipses) may correspond to the upswings in todays market. At this time, it seems that we are behind the one reflected by the red ellipse and about to see the second one. Please note that gold moved to the area between 50% and 61.8% Fibonacci retracement levels before finally bottoming.
Consequently, as of March 14th, the final bottom may already be in (or be in very shortly).

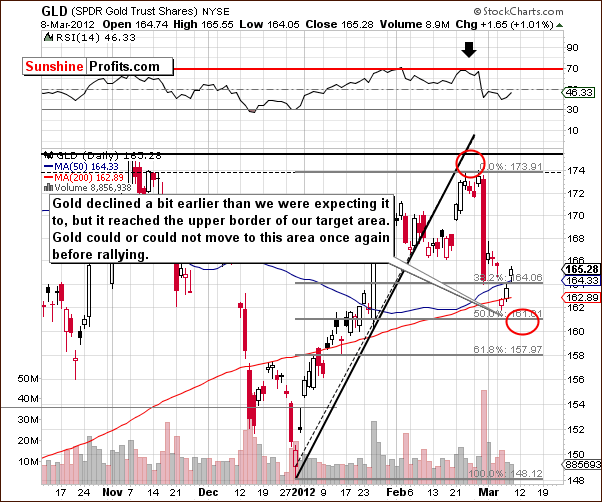
A few days ago (at the above charts cut-off point) we wrote that it seemed at first glance that the downside target level was not yet reached. It is important to note, however, that the upper border of this target level was in fact reached a few days earlier than expected. It appeared that this should be viewed as the bottom being in with the only question being is it a local or final bottom? It was too early to answer this with certainty, but based on todays price action, it seems that gold is now very close to its final bottom for this decline.
The points made above are confirmed by our SP Gold Bottom Indicator,which flashed a long-term buy signal last Tuesday. We analyzed its indication in details in our previous essay on the possibility of a move up in the precious metals market:
( ) on Tuesday, ourSP Gold Bottom Indicatorflashed a long-term buy signal. The indicator is just one of the unique proprietary investment tools developed by Sunshine Profits, available only to our subscribers. We tend to take this particular signal seriously since it has proved to be uncannily accurate in the past.
Summing up, while it is not yet certain that the final bottom is in, it seems rather unimportant because golds price does not seem likely to decline much further and could actually move much higher very soon. The risk of being out of the market outweighs the risk of being in.
To make sure that you are notified once the new features are implemented, and get immediate access to my free thoughts on the market, including information not available publicly, we urge you to sign up for our free e-mail list. Sign up for our gold & silver mailing list today and you'll also get free, 7-day access to the Premium Sections on my website, including valuable tools and charts dedicated to serious PM Investors and Speculators. It's free and you may unsubscribe at any time.
Thank you for reading. Have a great weekend and profitable week!
P. Radomski
--
Earlier today, we've sent out a Market Alert with suggested actions for short-term traders and long-term investors and our most recent Premium Update Includes upside targets for gold, silver and mining stocks along with probability that they will be reached within the next 3 months.
We encourage you to Subscribe to the Premium Service today and read the full version of this week's analysis right away.

