Based on the March 16th, 2012 Premium Update. Visit our archives for more gold & silver articles.
The roller coaster metaphor we used two weeks ago after the $90 flash crash in the price of gold seems appropriate this week as well. It must be tough out there for precious metals investors. Wednesday gold futures tumbled again. April-delivery gold fell $51.30, or three per cent, to settle at $1,642.90 an ounce, the lowest gold settlement price in more than eight weeks. The dollar strengthened and traders reacted to the U.S. Federal Reserves rate decision and policy statement in the previous session, which buried any hopes for now of more monetary easing in the short term. Investors have been hoping that the Fed would take action again to spur the economy. The last round of quantitative easing, known as QE2, weakened the US dollar and sent gold prices sharply higher. After the market closed Tuesday, the Fed's upbeat comments about the US labor market dimmed hopes of further stimulus. Also Tuesday afternoon J.P. Morgan announced it had passed the governments stress testing and was declaring a dividend as well as paying back a big chunk of government loans. Most of the largest U.S. banks passed their annual stress test, underscoring the recovery of the U.S. financial sector. The U.S. dollar index traded higher Wednesday, hitting a fresh seven-week high, also bearish for the precious metals markets. Year to date, gold is still up 5 percent.
Sunshine Profits subscribers should have a much less queasy stomach. A day before the flash crash we sent out a Market Alert to stay out of the speculative long-term positions saving them from the gut-wrenching drop. And when we sent out another Market Alert with a buy signal on March 6th it was with a caveat to be prepared emotionally for the scenario in which metals move temporarily lower for a few days and then form a bottom. We believe the price action of the past few days could be that the final bottom for this decline has already been reached, or, is very, very close to it.
Gold's sharp move lower will most likely spark demand from emerging markets such as India and China as buyers will come in lured by lower prices.
Interestingly, platinum out-performed gold and maintained a premium over gold for the first time since September, reverting back to the norm where historically (for the past 20 years) platinum trades higher than gold. Happily, we had previously suggested you to switch part of your holdings from gold to platinum.
To see if gold will be able to catch up, lets move to the technical part of todays essay. We start with the USD Index chart (charts courtesy by http://stockcharts.com.)

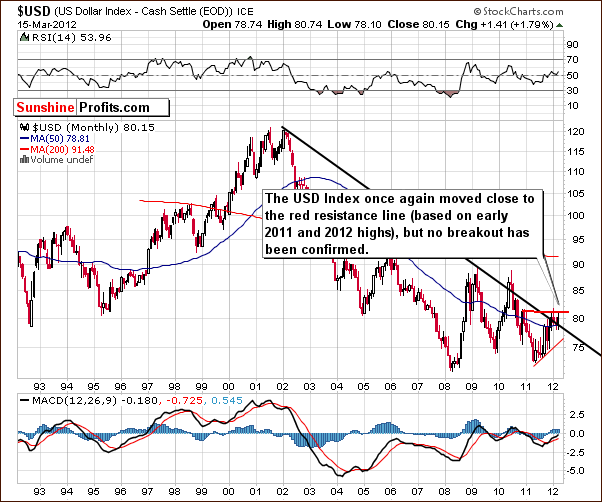
Our first chart this week is the very long-term USD Index chart. There have been some slight changes this week as the index level has touched the horizontal red line in our chart created by the early 2011 and 2012 highs. Prices then reversed and no breakout above this level was seen.
Concerning the long-term declining resistance line, prices have moved just above it but the breakout is not yet truly in. Prices would have to close the week and hold above this line for two more weeks for this breakout to be confirmed. Overall, the situation remains mixed here.

In the short-term USD Index chart, a correction is seen to the highest Fibonacci retracement level of the previous decline. It appears that a top is about to form. Prices could move a bit higher, though any significant increase seems unlikely, and the 2012 high will probably not be reached. Perhaps some sideways trading and then some declines will precede the next cyclical turning point, which is about two weeks away.

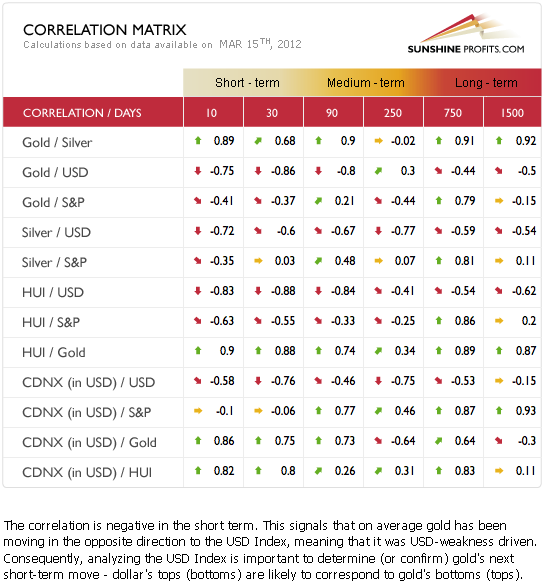
The Correlation Matrix is a tool, which we have developed to analyze the impact of the currency markets and the general stock market upon the precious metals sector. The correlation between the general stock market and precious metals now appears to be negative to neutral, and this is generally not the case, especially given the past three months.
The general stock market simply does not appear too important for gold, silver and the gold and silver mining stocks. However, it does seem to matter for platinum, which has performed relatively well compared to the other metals.
The strong negative correlations between the USD Index and the precious metals continue. The implications appear bullish for the medium term and somewhat unclear for the short term.
The medium term implications remain in line with our overall view on the precious metals sector as expressed in our essay on a possible rally in gold. We wrote then (March 14th, 2012):
( ) while it is not yet certain that the final bottom is in, it seems rather unimportant because golds price does not seem likely to decline much further and could actually move much higher very soon. The risk of being out of the market outweighs the risk of being in.
This week we have also received an interesting question from one of our Subscribers and would like to comment on it.
Q: Regardless of the self-similarity patterns [that were described in the previous essay] (which is not the most scientific tool out there), is there any chance that we currently see the beginning of the situation similar to what was seen in Sep-Dec 2011?
Additionally, what about the price seasonality? March-April is generally weak for the precious metals Maybe the predicted rally will materialize so sooner than in April-May during metals stronger months?
A: Naturally, self-similar patterns (just like any other chart pattern) are not scientific at all (but we are working on making them scientific, stay tuned) as they are not (as Karl Popper indicated) falsifiable. They are subjective and very much analyst-dependent and detecting these patterns is somewhere between art and science. However, thats not the most important thing here. The most important thing in our view is simply that they work and are extremely useful as they provide both: price and time projections that if previous patterns are really aligned play out very well.
Is there any chance that gold will move even lower like in Dec 2011? Of course there are no sure bets. However, at this time we view the chance of moving higher from here is much bigger than the chance of a continuation of the decline.
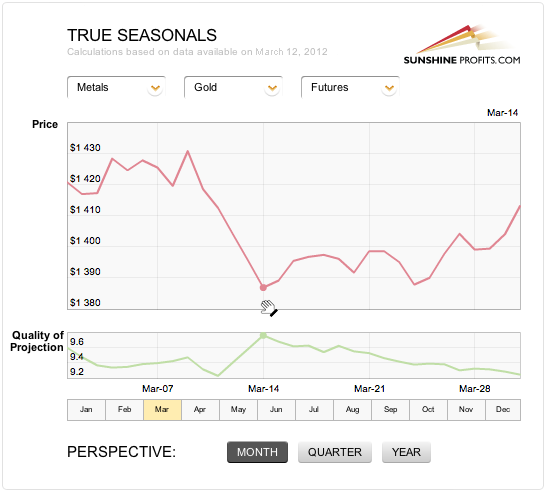
Seasonality a picture can tell a thousand words, so lets take a look.

Please focus on the shape of the red line vs. dates instead of the prices on the vertical axis legend (technical glitch). While it is true that March is generally a weak month for metals, please note that the weakness is concentrated in the first half of the month and this impacts the whole March-April period. In fact, April is moderately favorable month.
The most interesting part is that according to the True Seasonal (taking into account options and futures expirations as well as simple seasonalities) pattern, the bottom was likely to be seen on March 14th Precisely when gold appears to have reached the bottom. Please note that the quality of projection measure on the chart is quite high for this date, meaning that the probability of bottom being in close to this date is high.
Summing up, the situation in the USD Index is unclear for the short term and bearish for the medium term. This translates into a bullish environment for gold for the medium term and the True Seasonal patterns confirm that.
To make sure that you are notified once the new features are implemented, and get immediate access to my free thoughts on the market, including information not available publicly, we urge you to sign up for our free e-mail list. Sign up for our gold & silver mailing list today and you'll also get free, 7-day access to the Premium Sections on my website, including valuable tools and charts dedicated to serious PM Investors and Speculators. It's free and you may unsubscribe at any time.
Thank you for reading. Have a great weekend and profitable week!
P. Radomski
--
The precious metals market moved lower recently, and we received a lot of question this week. Consequently, we're providing you with detailed analysis of the precious metals market. Once again, gold appears to be the key to the whole sector. The questions that we replied to include ones about: manipulation in the gold and silver markets, our proprietary indicators, how to bet on the coming move in gold, AAPL:GLD ratio, candlestick patterns, and other important issues.
Meanwhile, platinum is once again more expensive than gold - we explain if it's still safe to enter the platinum market and which ETF one could use. Additionally, we comment on the possibility of gold confiscation. Naturally, we provide our targets for gold, silver and mining stocks and our opinion on the probability of moving higher. Plus, we comment on one of our most important indicators have has just flashed a signal.
We encourage you to Subscribe to the Premium Service today and read the full version of this week's analysis right away.

