
Visit our archives for more gold & silver articles.
Lately, gold has been a disappointment to many investors while it has been mostly treading water. Gold has traded well beneath its all-time high of $1,924 an ounce on September 6th and well above its subsequent low near $1,520 which took place in late December. Many anticipated higher prices this year,but the year isn’t over yet, and neither is gold's long-term spectacular, secular bull market. We are now in one of those periods of consolidation that tries the souls of gold investors, tests their resolve and challenges their staying power. This is when the market takes a breather and adjusts to prepare for the next major move.
If you need some encouraging news, according to the latest IMF statistics, at least 12 countries are known to have increased their gold reserves in March continuing a trend that goes back more than two years. Overall Central Banks appear to have purchased about 58 tons in the month, which suggests acceleration in their gold accumulation. The significant purchases were by Mexico, which increased its holdings by 16.81 tons; Russia with purchases of 16.55 tons and Turkey with 11.48 tons. The statistics only show the figures for those nations which are transparent in their reporting.In the past there have been some sharp ‘upwards adjustments,' to gold reserves notably from China, which seems to like to accumulate its gold on the quiet. Last year Central Banks that do report their statistics bought 439.7 tons of gold and many gold analysts are predicting similar levels of purchases in 2012. And to think that years ago investors feared that the bull market will end a long time ago because of massive sales of gold by governments and monetary authorities over the world…
Analyzing the fundamental situation and news is important, but the analysis would be incomplete without referring to charts. In today’s essay, we will focus on the long-term charts of USD Index and S&P 500 and then briefly discuss the impact that they can have on the gold market.
Let’s begin with the analysis of the US Dollar Index (charts courtesy by http://stockcharts.com.)
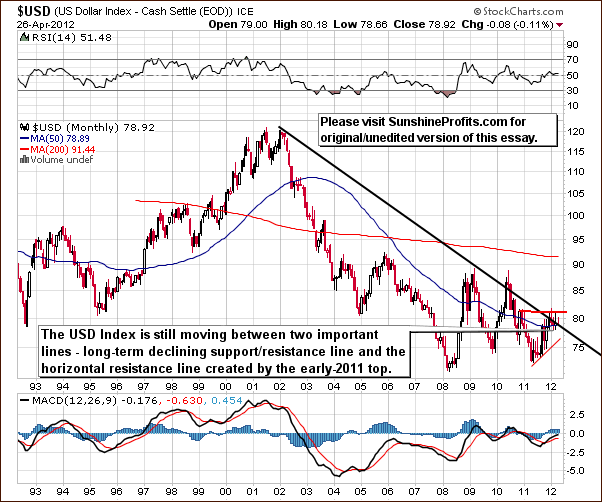
On the above chart we see that the sideways trading patterns continue between the two levels which are quite important from a technical perspective. These are the declining long-term support line and the horizontal support line based on the early 2011 high. At this point, the very-long term chart remains mixed with a bearish bias (after all, the prevailing trend is down).
To illustrate how small the trading range has been for the USD Index recently, the past six Premium Updates have found the change from the previous week to be as follows: down .41, down .61, up .95, down .79, up .25, and down .39. So nearly every week saw a change of less than 1% for the index value of a week earlier, and with the good mix of ups and downs, this is a prime example of true sideways trading.
Still, with the main trend being down, the odds are that the next significant move will take the USD Index lower, not higher.
Having said that, let’s take a look at the general stock market.
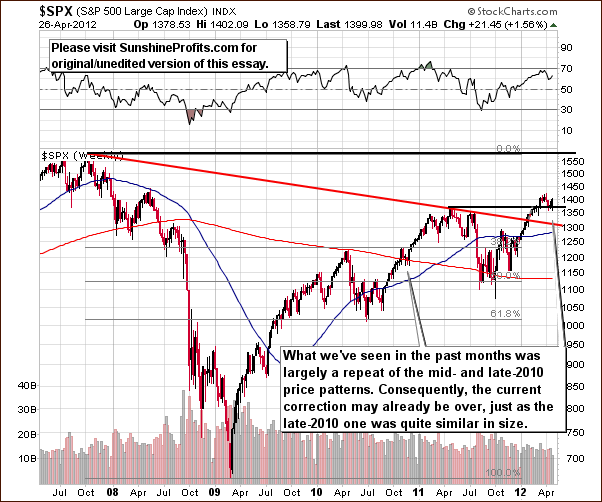
From the long-term perspective, the bottom in the S&P 500 Index appears to be in. The support line based on previous highs has been reached and crossed but the breakdown failed. Prices bounced higher soon after reaching this line (based on 2011 high), and the long-term picture is bullish based on this development.
The Correlation Matrix is a tool, which we have developed to analyze the impact of the currency markets and the general stock market upon the precious metals sector. Let’s see how the above can translate into future price moves of gold.
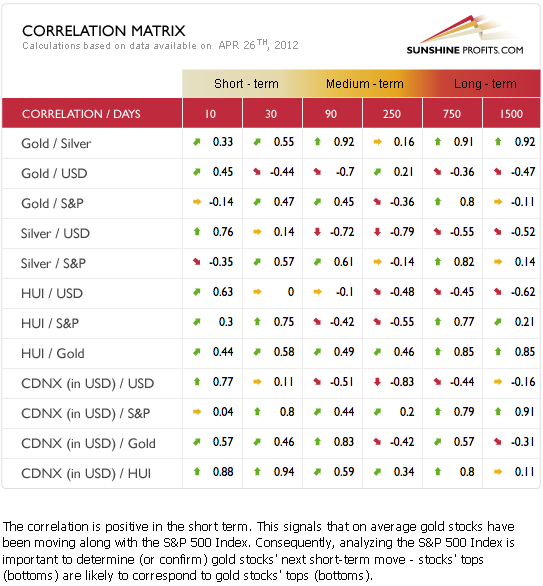
Since we are discussing the long-term impact, please focus on the 1500-trading-day column. The values of correlation coefficients are negative in terms of the relationship between precious metals (gold, silver, mining stocks) and the USD Index and they are mixed as far as metals-stocks link is concerned. Consequently, the rather negative long-term situation in the USD Index is what we should focus on and since its relationship is inverse, we can infer that the long-term picture for gold is indeed bullish.
Summing up, both: fundamental and (indirect) technical factors provides with a bullish long-term outlook for the gold market. As far as short-term is concerned and whether the consolidation is over or not is a different matter and other factors (not mentioned above) must be taken into account.
Thank you for reading. Have a great weekend and profitable week!
P. Radomski
--
This week was very volatile (especially for silver and mining stock investors) but the way prices moved tells us where they are likely headed next. Significant volume makes this short-term analysis more reliable. The 50-day MA crossed the 200-day one, and a "death cross" emerged as a result. In today's Premium Update we discuss its implications for gold investors and traders and let you know what action one should take. The analysis of gold-to-bonds ratio, gold price in yen, and gold from the non-USD perspective provide us with additional details.
Gold's "little brother" declined heavily earlier this week - is silver still likely to move above its previous 2012 high ($37) anytime soon? In today's issue we analyze both: long- and short-term silver charts in order to provide you with an answer to this important question. The situation in mining stocks is still critical and consequently we once again provide in-depth coverage of this sector.
Additionally, we comment on the predictions of 90 in USD Index and $1,350 in gold and we provide "head for the hills" numbers - if gold reaches one of them, it might be a good idea to even sell one's long-term investments. We encourage you to join our subscribers today and read the full version of this week's analysis right away.
