Based on the August 19th, 2011 Premium Update. Visit our archives for more gold & silver articles.
Nowadays one can safely say that gold has come around full circle, its shine untarnished by the passing years as it has reclaimed its respected place at the heart of the financial system. The debate over a return to the gold standard has resurfaced in the last few years in a way that has not been seen in the four decades since 1971 when President Richard Nixon decided to severe the dollars ties to gold. Gold is shining brightly.
Robert Zoellick, president of the World Bank, wrote in the Financial Times opinion piece last year about a new monetary system involving a basket of currencies that should also consider employing gold as an international reference point of market expectations about inflation, deflation and future currency values Zoellick then added: Although textbooks may view gold as the old money, markets are using gold as an alternative monetary asset today.
Central banks have become significant buyers once again. World Gold Council figures show that central banks bought about 208 tons of gold in the first half of this year. There were significant purchases by Thailand, Mexico and South Korea in recent months. This comes at a time when the sovereign debt crisis in the eurozone is spiraling and the downgrading of the U.S. credit rating has sparked waves of volatility and fears of another global recession. Governments are running out of rabbits they can pull out of the hat to absorb new shocks. The recent debt ceiling debate revealed a political dysfunction that undermines U.S. status even more than the S&P decision to cut its triple-A rating.
Venezuela has found a creative way to increase its gold reserves. It just announced last week that it is planning to nationalize its gold industry. Since emerging market central banks are now only gearing up for gold buying spree, the sovereign sector might provide a solid floor for gold prices for the foreseeable future.
If the period before the "Nixon Shock" was one of the best, the decade following his announcement had one of the worst inflations of American history and the most stagnant economy since the Great Depression. The price of gold rose to $800 from $35. If you had a dollar in 1971, today it would be worth only about 18 pennies.
One of the most significant results of Nixons decision was the consequent liberalization of the financial markets which began in the 1970s picking up speed in the 1980s. This was a time of the lifting of exchange controls and the abandonment of formal restrictions on credit. The only instrument left in the arsenal of governments to control the availability of credit is now interest rates. Thats when the good times began to roll and nations and individuals began amassing debt.
Looking back in hindsight, it is possible that if not for the Nixon Shock we would have avoided the financial crisis of the past four years; or indeed the crisis after crisis that have plagued world markets. We can say for certain that the whole debate on the debt ceiling that we witnessed a few weeks ago would have never taken place.
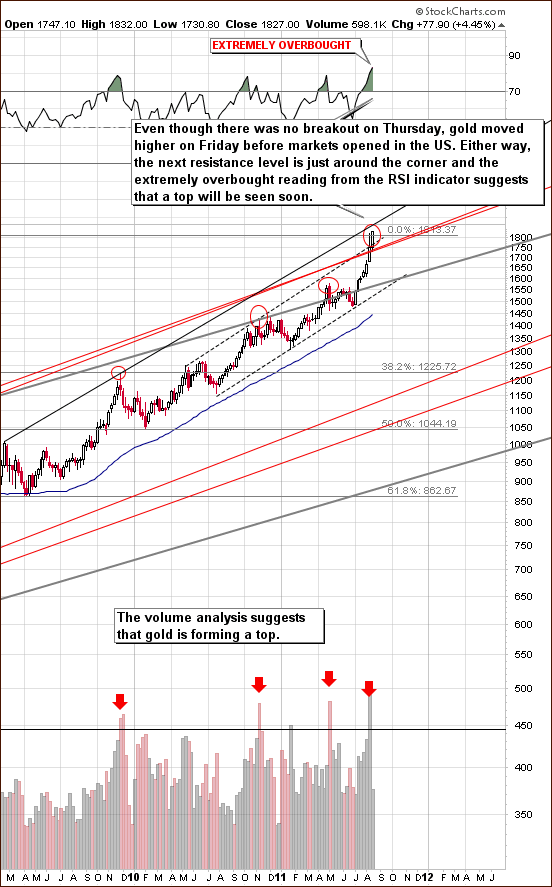
With so much information from the past, we are well equipped to deal with the future. And the future is what are technical part is particularly concentrated on. This time, we will start with the long-term gold chart (charts courtesy by http://stockcharts.com.)

In this chart we see, that the price of gold has moved above the highs that were seen last week. Gold moved very close to the $1,900 level which is a move above the previous highs. This is a breakout above the previous top; however given this weeks decline we dont think that the outlook is bullish.
The situation was extremely overbought from a short-term point of view and previous signals from volume levels are still very much in play, so the current move lower is not something unexpected. In late 2009, a local top turned out to really be a pre-top about a week before the final top was seen. This was also accompanied by significant volume levels.
On August 16th in our essay on the possible top in gold we made the following observations:
The current RSI level indicates an overbought situation and, in the past, this has usually been followed by a decline in golds price. Volume levels are also giving a similar signal. This has often coincided with local tops in the past. Normally, a quick downturn usually follows. It does seem that we are now at a local top for gold or very close to it.
The current situation on the market suggests that these remarks are very much up-to-date, despite the fact that gold has moved higher recently.

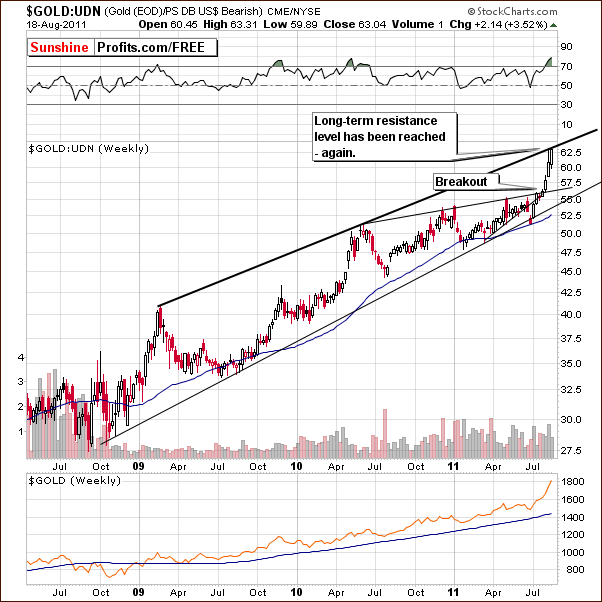
In the long-term chart for gold from a non-USD perspective, we see that golds price has once again moved to the upper border of the rising, long-term trend channel created by the February 2009 and May 2010 highs and that it has continued its move up. Whether this is a real breakout remains to been seen as the situation is quite overbought on a short-term basis with the RSI above the 80-level. Based on the current move lower, it seems that the history repeats itself once again and gold will move lower after reaching this important resistance.

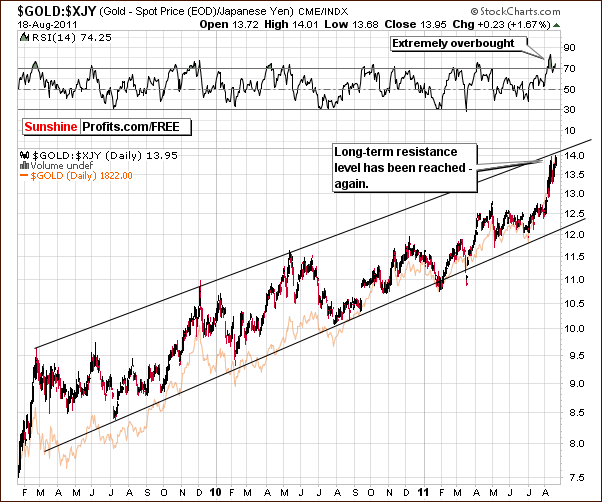
Looking at gold from the perspective of the Japanese yen, we see a situation here similar to the non-USD perspective. The index level has also reached a resistance line once again, no significant breakout has been seen and the situation is extremely overbought.
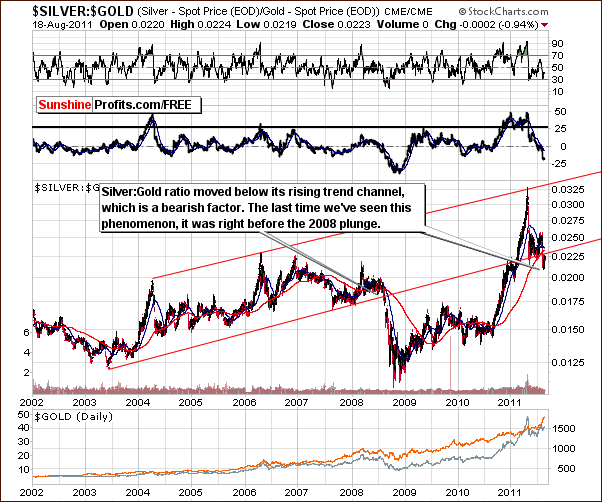
A confirmation of the doubts concerning the momentum of gold comes from the analysis of the silver:gold ratio.

In the silver to gold ratio chart, we see that the ratio is now once again below the rising trend channel in the chart, and this is generally a bearish sign. Such a situation has, in fact, only been seen once before. This was in 2008 right before prices plunged. The general stock market also declined sharply at that time (note: were not bearish on stocks at this time) and it influenced the silver to gold ratio in a negative way since silver is more closely aligned with stocks.
The ratio declines when silvers price drops more rapidly than golds on a percentage basis. This is because silvers price is in the numerator of the ratio. A significant decline in the ratio may be underway once again where silver prices could drop more rapidly than golds. It seems that extreme caution is necessary for all long speculative positions in silver or gold at this time.
Summing up, gold has likely confirmed its local (not the final one for this bull market) top recently and we believe the decline will continue.
At this point, we have somewhat ambiguous feelings towards gold. One part of us, the part that feels gold should always be part of our portfolio has been very happy with golds previous spectacular performance. On the other hand, the other part of us, the contrarian one, does not at all like what has happened recently. There has simply been too much of a push towards buying gold in the media and the fact is that no market can only look in one direction without eventually correcting.
To make sure that you are notified once the new features are implemented, and get immediate access to my free thoughts on the market, including information not available publicly, we urge you to sign up for our free e-mail list. Sign up for our gold & silver mailing list today and you'll also get free, 7-day access to the Premium Sections on my website, including valuable tools and charts dedicated to serious PM Investors and Speculators. It's free and you may unsubscribe at any time.
Thank you for reading. Have a great weekend and profitable week!
P. Radomski
--
Earlier today we have sent out a Market Alert (and posted it on the website) with direct trading suggestions and specific targets for gold, silver, and mining stocks. Our Subscribers are already profiting from the move lower. We encourage you to join us today and read the full version of today's Market Alert right away.

