Based on the October 7th, 2011 Premium Update. Visit our archives for more gold & silver articles.
The news over the last few weeks, including worries about a possible major banking crisis could cripple the Eurozone economy as a whole, has sent global financial markets down heavily. Many around the world are worried that Europe is about to face a big bankruptcy or sudden default that could set off a new phase of panic in Europe and beyond. Its been nearly two years since the euro crisis began with concerns about the solvency of Greece. Since then it has been a slow-motion drain of confidence and credibility as Europes leaders have been putting out fires one at a time.
Still, with a new (European) bailout plan ahead, the near time price movements in stocks dont have to be bearish.
The situation is more complicated in case of the precious metals market, because of multiple factors being in place right now. We will start with the analysis of gold itself (charts courtesy by http://stockcharts.com.)

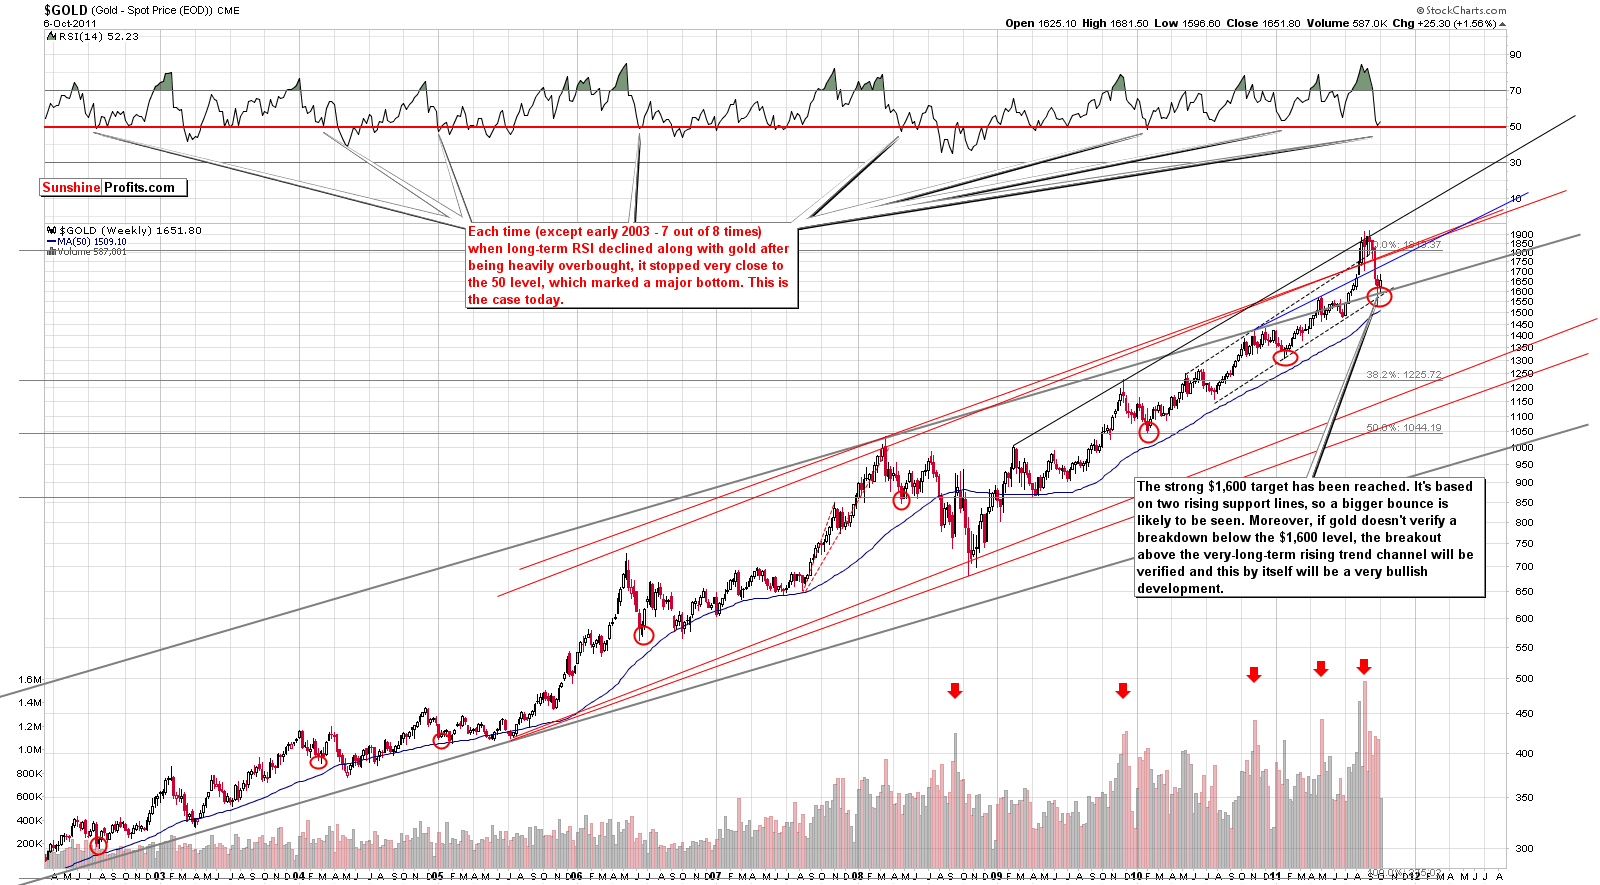
Lets take a look at the very long-term chart (if youre reading this essay on SunhineProfits.com, you can click the above chart to enlarge). Last week began with sharp declines in gold prices but the direction soon reversed and gold rallied strongly later in the week. RSI levels also moved slightly higher.
Last weeks declines tested the support level and since it held, the situation remains bullish. Actually, since there have now been verifications of this support level, the situation is slightly more bullish than it was before. Other than the decline and subsequent bounce, little else has changed in the gold market.

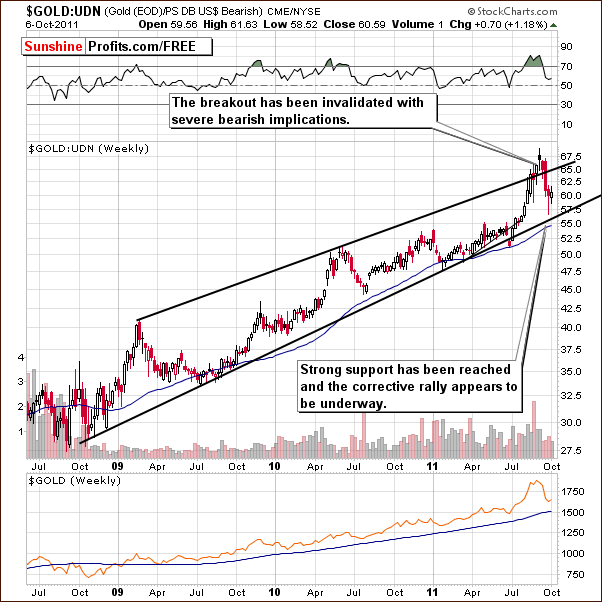
In the long-term chart for gold from a non-USD perspective, index levels did not decline significantly last week although golds price did (temporarily). This was due to the rally in the USD Index, which pretty much canceled out the decline from a non-USD perspective. The recent breakout here has been invalidated and with a strong support in place, the index is likely to rally from here.

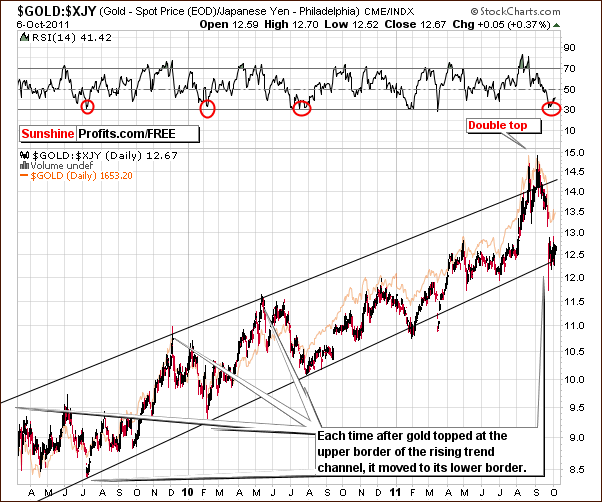
Looking at gold from the perspective of the Japanese yen, we see the usual price action along the lower border of the trading channel of the chart. It appears that a rally is ahead and the only question appears to be whether the index will move to the mid-channel range or to the upper border of the trading channel. There appears to be about a 50-50 likelihood of either move at this point.
It appears that our opinion from an essay on a possible gold rally has been confirmed to a large extent. One week ago we stated:
Looking at gold from the perspective of the Japanese yen, we also see RSI levels now oversold. Recently we have seen a decline that was much sharper than in the past. Each time the upper border of the trading channel was surpassed, index levels quickly moved to the lower border and this marked an important bottom from the USD perspective as well. Such has been the case once again, as the index moved below the lower border of the trend channel and quickly reversed. It is now right at this level. Similar price action patterns have been seen in the past and a rally generally has followed. The implications are bullish for gold.
The implications were bullish back then, and they still are given that no meaningful rally has been seen from the yen perspective yet.

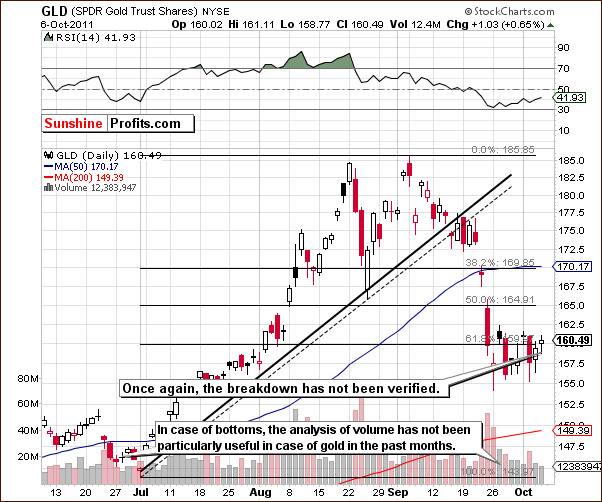
In the short-term GLD ETF chart, once again we see an invalidation of a breakdown. The price action has continued with a sharp move to and briefly below the level of the previous bottom. A quick reversal invalidated the breakdown and prices are now above the 61.8% Fibonacci retracement level. While volume levels have not been significant, this is generally not of concern near market bottoms. It is however, an important factor for local tops in the GLD ETF.
Summing up, the situation remains bullish for the yellow metal although there were some scary moments last week. It appears that we have been through a slight period of price correction and the outlook from here is bullish.
To make sure that you are notified once the new features are implemented, and get immediate access to my free thoughts on the market, including information not available publicly, we urge you to sign up for our free e-mail list. Sign up for our gold & silver mailing list today and you'll also get free, 7-day access to the Premium Sections on my website, including valuable tools and charts dedicated to serious PM Investors and Speculators. It's free and you may unsubscribe at any time.
Thank you for reading. Have a great weekend and profitable week!
P. Radomski
--
In the latest Premium Update we cover the following:
- Euro's intra-week action,
- USD cyclical tendencies and long-term trends,
- USD vs. gold
- Self-similar pattern on the general stock market,
- Financial sector
- Precious metals correlations
- Big gold chart
- Gold from the non-USD and yen perspective
- Short-term analysis of gold, silver and mining stocks
- Silver's cyclical tendencies
- Platinum
- Gold Miners Bullish Percent Index
- Future of euro
We encourage you to Subscribe to the Premium Service today and read the full version of this week's analysis right away.

