Visit our archives for more gold & silver articles.
The Hindu festival of Akshaya Tritivai is coming up this month and this is of interest for gold investors. The holiday, which falls on April 24th, is a day when Indians go on a major gold buying binge. It is one of the most auspicious occasions to buy gold, the ultimate symbol of wealth and prosperity. The timing couldn’t be better for the ending last week of the 20-day strike by India’s jewelers and gold importers who protested new government taxes on bullion. Moreover, the wedding season has already started in some parts of India and gold is an integral part of most Indian weddings. It is expected that in April and May imports will be around a 100 metric tons to India, the world’s largest consumer of gold. The nationwide strike is estimated to have cost the industry at least $3.91 billion.
According to an annual report released Wednesday by metals consultancy GFMS, gold’s speculative investors may have been shaken by gold’s volatile ride last year, but the physical market—particularly in China—remained faithful to bullion and the trend is expected to continue in 2012.
Gold bar demand and hoarding from China alone rose 40% in year- on-year in 2011 to a new record of 250 tons, according to GFMS. And this trend is likely to continue.
Demand for physical gold in the form of coins and bars grew in 2011, while Chinese appetite for gold jewelry expanded to record levels. This contrasted with a 10% drop in overall world gold investment by tonnage, amid heavy redemptions in the over-the-counter and gold futures markets as investors cashed in their gold positions amid heavy losses in other financial markets.
While investment demand dipped, 2011 was a “bumper year for physical investment,” according to a GFMS metals analyst. “Gold was clearly dependent on emerging markets’ economic strength as China’s jewelry demand grew to a record level, while India’s fell by less than 3%.”
Physical gold bar investment surged 37% last year to a new record of 1,209 tons, according to GFMS. This was driven by strong demand for physical gold as a store of value in China and India as well as “safe haven” interest from western investors, the report said.
Global gold coin fabrication rose 15.2% to 245.5, spurred mainly by strong demand in Turkey and China, said GFMS. Rising concern over inflation and the rapid hike in disposable incomes in places like China is also driving demand for physical gold, said GFMS.
Although the Hindu festival of Akshaya Tritivai is still 7 days away, let’s see if it will indeed be auspicious to buy gold during this period. Let’s turn to today’s technical part. We will start with analysis of the US Dollar Index (charts courtesy by http://stockcharts.com.)

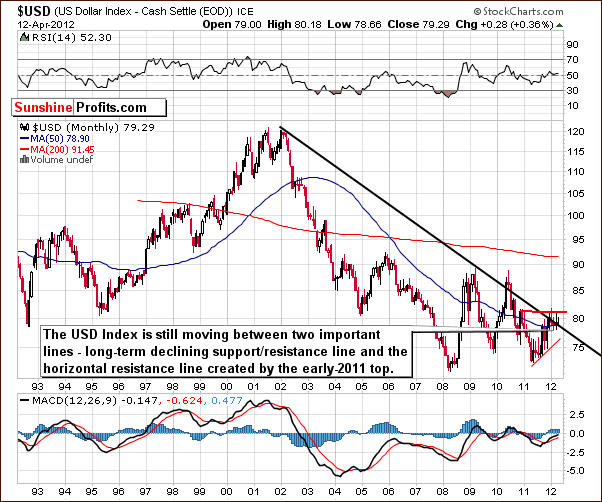
Our first chart today is the very long-term USD Index chart. Since virtually nothing changed last week, we have decided to quote from last week’s commentary:
We see that the sideways trading patterns continue between the two levels which are quite important from a technical perspective. These are the declining long-term support line and the horizontal support line based on the early 2011 high. At this point, the very-long term chart remains mixed as the USD Index moved a bit higher once again this week, but no breakout has been confirmed thus far.
Let us now move on to see how gold did over the last couple of days.

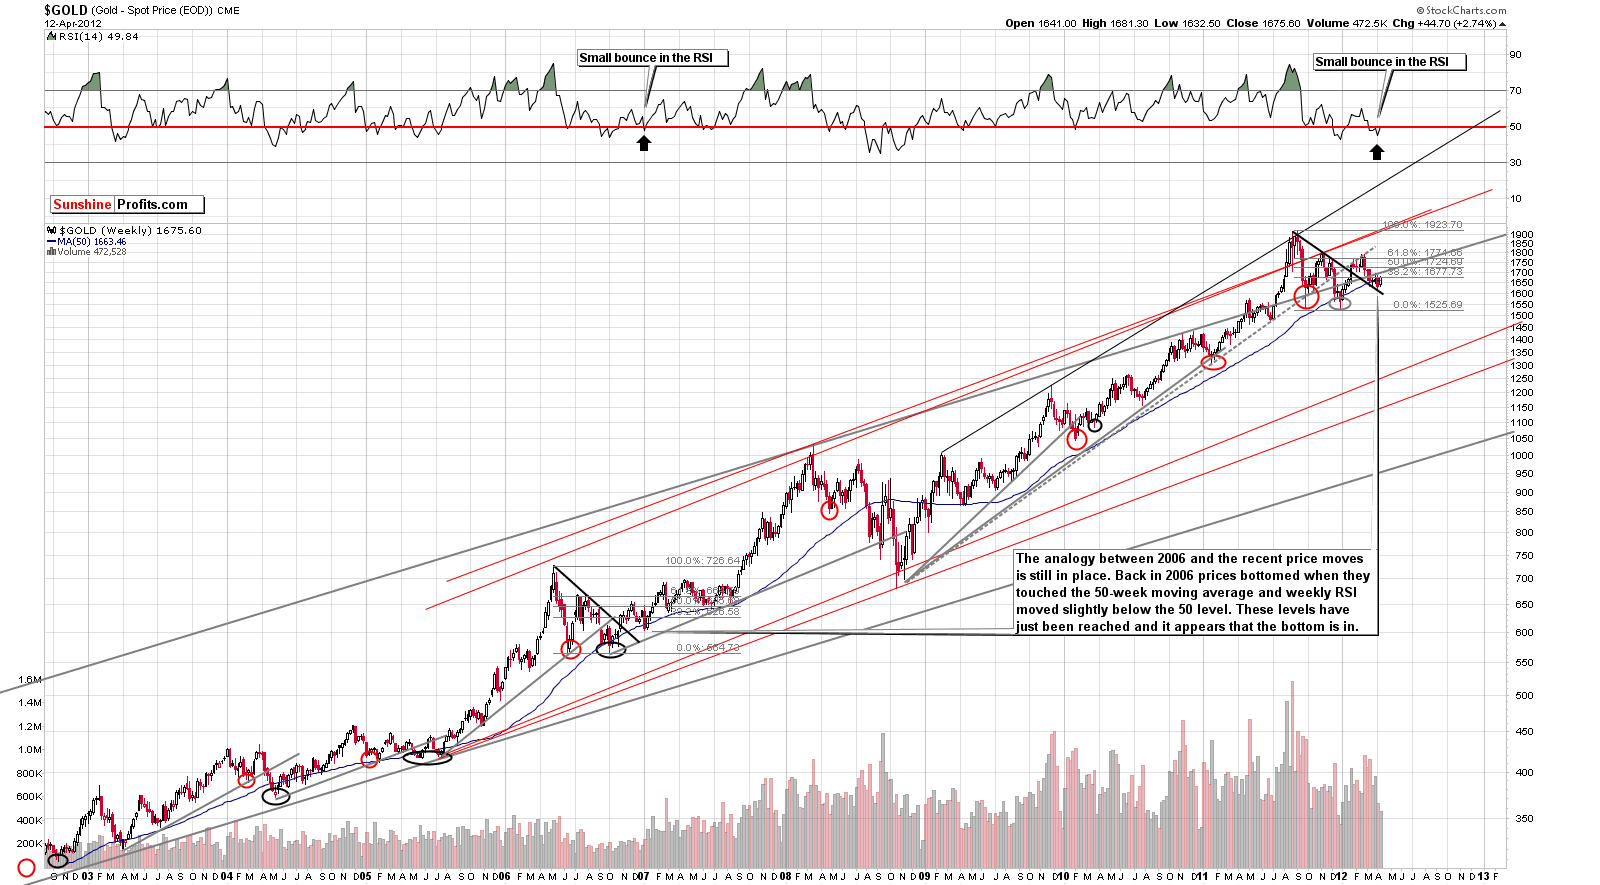
We begin with a look at the very long-term chart (you can click the chart to enlarge it if you’re reading this essay at sunshineprofits.com). Last week, the situation unfolded pretty much as we expected and in line with what we have been reporting over the past few weeks. The price of the yellow metal fell both on Friday and on Monday – but there are no rallies without corrections and seeing one on these two days is not a bearish phenomenon.
Gold’s price has risen nearly 4% since its intra-day low on April 4. The self-similar pattern (comparing late 2011 and 2012 performance to 2006-2007 one) is still in place, although the shape of this correction has been a bit different.
Gold bottomed below the 50-week moving average back in 2007 and began its strong move to the upside soon after, gaining over 50% in the next nine months. Thus this level should be observed closely, as gold closing above it would be a subtle indication that the rally has already begun.
Again, the situation continues to unfold in a manner consistent with the self-similar pattern. Profound bullish implications are therefore in place for the weeks ahead.
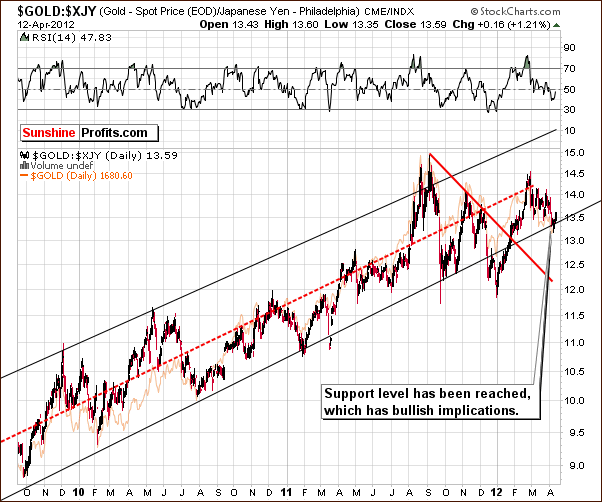
Let us now have a look at the chart of gold from the Japanese yen perspective.

Here we see that a bottom has formed right at the lower border of the trading range. The implications are bullish. The recent decline which came after the sharp rally which began at the start of 2012 was followed by over month of consolidation. Gold’s price could therefore move higher, perhaps to the upper part of the trading channel. Such a move would likely result in a considerable rally in gold prices from the USD perspective as well.

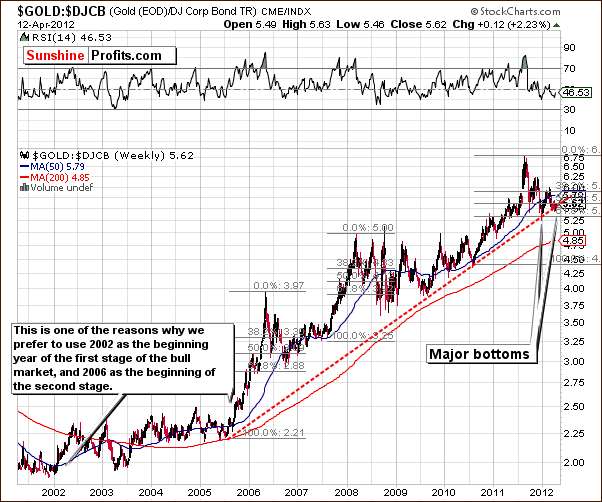
Finally, we look at the gold-to-bonds ratio chart which compares daily closing gold prices with corporate bond index. In general, this chart allows us to put all short-term moves into proper perspective. The chart suggests that we have seen a major bottom and gold is quite likely to now provide us with a strong, multi-month rally. This chart is also clearly bullish.
Summing up, the situation in the USD Index is rather bearish for the long term which is rather bullish for gold. The outlook throughout the gold sector remains bullish.
Please consider joining our subscribers in order to immediately read yesterday's Market Alert, which deals directly with the recent declines in gold, silver and mining stocks. We comment on the suggested action and we emphasize what precious metals investors and traders should not do.
Thank you for reading. Have a great and profitable week!
P. Radomski
Back
