The full version of our analysis (with comments particularly valuable for Precious Metals Traders) is available to our Subscribers. Visit our archives for more gold articles.
In an innovative TV commercial for Barclays Bank, a man walks down on Wall Street but discovers that nearly everything is a fake movie set. The huge investment houses and international banks are all made of paintings on cloth or Styrofoam while the people are mannequins. The nightmare ended with the man finding one real bank which is Barclays Bank.
While the institution claims to bit more substantial, the truth is that all banks have one commonality: they are built upon illusory paper wealth with an unstable foundation.
The financial crisis has made people aware of the vulnerabilities in institutions they trust with their life savings. There are a lot of developments that make these vulnerabilities even more apparent including the following:
· Politicians and the media propagating economic recovery even as the unemployment rate remains stuck at around 10%. Meanwhile, underemployment is around 20%.
· The US national debt is ballooning by $100,000 every three seconds. The once unimaginable debt load of $24 trillion can actually be exceeded in ten years.
· China and Japan are the two biggest holders of US debt. Until now, they have covered the big-spending tab for US politicians. But as they encounter economic problems of their own, doubts about the United States ability to pay are increasing.
Given this situation, the inevitable outcome would be higher taxes and cost of living. The government-induced monetary inflation will reduce the value of the dollar. For some people, the answer lies in converting their dollars to other currencies while for others, it is turning to gold.
Investors are struggling to deal with ballooning US Treasury yields, which are supporting the dollar. The rise in yields acts as a stabilizer but there are inflation concerns. As Treasury rates rise, the dollar becomes more appealing to investors. This could damp the prices in dollar-denominated commodities such as silver and gold. On Tuesday, it can be observed that the bullion suffered swift profit-taking.
The jump in yields may also indicate a more worrying trend that there are widespread concerns about the USs fiscal position. According to Moodys and Fitch, the nations budgetary outlook will suffer from adding $1,000 billion to the US deficit from tax cuts.
The dollar also continues to benefit from problems in the Euro-zone. Barclays economist said that Irelands austerity package is likely to weigh on the euro over the short term because the next general election would cause uncertainty over its final passage and form. Anxiety remains in the peripheral bond market.
Also in Europe, the FTSE Eurofirst 300 is up by 0.4% while Londons FTSE 100 fell 0.2% because of mineral sector losses. Germanys Dax Index went down 0.4% because of news that the countrys exports fell in October.
In Asia-Pacific, shares were mixed in the region but it has a downward bias. The weak yen helped Japanese exporters and the Nikkei 225 hit its highest levels in seven months. Its average rose by 0.9% but other major hubs are under pressure. Chinas Shanghai Composite fell 1% while Hong Kongs Hang Seng Index shed 1.4% on fears of new monetary tightening in Beijing. FTSE Asia-Pacific Index was down 0.8%.
According to Steven Major, the global head of fixed income research at HSBC, you could argue that we are at a new stage where the global cost of capital goes higher and higher. Yields on 10-year US Treasury bonds hit 3.33% which is up by 0.39 percentage points from Monday. It is also 1 percentage point higher than its October low. Meanwhile, the Japanese five-year yields likewise rose the most in two years. Germanys hit 3%. David Ader of CRT Capital said that, people are getting out of the market and moving to the sidelines, feeling shell-shocked at the speed of the rise in yields.
Although yields remain relatively low when compared to long-term trends, investors are starting to worry that they might continue its sharp upward trend. Paul Marson of Lombard Odier, which is a Swiss private bank, yields at this level are clearly unsustainable.
These market movements came after President Obama agreed with Republicans in Congress that the Bush-era tax cuts should be extended. It will also be combined with $120 billion payroll tax holiday. However, investors remain divided as to whether these decisions are enough to explain the recent global increase in yields.
Among the reasons why growth expectations have increased include improved economic data as well as the second stimulus by the US government. But some argue that these movements may be due to fears that the Fed will not follow through on asset purchases or because of high government deficits. Mr. Major, for his part, said that its probably all three.
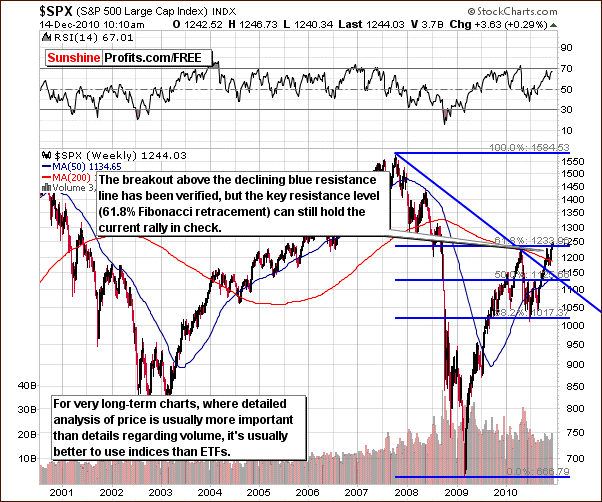
Speaking of the U.S. Economy, let's take a look at the very-long-term chart of the S&P 500 Index (charts courtesy of http://stockcharts.com).

The S&P 500 Index in Wall Street went up by 0.4%, which remains near its two-year high. The long-term chart above shows that the SPX S&P 500 is at a crucial resistance level. The 61.8% Fibonacci retracement level might provide a strong resistance. No bigger rally is projected unless a verified move above the 61.8% line becomes visible. At this point we have seen a small move higher but it was not significant enough to be considered as a true breakout.
The sharp increase in yields is crippling rally in other assets including commodities. The FTSE All-Would Equity Index was down by 0.4% as of December 8, 2010 and the traders favorite, gold, is now pulling back from its record highs. Last Wednesday, gold dropped to $1,381 an ounce while silver at $28.36 an ounce. As of December 13, 2010, gold has since rallied to $1,395 per ounce while silver closed at $29.55.

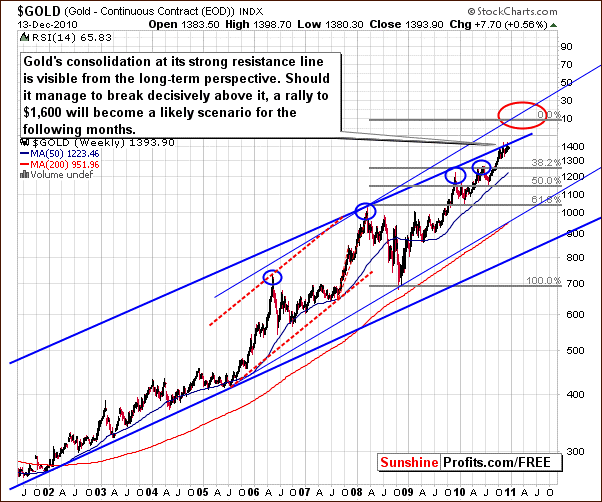
Golds very long-term chart is almost unchanged from last week. The consolidation period for the precious metal has been visible for nearly 2 months. It began in October after gold breached the upper border of the long-term trading channel. The $1,600 is still valid, however we don't expect a substantial rally to emerge until prices break about the multi-year resistance level marked above with the thick blue line.
If you are interested in knowing more on the market signals we analyze, we encourage you to subscribe to our Premium Updates to read the latest trading suggestions. We also have a free mailing list - if you sign up today, you'll get 7 days of full access to our website absolutely free. In other words, there's no risk, and you can unsubscribe anytime.
Thank you for reading.
Rosanne Lim
Sunshine Profits Contributing Author
--
The secret is out and China has revealed its huge appetite for gold. Besides using up its own local gold production, the biggest in the world, China has also imported 209.7 tons of gold so far this year, a fivefold increase over last year. So, if there are not enough reasons out there for gold to continue its upward move, we now officially have yet another one. It doesnt come as a surprise to us.
This week, our Premium Update comes with 23 charts/tables, which include 6 gold charts (one of them has very important long-term implications), USD Index, Euro Index, Silver, XAU Index (how low can it go?), GDX ETF, GDX:SPY and GDXJ:SPY ratios (juniors' and big senior producers' relative performance to other stocks), correlation matrix, and more!
This week's Premium Update includes our up-to-date rankings of top gold and silver juniors and the SP Long-term Junior Indicator. Speaking of the latter, please note that juniors (GDXJ ETF) moved over 60% higher since July 6th (when this indicator suggested switching from seniors to juniors), while seniors (here: GDX ETF) moved up by only 25% since that time. Consequently, this indicator alone generated substantial value for those who took it into account while making their investment-related decisions.
We encourage you to Subscribe to the Premium Service today and read the full version of this week's analysis right away.

