Based on the March 29th, 2011 Premium Update. Visit our archives for more gold & silver articles.
Precious metals market, gold in particular, has been highly influenced by economic indicators and currency market, historically. In our previous essay entitled No Breakout in Gold So Far, Strong Resistance Seen in Silver, we have analyzed the situation in metals, however since no market moves on its own, this essay will provide complementary information regarding other markets.
Relating general stock market and currency fluctuations with metal prices is a widely accepted gauge to measure the strength in precious metal market moves. To connect the relationship between economic scenario and metals fluctuations, lets take an example.
We had been asked recently by one of our Subscribers "it would appear considerable rebuilding will be necessary in Japan. Any indications this will impact stocks of companies that export timber products?"
We agree that the rebuilding process in Japan will put positive pressure on commodities' prices, also on timber, if... there is money for that. And we know that there will be money for that based on the recent G-7 decision, so not only is this decision inflationary (in the end even if the powers that be decide not to simply print money at this time, they will most likely be forced to do so later on as they will not have enough cash left for other domestic expenses), but particularly positive for commodities.
Now let's move to another question about the Japan: "has it not struck you that selling US treasuries will increase the price of Yen relative to US dollars which the Japanese Govt. does not want to see happen. More than likely the Japanese will print money over the rest of this decade to pay for most of the reconstruction caused by the Earthquake and Tsunami. Could be wrong but it makes more sense to me notwithstanding it is bad policy."
Actually that makes sense to us and could very well happen. The Japanese are very well acquainted with quantitative easing. They just about invented the concept. Japan was the first economy in recent times to have tried a full-scale version of quantitative easing for a significant period, well before Ben Bernanke. The Bank of Japan lowered the policy rate to zero in February 2001 and then went to quantitative easing the next month. It ended both quantitative easing and its zero interest rate policy only in 2006. Whether you call it quantitative easing or??????, ry?teki kin'y? kanwa, we tend to think that it makes for bad policy in the end but is good for commodities.
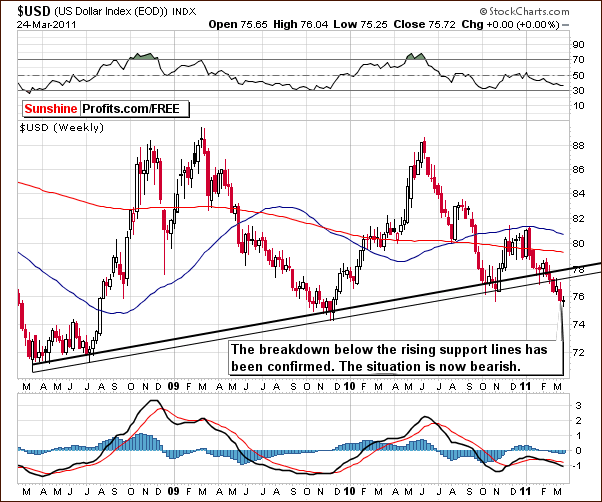
To have a broader overview on precious metals and currencies/economic indicators, lets see how stock market and currencies are performing at this moment. To do that, lets turn to the technical portion with analysis of the USD Index. We will start with the long-term chart for the USD Index (charts courtesy by http://stockcharts.com.)

On the long-term chart we can see a recent breakdown below the rising support line which is clearly in play. Its support has been invalidated and this level has now in fact become a resistance line. In short-term USD Index chart, the index levels have temporarily moved below the support line created by the November 2010 low.

Zooming in, we may see a positive sentiment, possibly a rally to the 78 level or so based on the rising resistance lines from the previous long-term chart, and the Fibonacci retracement levels on the short-term one. It is not clear at this time when this can be expected.
Moreover, the RSI level, which is near 30, is in the range of past local bottoms. Although the breakdown below previous important index lows has not been confirmed, we will find further confirmation based on the Euro Index performance.

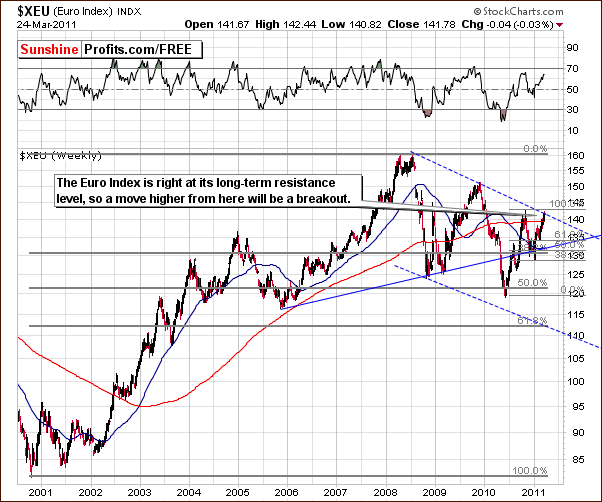
The Euro Index has rallied to the declining resistance line formed by the 2008 and 2009 tops. The question now is Will a breakout be seen? Furthermore, Will the index level move above this resistance line and then manages to stay there? The answers to these questions will likely determine the direction of the next trend in both the USD and Euro Indices.
Overall, no breakout has been seen yet in Euro Index and the trend seems to remain down. With the situation in Portugal, the European debt crisis is still a factor that could stop the current rally in the European currency.
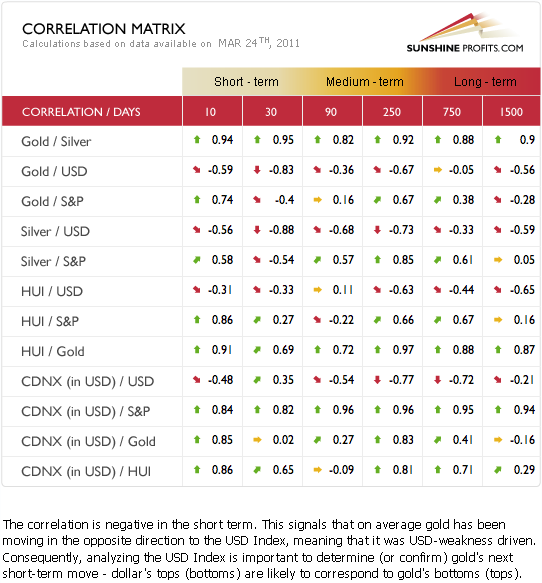
So, what does the above mean for Gold and Silver Investors? It suggests caution for bulls as the rally in the USD Index might ignite a decline in the metals. Please take a look below for details.

Gold and silver are currently negatively correlated to a great extent with the US dollar as far as short term is concerned. Please note the values of the correlation coefficient for gold/USD (-0.83) and silver/USD (-0.88).
As we discussed earlier, the breakdown below the rising support line has not been confirmed in the USD Index. No breakout has been seen in the Euro Index. All this points to a slightly bullish situation for the dollar, which does not signal strong support for precious metals overall at this moment.
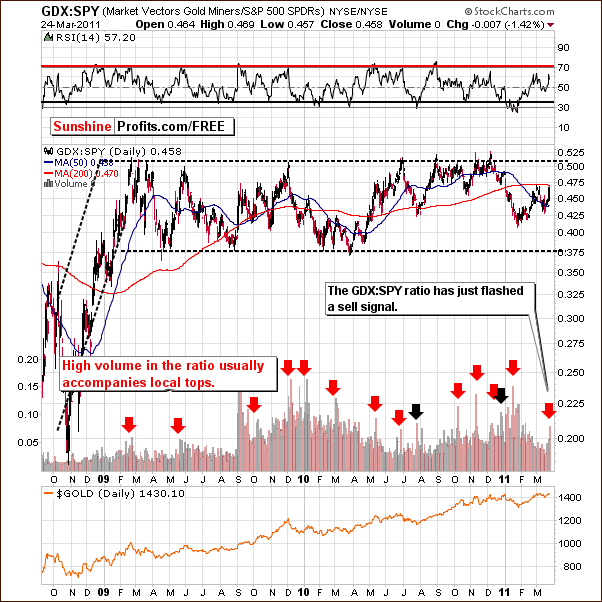
Before summarizing we would like to let you know about the recent development in the GDX:SPY ratio.

The GDX:SPY ratio measures mining stocks performance against the general stock market. The important news is that we have just seen a spike high in volume.
The sell signal is generally given when we see a single spike high in the volume levels, meaning that the volume in gold and silver mining stocks has been much bigger than that seen in the general stock market. The quality of this signal is enhanced if the ratio encounters a resistance level as well. Such is the case here, as the 200-day moving average and the early March highs are both in play.
While this is not an overly important resistance level, it has stopped rallies in the past. With the recent spike high volume and these resistance levels in play, the outlook is not much promising in the near-term.
This is a big deal because this ratio has been quite reliable in the past in terms of giving a buy/sell signal for gold and silver mining stocks. Based on its previous performance we believe that it should not be ignored.
Summing up, the euro has reached a long-term resistance line and this suggests a likely rally in the USD Index. Based on the recent correlation between USD and precious metals, the above should make Precious Metals Bulls particularly cautious, especially that we have also seen a negative signals from the GDX:SPY ratio.
To make sure that you are notified once the new features are implemented, and get immediate access to my free thoughts on the market, including information not available publicly, we urge you to sign up for our free e-mail list. Sign up for our gold & silver mailing list today and you'll also get free, 7-day access to the Premium Sections on my website, including valuable tools and charts dedicated to serious PM Investors and Speculators. It's free and you may unsubscribe at any time.
Thank you for reading. Have a great weekend and profitable week!
P. Radomski
--
All in all, uncertainty hangs like a dark cloud over the future of the global economy with tsunamis, radioactive plumes, Middle East revolutions/ tribal wars and to top it all-- a new round of the European debt crisis. All these events are bullish indications for precious metals.
The previous week has been full of important signals (that made us suggest making purchases on March 17th) and this week is not really different - today's report also includes an important timing-related signal.
Gold is right at its previous highs and silver moved to its strong long-term resistance line. A move from here could be profound, so without further introduction we encourage you to read our latest Premium Update, and check what's the best way to position yourself given today's volatile environment.
We encourage you to Subscribe to the Premium Service today and read the full version of this week's analysis right away.

