Visit our archives for more gold & silver articles.
There is all the talk of Greece leaving the eurozone and we are already seeing a slow-motion runs on Greek banks. The Financial Times reports that €5 billion has left Greek banks in just the last two weeks and the more that Greek citizens feel it is possible that their country will leave the euro, the more incentive they have for pulling their money out and sending it abroad.
There are no rules in place for a country to leave the eurozone and it is anybody’s guess as to how severe the impact of such a move will be. These are uncharted waters and the sailing could get very rough. If Greece were to leave the eurozone, gold could initially fall on euro weakness and a flight to cash but the precious metal might then bounce due to a policy response of quantitative easing from central banks.
No one can predict how big the systemic contagion will be for Spain, Italy and their banks. In Spain, 16 banks and four regions have just been downgraded by Moody’s Investor Service. The point of no return may be approaching faster than anyone anticipated. Spain and Italy are too big to bail out if panic ensues after a “Greexit,” which is why European leaders would prefer that Greece, with all its problems, remain. A Greek departure is likely to be seen as the beginning of the end for the whole euro zone project. Greek voters still need to produce a functioning government in new elections on June 17.
New York Times columnist Paul Krugman compared the choice of Greece staying in Eurozone to the situation of Italy, where the north has had to subsidize the poorer south for many decades. He writes:
Italy’s currency union held together because the north made, and continues to make, large fiscal transfers to the south. Economists reckon these transfers to be around 4-5 per cent of Italian GDP. A flow of subsidies towards the south has had evil consequences: incomes have been maintained at uneconomically high levels, fostering unemployment. Large infrastructure and development projects have fueled corruption, sustaining southern Italy’s criminal societies. Fiscal transfers helped Italy maintain its political unity but the cost has been enormous. From an economic perspective, the Mezzogiorno (Italy’s south) would probably have done better if it had stayed out of Italy’s monetary union.
Today, Greece stands on the brink of an exit from the euro. To avoid further sovereign contagion, the remaining eurozone members may find themselves pushed rapidly into a more complete fiscal and political union. The markets would doubtless applaud such an outcome. But if Italy’s example is relevant, the northern eurozone members could find themselves paying indefinitely a large tribute to the south. Economic divergences within the single currency area could become entrenched. Viewed from this perspective, a clean-break divorce might bring more immediate pain but in the end prove less costly than an unhappy marriage Italian style.
Meanwhile, central banks continued to buy bullion in April as Turkey raised its reserves by 29.7 metric tons and Ukraine, Mexico and Kazakhstan also increased their holdings, according to International Monetary Fund data.
Before addressing the title question, let's begin this week's technical part with the analysis of the S&P 500’s long-term chart (charts courtesy by http://stockcharts.com.)

In the long-term S&P 500 Index chart (if you are reading this essay on sunshineprofits.com, you may click the above chart to enlarge), stocks are at some important support levels now. Last week, stocks moved below the long-term support line and today are trying to move back above it. We have seen some sideways trading around it and stocks are slightly above the support line based on intra-day highs. It’s important to see where they close this week, as this chart alone does not give decisive information.
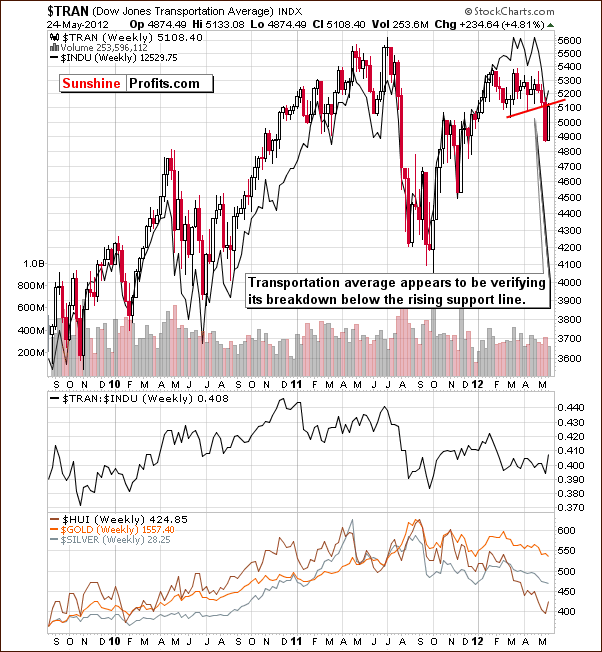
Let us now move on to Dow Jones Transportation Average chart.

In the chart, we see a significant breakdown last week, which was is currently being verified by a move back to the resistance line. If the index closes the week below this level, the breakdown will be verified.
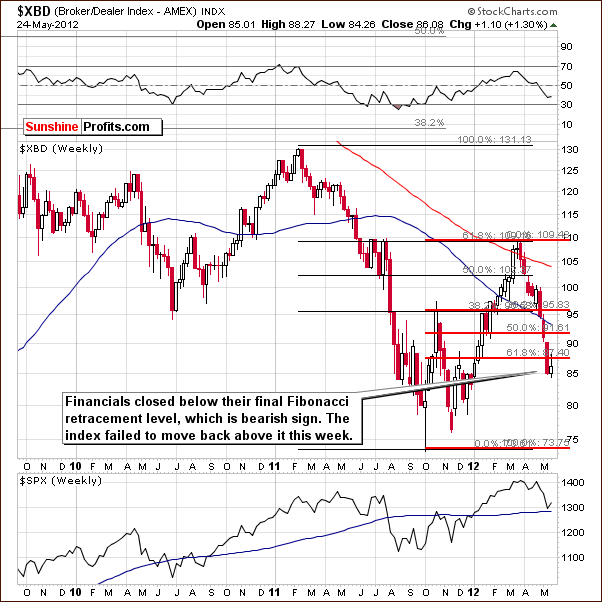
Now, let’s see how the financials did this week.

In the Broker Dealer Index chart (a proxy for the financial sector), we saw a move below the final Fibonacci retracement level last week. Attempts to move back above this line have been unsuccessful and the index is still visibly below this resistance line. This can be viewed as a verification of the breakdown, which is bearish not only for financials, but also for other stocks (more on this subject can be found in last week’s essay).
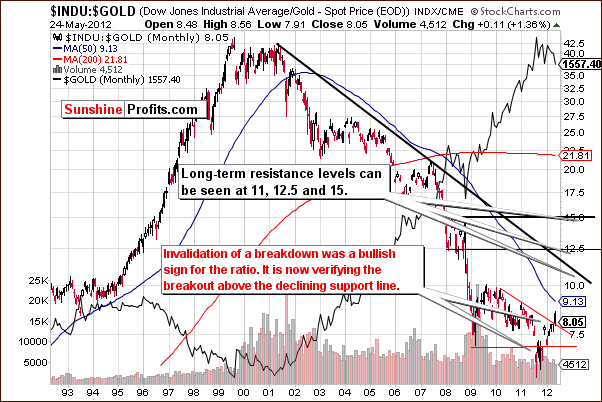
Finally, let’s take a look at the Dow:Gold ratio.

In the chart, we see that the ratio moved lower for a ten year period as gold prices rose. The ratio tried to move below the lows of 2009 in 2011 but the breakdown has been invalidated and a rally followed. In fact, this rally took the ratio above the medium-term declining resistance line (the declining red line on the above chart) and this breakout is now being verified.
There are some bearish implications for gold here but these are limited since the breakout in the ratio has not yet been verified.
Summing up, the situation in stocks is a bit indecisive for the S&P 500 but other indices show signs that lower stock prices are to come. In addition to these charts, a note about fundamentals seems valid here. Companies which are strong generally act weak before periods of market decline, whereas those which are weak fundamentally can be seen to thrive during the final part of a rally. Apple, seen as a strong company moved lower on Thursday, whereas Facebook (seen as weak from the valuation approach) has moved higher in each of the past two days. If the “strong-weak” theory holds, lower stock prices would be in the cards. As has already been mentioned, there are some bearish implications for gold in the dow:gold ratio chart, but we need to wait until the breakout in the ratio is verified to consider them reliable.
To make sure that you are notified once the new features are implemented, and get immediate access to my free thoughts on the market, including information not available publicly, we urge you to sign up for our free e-mail list. Sign up for our gold & silver mailing list today and you'll also get free, 7-day access to the Premium Sections on my website, including valuable tools and charts dedicated to serious PM Investors and Speculators. It's free and you may unsubscribe at any time.
Thank you for reading. Have a great weekend and profitable week!
P. Radomski
--
Gold traders have been tracking USD Index with great precision in the past few days (as reflected by the strong link between these two markets) and so were we. Today's Premium Update includes the analysis of the USD and Euro Indices - we believe these are two of the most important things that one need to focus on today, virtually regardless of the investment that one is considering.
Another interesting phenomenon that we saw this week was gold stock's outperformance of gold. This is something that used to signal good things to come for the precious metals, but it was also seen right before the September 2011 and February 2012 declines. What can this - and a breakdown in crude oil - mean for precious metals investors at this time? This is one of the questions that we reply in today's analysis.
Additionally, we comment on the current situation in the general stock market (including the transportation average), dow:gold ratio, silver:gold ratio, TSX Venture Index, breakout in the GDX ETF, platinum, "monetary easing in unison", "Greexit", position sizing and diversification between strategies and we provide targets for gold and silver.
We encourage you to Subscribe to the Premium Service today and read the full version of this week's analysis right away.

