Based on the October 21st, 2011 Premium Update. Visit our archives for more gold & silver articles.
Whenever gold prices rise or decline the headlines give a flavor-of-the-week reasonthe dollar is up, the dollar is down, the eurozone is in trouble, its the latest jobs report, etc. There is no doubt that global economic conditions are inter-related and that a butterfly flapping its wings in one part of the world can effect gold prices. This week was no exception. This weeks decline was partly explained by news out of China. The Chinese economy, the second largest in the world, expanded by only 9.1 per cent in the third quarter, down from 9.5 per cent in the second quarter and 9.7 per cent in the first three months of the year. This is a growth rate that all countries on the planet would give their eye teeth to find in their fortune cookie. But for China it was the slowest growth since 2009. This prompted fears that the world's economic engine will slow down eating into demand for exporting countries.
Just to give you an idea of the numbers we are talking aboutthe Chinese growth rate compares with just 1.3 percent growth in the United States and 0.2 percent growth in the 17-country eurozone during the second quarter.
Chinas slowed growth is a result of China's government struggle to rein in high inflation by tightening credit markets, raising interest rates five times since last October and imposing higher reserve requirements on many of the nation's banks. So far they have had little success with inflation and consumer prices still zoom at the rate of China's new high-speed trains. (Come to think of it, didnt one of those trains crash recently killing 40 people? The crash has come to symbolize much that's wrong with China's warp-speed, lack-of-attention-to-safety-and environment development.) In September prices increased 6.1 percent annually, compared with just 3.6 percent a year earlier.
Can China rein in its high inflation? This is an important question for gold investors. Chinas high inflation will inevitably be exported to other counties along with the higher priced Chinese consumer goods. Gold is a classic hedge against inflation and Chinese emerging middle class knows this well.
Can China do it? It will be difficult at best. Although China may understate its inflation statistics, it is clear that inflation is inevitable. Recall that Chinese companies raised worker wages after a spate of worker suicides. In addition, real estate prices are up 13% in the past year. Everything that China manufactures will become more expensive in dollar terms and that is how you import inflation. There are other emerging markets with significant inflation, including Russia with 6%, Brazil with 5.4% and India with 14.5%, to name a few. The commodities and manufactured good in these countries will become more expensive in US dollar terms. This is bringing inflation to developed countries through the back door, via the emerging market ones.
Once we have the big picture in mind, we will move on to the technical part of todays essay to see whats golds potential in the short-term. We will start this analysis with golds very long-term chart (charts courtesy by http://stockcharts.com.)

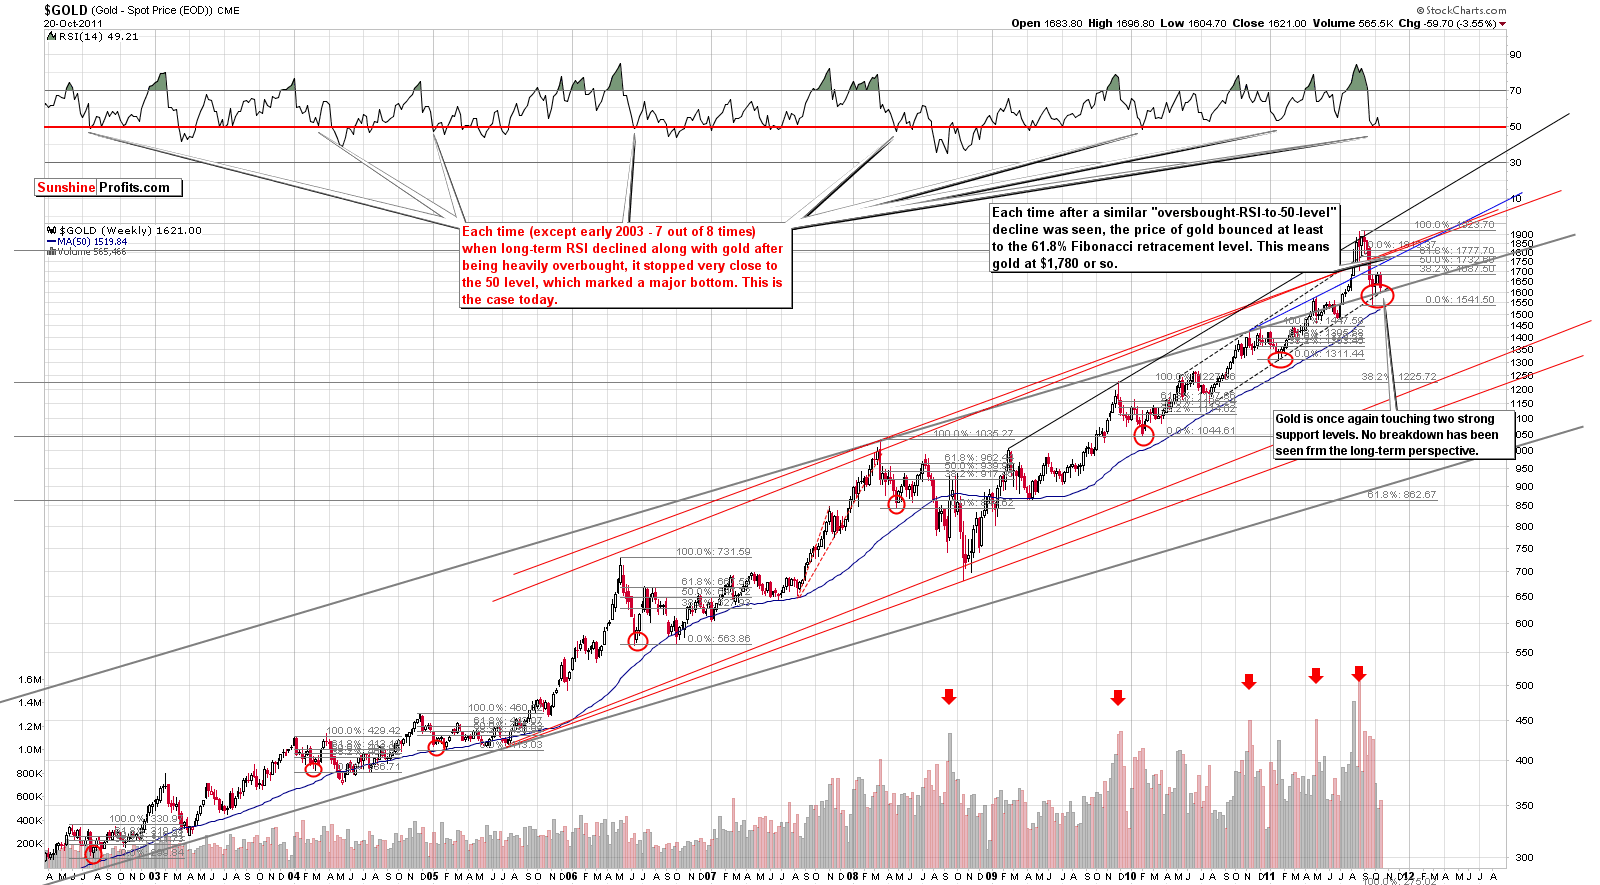
In the chart (if you're reading this essay on SunhineProfits.com, you can click the above chart to enlarge it) we see that even though golds price has declined this week, it reached the intersection of two important support levels and the touched and rallied late on Thursday. Therefore, no breakdown has been seen from the long-term perspective and the general direction for gold still appears to be to the upside. This is also confirmed by the current RSI levels.
A likely upside target level for gold at this time appears to be $1,780, which is a good bit above where the price is today.
We are inclined to think that were relatively close to an upswing in gold. The point here is if a decline is seen before the upswing, it could simply be the formation of a double bottom with the rally yet to come. So a short move down did not invalidate any rally this week since the rally had not yet begun. We have simply seen a rebound after an initial bottom with a second bottom now being formed. As long as the two support levels in the $1,600 range hold, the outlook remains bullish.

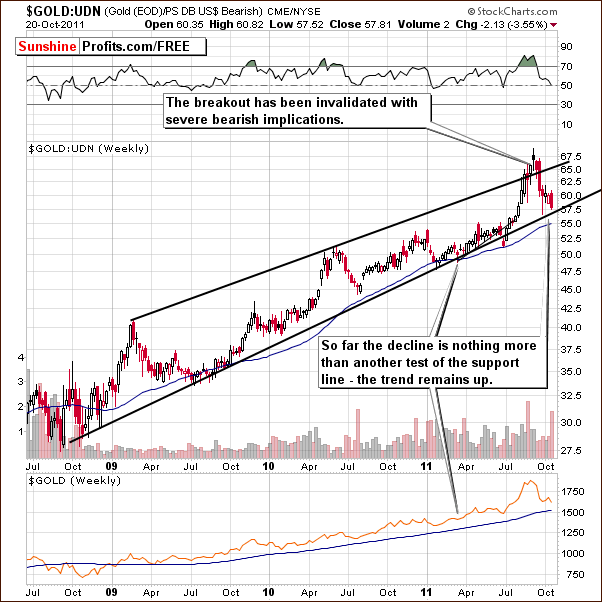
In the long-term chart for gold from a non-USD perspective, we see another move towards the lower border of the trading channel. This appears to be no more than a test of the support line and the upside potential appears greater than the downside risk. The outlook is therefore bullish from a non-USD viewpoint this week.

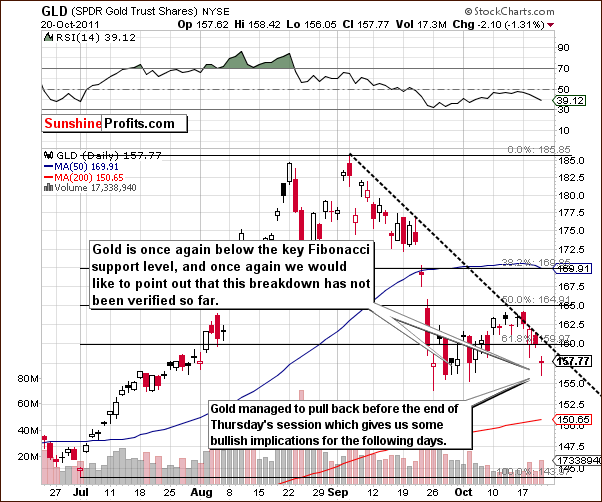
In the short-term GLD ETF chart, we could be seeing a double bottom formation being started. There is a possibility of a breakdown below the 61.8 % Fibonacci retracement level created by the July to September rally, but this breakdown has not yet been verified and no conclusions should therefore be made at this time.
The situation here could turn bearish if a move below this key support level holds for two or more days, but this does not seem likely. Another point to keep in mind is that gold is quite close to its declining resistance line and a move above the $160 or so level for the GLD ETF could signify a breakout.
Summing up, although golds price declined in the past few days, we still believe the situation remains bullish.
To make sure that you are notified once the new features are implemented, and get immediate access to my free thoughts on the market, including information not available publicly, we urge you to sign up for our free e-mail list. Sign up for our gold & silver mailing list today and you'll also get free, 7-day access to the Premium Sections on my website, including valuable tools and charts dedicated to serious PM Investors and Speculators. It's free and you may unsubscribe at any time.
Thank you for reading. Have a great weekend and profitable week!
P. Radomski
--
Gold has just touched two support levels and an interesting pattern emerged. Thanks to the analysis of long-term price patterns we can infer not only the direction in which the price is likely to move, but also its shape.
The same can be said about silver - long-term chart provides us with important insight as to what actions are currently profitable from the risk/reward perspective, and which are not. In addition to the above, we comment on many other patterns that emerged in the precious metals market this week. One of the most interesting one's comes from the analysis of the GDX:SPY ratio.
Finally, today's Premium Update includes 2 signals coming from our unique SP Indicators.
We encourage you to Subscribe to the Premium Service today and read the full version of this week's analysis right away.

