This week, the WGC published a new edition of its quarterly report on gold demand. According to the organization, in the third quarter of 2019, the demand for gold amounted to 1,108 tons, declining 3 percent from the previous quarter, but still rising 2.7 percent year-over year.
The main driver of the annual increase were strong ETF inflows. Holdings in global gold-backed ETFs grew by 258 tons in Q3, the highest level of quarterly inflows since Q1 2016, reaching a new all-time high of 2,855 tons. The inflows were supported by accommodative monetary policies, continued geopolitical uncertainty, global economic slowdown, the prevalence of negative-yielding sovereign debt, along with safe-haven and momentum buying. Unlike the previous quarter, most of global ETF inflows during the third quarter were directed towards the U.S.-listed funds, not UK-listed funds. It indicates that investors are now less afraid of Brexit and more of possible downturn in America.
The surge in ETF inflows outweighed weakness elsewhere in the market. Global bar and coin demand halved year-over-year, dropping to 150 tons, its lowest quarterly level since Q1 2008. Similarly, jewelry demand was down 16 percent to 461 tons in Q3. The main cause of these declines were higher gold prices, which forced retail investors to defer purchases. It confirms our thesis that demand for gold bars, coins and jewelry does not drive the gold prices, but it is driven by them!
Central banks added 156 tons to their reserves in Q3. Although central bank buying remained healthy, it was significantly lower than the record levels of Q3 2018, declining 38-percent. Turkey, Russia and China led the way among the central banks purchasing gold.
Technology demand faced continued challenges and declined 4 percent, hit by slower global GDP growth and U.S.-Sino trade war. Last but not least, the supply of gold grew 4 percent, driven by a 10-percent jump in recycling (high gold prices encouraged people to sell back more gold), which more than outweighed the 1-percent decline in mine production.
As always, we remind investors to take the WGC report with a pinch of salt. Or, rather a bowl of salt! Their data is not adequate, or I should say "flawed."
The True Fundamental Analysis of Gold Market in Q3
The problem with the WGC's analyses of the gold market is that it uses numbers that clearly do not make any sense. According to the recent edition of the Gold Demand Trends, in Q3, the demand for gold increased 2.7 percent, while the supply rose 4 percent. So, the supply moved stronger than demand. But the price of gold still managed to jump 5 percent during the third quarter of 2019! There are only two options here. Either the law of supply and demand does not work, which should revolutionize the economics and bring the Nobel Prize for the WGC. Or, the organization's estimates of demand and supply are flawed. No offense, dear WGC, but the latter is more likely.
In defense of the organization, it is worth noting that this is a common error. Many analysts treat gold as commodity. In case of copper it makes perfect sense to determine the supply and demand from various sectors. Then, you compare the numbers, adjust for the changes in reserves, and you got the direction the price of copper is likely to follow.
But - are you listening, dear WGC? - the gold market is completely different. Gold is not consumed, it is hoarded! It means that virtually all production is accumulated instead of used up. This is why the annual mining production is a ridiculously small percentage of the total gold holdings. Hence, the balance between the fresh supply and demand is irrelevant in the gold market. The producers and consumers of gold do not drive the gold prices. The actual and potential holders of gold determine that.
Indeed, gold behaves as a currency. The demand for gold comes from marginal buyers of gold. For instance, if the demand for gold increases, it means that buyers of gold value gold more highly and thus are willing to pay a higher price. What influences the demand for gold?
Several factors, but the three most important are: (please note that the same factors affect the supply side): the level of confidence in the Fed and the U.S. economy, the U.S. dollar exchange rate, the level of real interest rates, etc. For example, when people lose confidence in the American economy, they could buy gold more willingly.
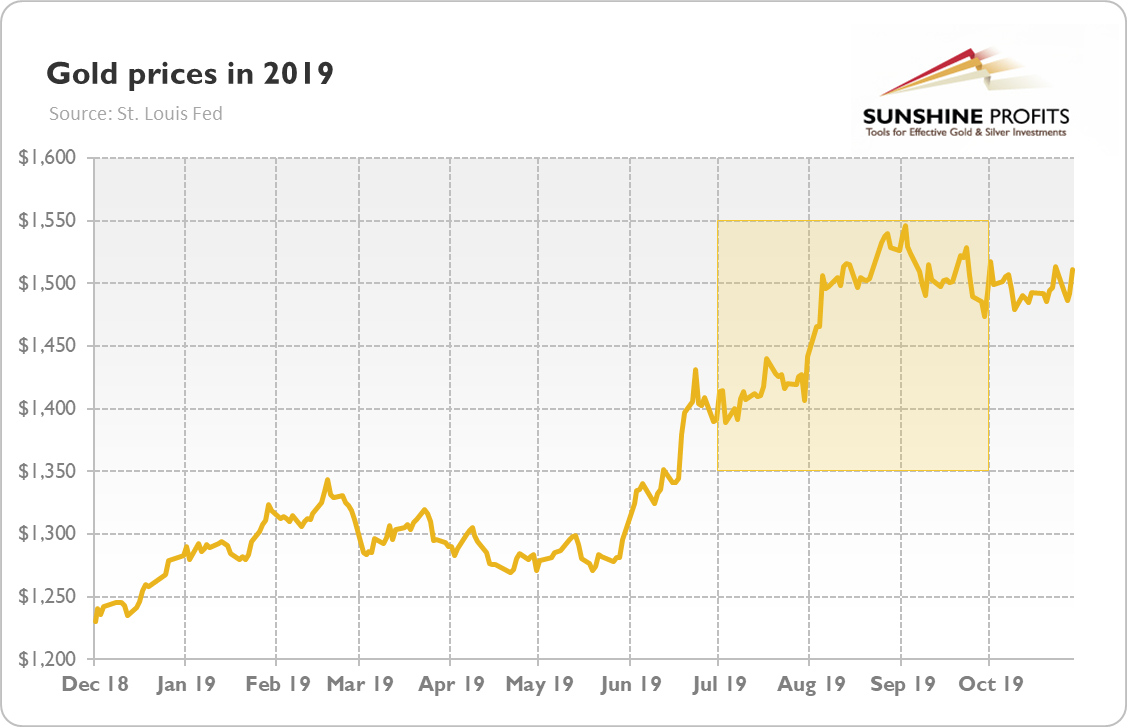
So let's analyze the gold market in Q3, keeping in mind these fundamental truths. The third quarter of 2019 was positive for the yellow metal. Gold gained 5.4 percent in Q3, rising from to $1,409 at the end of June to $1,485 at the end of September. And gold's performance is even better in the whole year, in line with my annual forecast. In the three first quarters of 2019, the shine metal jumped more than 16 percent, rallying from $1,268, as the chart below shows.
Chart 1: The price of gold in U.S. dollars in Q3 2019 (London P.M. Fix).
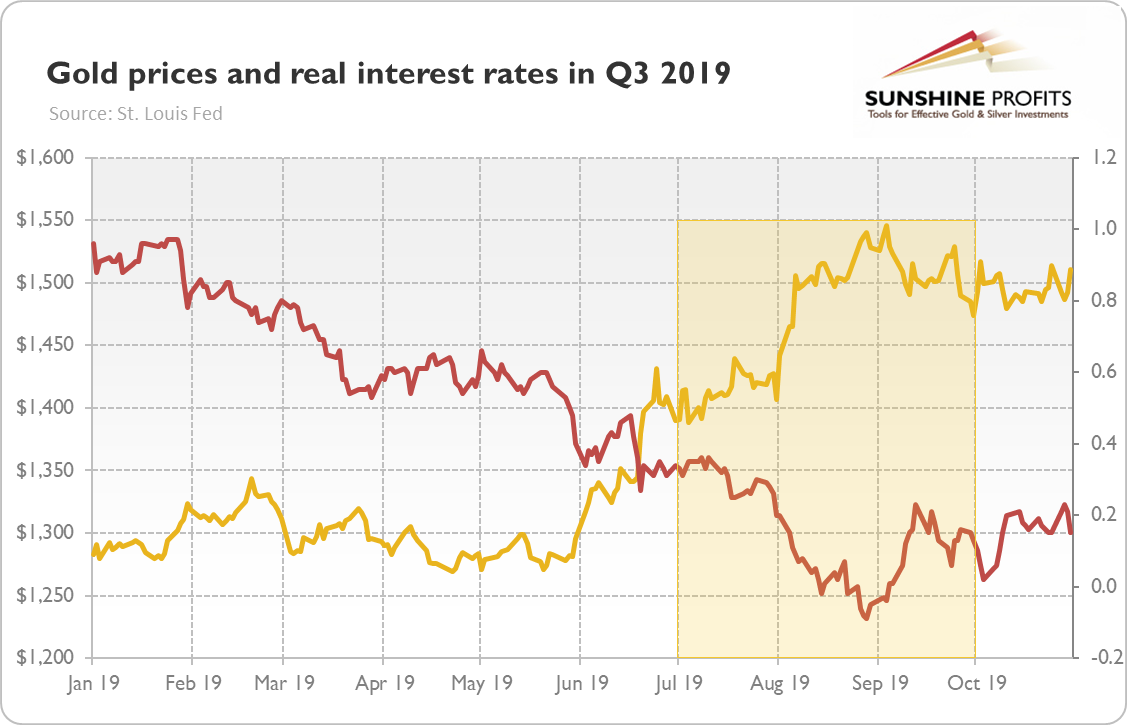
What drove gold prices in the third quarter? The short answer is: real interest rates. As one can see in the chart below, they dived in August, boosting the gold prices. A bit longer response is: the accommodative shift in the Fed's monetary policy that pushed the bond yields lower, helping the yellow metal.
Chart 2: Gold prices (yellow line, left axis, P.M. Fix, in $) and the US real interest rates (red line, right axis, yields on 10-year inflation-indexed Treasuries, in %) from January 2019 to October 2019.
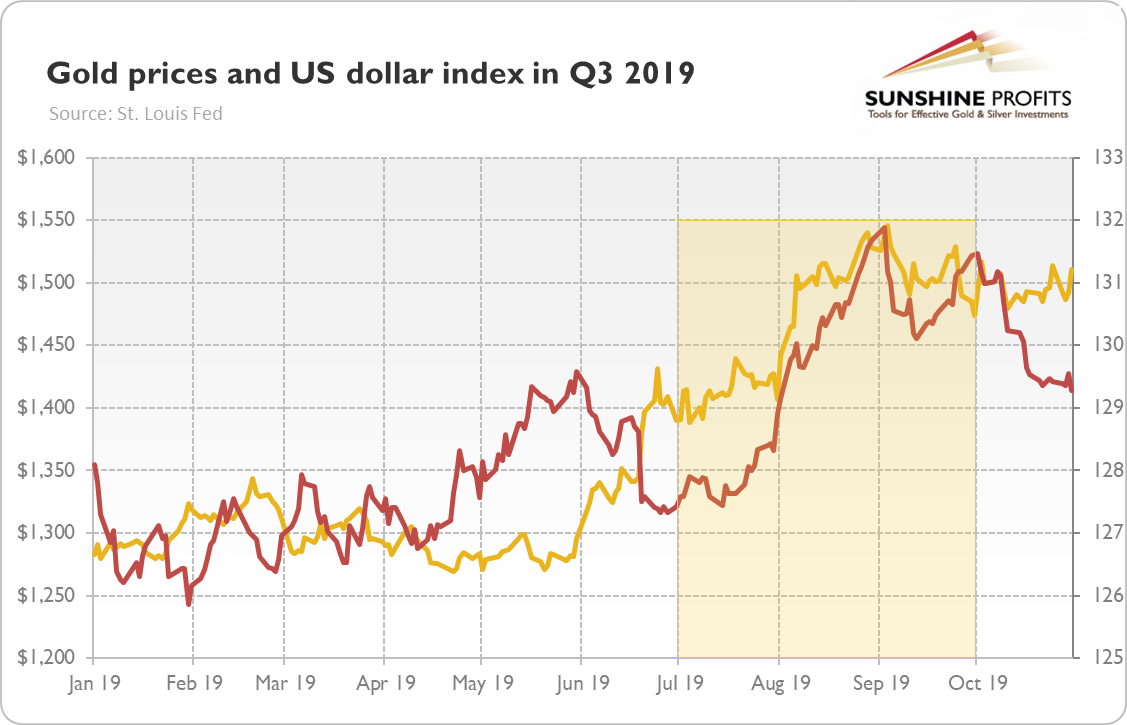
Importantly, the impact of lower real interest rates was so strong that the accelerating U.S. dollar did not manage to spoil the party. As the chart below shows, the greenback and the yellow metal rose in tandem in Q3. Both performed the role of the safe-haven asset in times of global slowdown and trade wars.
Chart 3: Gold prices (yellow line, left axis, P.M. Fix, in $) and the trade weighted broad US dollar index (red line, right axis) from January 2019 to October 2019.
Implications for Gold's Future
What does it all imply for gold's outlook? From the fundamental point of view, the future looks bright. The U.S. dollar depreciated in October, which could help gold prices. As one can see in the chart above, gold did not move in tandem with greenback last month. The reestablishment of usual negative correlation when the U.S. dollar weakens, is good news for the gold market.
Moreover, although real interest rates have rebounded somewhat since the end of August, they may reenter their downward trend in the near future. Although the Fed stepped away from further cuts for a while, it also ruled out any hikes unless we see a significant rise in inflation, which is not going to happen in the very near future.
But the point is that we will probably see more cuts along the way. Chicago Federal Reserve President Charles Evans said yesterday that the current level of interest rates would not be appropriate should there be a future negative shock to the U.S. economy: "Our adjustments have not been anywhere large enough to change the dynamics substantially. If there was a big negative shock, we'd have to respond." Oh yes, I'm pretty sure that the Fed will respond! If they cut federal funds rate three times just in case, they will ease their stance like there's no tomorrow, when something really ugly happens. I know this and all investors know this. So, the Fed's bias creates downward pressure on the market interest rates. In such an environment, gold should shine.
Thank you.
Arkadiusz Sieron, PhD
Sunshine Profits - Effective Investments through Diligence and Care
Disclaimer: Please note that the aim of the above analysis is to discuss the likely long-term impact of the featured phenomenon on the price of gold and this analysis does not indicate (nor does it aim to do so) whether gold is likely to move higher or lower in the short- or medium term. In order to determine the latter, many additional factors need to be considered (i.e. sentiment, chart patterns, cycles, indicators, ratios, self-similar patterns and more) and we are taking them into account (and discussing the short- and medium-term outlook) in our trading alerts.


