Gold started the new year with a bang. Does it imply a beginning of a bull market or it is only a temporary rise?
The Rise in Risk-Aversion
The London spot price of the shiny metal gained almost 5 percent in January. What were the reasons behind this rise? Well, the main theme was the market turmoil caused by worries about China, the collapse of oil prices and weak U.S. economic data.
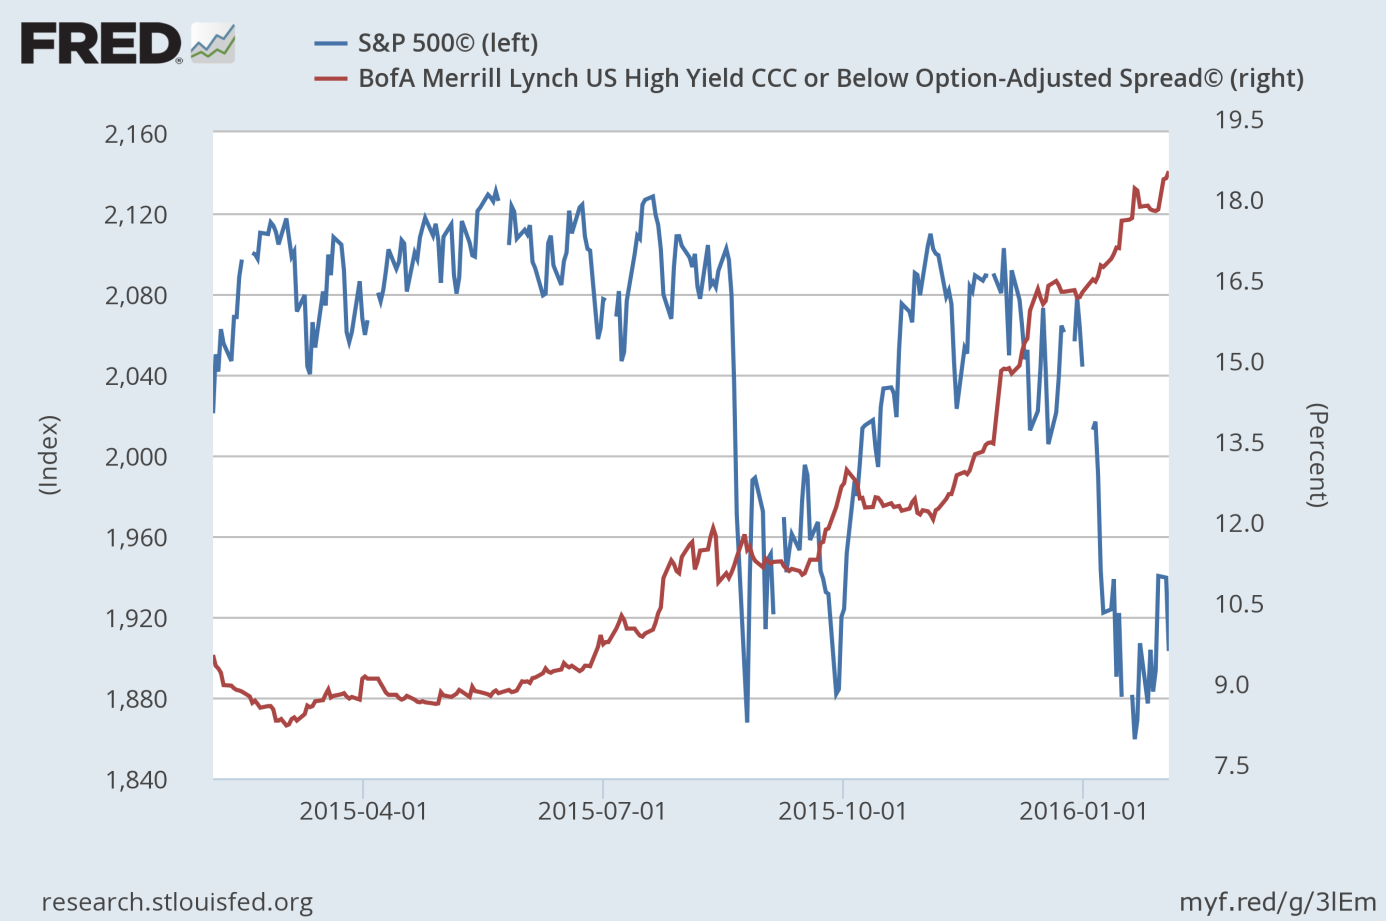
The crash in commodity prices led the junk bond market to blow up. Junk bonds become even more junk in January. As one can see in the chart below, the spread between bonds rated CCC or below and Treasury bonds widened from 16.5 to 18.6, a level higher than in September 2008. The widening spreads indicate that investors have become more risk-averse and fly more intensively to safety.
Therefore, the lower risk appetite in the markets changed the sentiment towards gold – the ultimate safe-haven. This is precisely what we predicted in August 2015. We reiterated our stance in December 2015 and wrote: “the widening spreads between junk and Treasury bonds usually precede problems in the stock market”. Indeed, the S&P 500 Index plunged about 5 percent in the January (see the chart below).
Chart 1: The spread between corporate bonds rated CCC and below and Treasury bonds from 2015 to 2016 (red line, right axis) and the S&P 500 Index (blue line, left axis).

The Dovish Fed
What is perhaps most important, the market turmoil led the investors to start betting that the Federal Reserve would be forced to tighten its monetary policy at a slower-than-expected pace this year. As a reminder, the December Fed dot plot suggested four 25-basis point increases. We were skeptical about the official Fed projections, since historically the U.S. central bankers failed at predicting what they would do. In December 2015 markets expected only two hikes in 2016, but we were a bit skeptical about that scenario either, remembering how long it took the Fed to conduct just one baby-step hike, and predicted that the U.S. central bank’s tightening cycle will be less aggressive than expected, which will be bullish for gold. We wrote: “We also see upside potential for the shiny metal, since the FOMC’s projections of the fed funds rates are completely unreliable, while in the U.S. economic recent data is worrisome, and may have prompted the Fed into a more gradual tightening cycle than expected”. Undoubtedly, the Fed could still surprise us, but it is highly unlikely given the current market odds for a rate hike. Indeed, the Fed funds future contracts suggest that markets expect no hike in 2016!
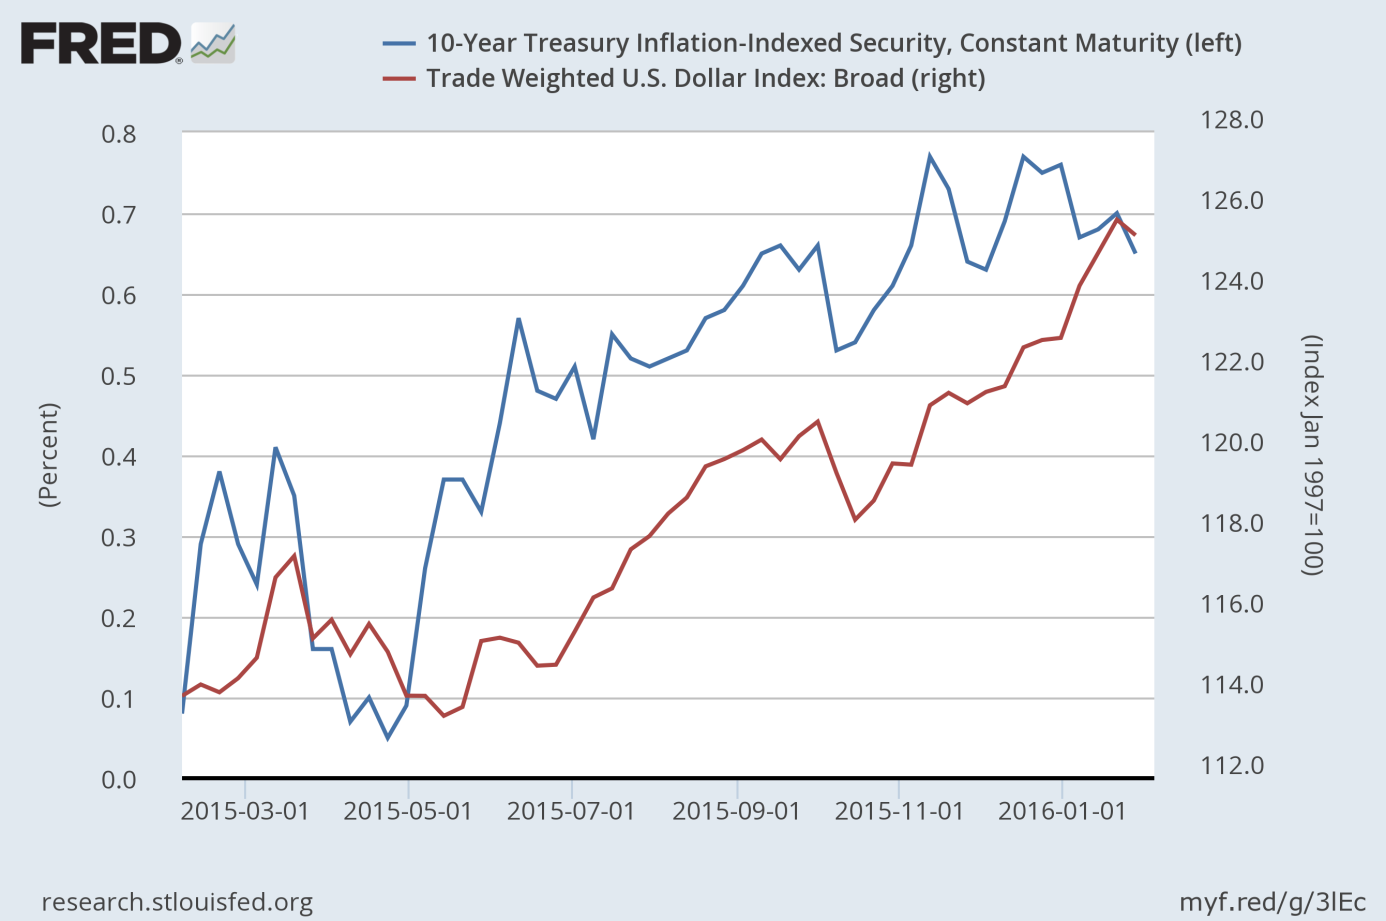
Last year, the gold price fell on the expectations of the Fed’s hike and the resulting appreciation of the U.S. dollar against major currencies, and on the rise in U.S. real interest rates. In January 2016, that situation reversed. The expectations of the Fed’s hike fell, resulting in the decline in U.S. real interest rates and the U.S. dollar setback (see the chart below).
Chart 2: U.S. real interest rates (blue line, left axis, yields on 10-year Treasury Inflation-Indexed Securities) and the U.S. dollar index (red line, right axis, Trade Weighted Broad U.S. Dollar Index) from 2015 to 2016.

The yellow metal shot up above the 200-day moving average, marking the first time this technical barrier has been broken since October.
Conclusions
To sum up, gold shined in January 2016. The rise in price of the yellow metal was mainly caused by market turmoil, which led to an increase in risk-aversion and the softened expectations of the Fed’s interest rate hikes in 2016. Thus, the gold market fundamentals have improved recently, as well as the technical situation (on Wednesday, the yellow metal jumped above the 200-day moving average), however, it is too early to announce a bull market. Gold got off to a tremendous start in 2012, 2014 and 2015, but ended each year badly. Therefore, the January rally should be taken with a pinch of salt.
Thank you.
Arkadiusz Sieron
Sunshine Profits‘ Gold News Monitor and Market Overview Editor
Gold News Monitor
Gold Trading Alerts
Gold Market Overview


