Last week, a few important U.S. economic reports were released. What do they imply for the gold market?
June Retail Sales and Gold
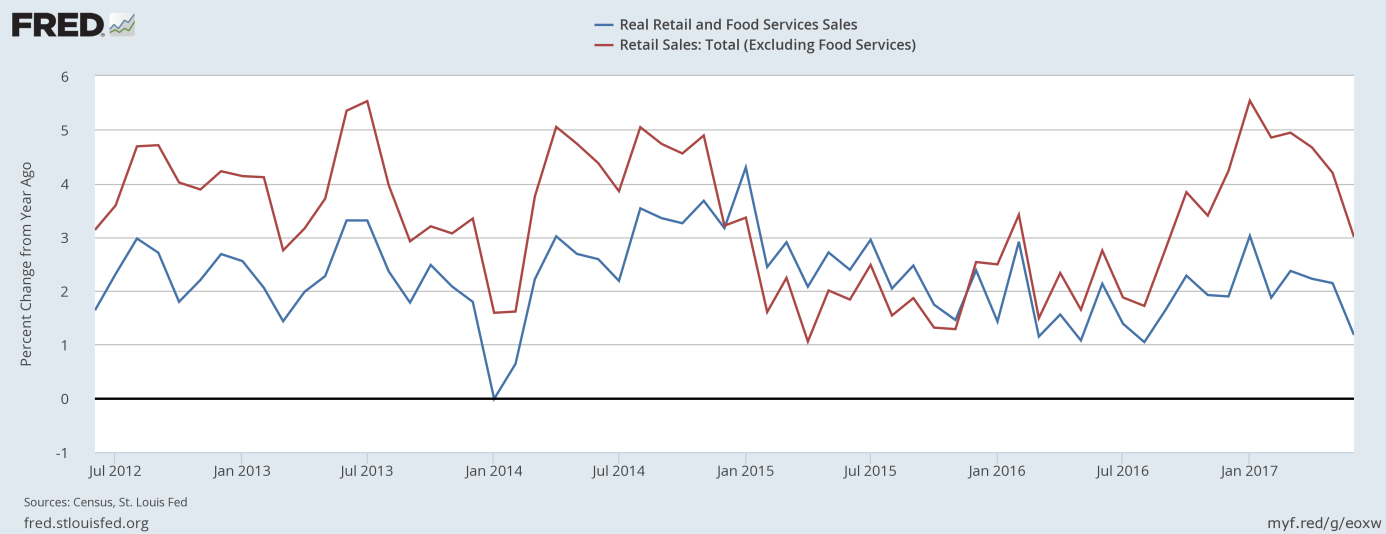
The recent days were eventful. Donald Trump Jr. revealed his controversial emails, Janet Yellen delivered her testimony before the Congress, and several important pieces of economic news were published. First of all, retail sales fell 0.2 percent in June following a 0.1 drop in May (after an upward revision). The number was below expectations, as analysts forecasted a 0.1 percent rise. Actually, it marked the second straight decline and the biggest decline of the year. As in the previous month, sales at gas stations posted the most severe plunge, down 1.3 percent. However, the weakness was widespread. Declines include food and beverage stores (-0.4 percent), department stores (-0.7 percent) and restaurants (-0.6 percent). And auto sales (as well as furniture and electronics & appliance) rose only 0.1 percent. On an annual basis, there is a clear slowdown, which started in January 2017, as one can see in the chart below.
Chart 1: Real retail sales and food services sales (blue line) and retail sales excluding food services (red line) year-over-year from June 2012 to June 2017.

The disappointing retail sales are good news for the gold market, as they suggest that the U.S. did not rebound strongly in the spring after weak growth in the first quarter. Indeed, the GDPNow model forecast for real GDP growth in the second quarter of 2017 declined from 2.6 percent to 2.4 percent after Friday’s retail sales report. Hence, the weak number may strengthen the dovish camp at the Fed, giving the U.S. central bank a reason to reassess the pace of its normalization. The market odds of a December hike declined further on Friday from 52.9 percent to 48.4 percent. This means that investors shifted their expectations of the interest rate hike from December 2017 to March 2018, which is a bullish factor for the yellow metal.
June CPI and Gold
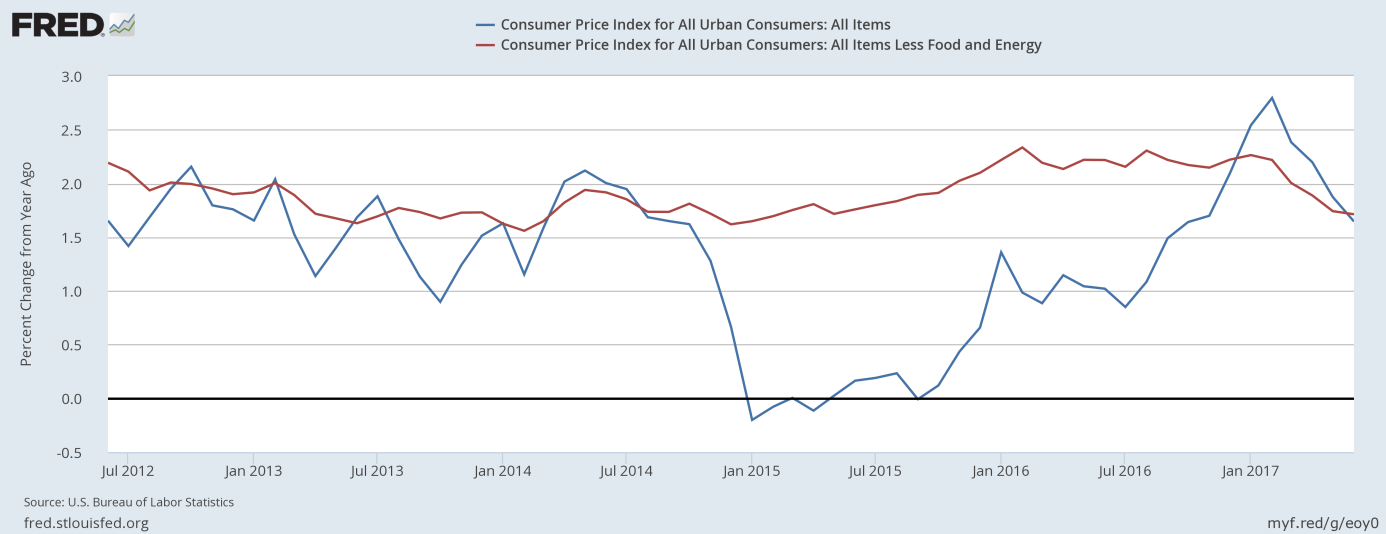
The CPI also fell short of expectations in June, as it was unchanged, while the core CPI rose just 0.1 percent. Analysts forecasted upward moves of 0.1 percent and 0.2 percent, respectively. As the chart below shows, inflation rose 1.6 percent on an annual basis, a slowdown from 1.9 percent in a previous month, while core inflation increased 1.7 percent year-over-year, unchanged from May. Hence, the recent surge in inflation has crested.
Chart 2: CPI (blue line) and core CPI (red line) year-over-year from June 2012 to June 2017.

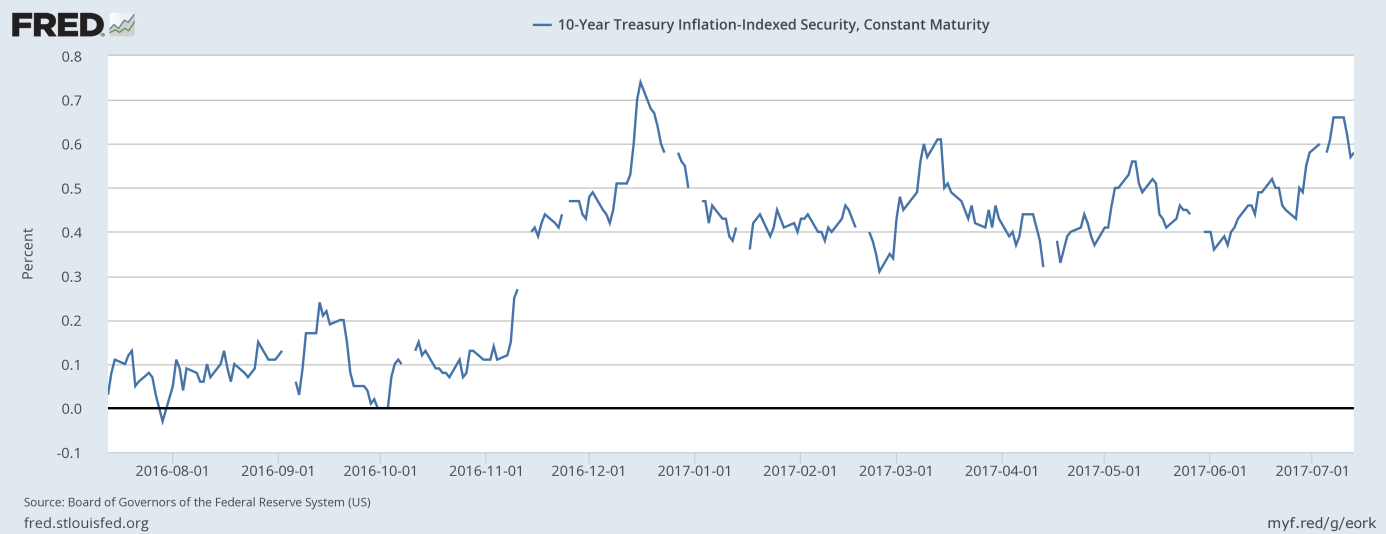
Soft inflation may renew the debate among the FOMC about the timing of its next increase in interest rates. Indeed, the argument about the temporary character of the slowdown in inflation is losing force. However, inflation is still importantly higher than one year ago, while the Fed seems to be determined to deliver one more hike this year, no matter the underlying data. On one hand, softer inflation is rather bad for gold, as it increases real interest rates, while not necessarily discouraging the Fed from tightening its monetary policy. On another, the recent bunch of the U.S. economic data clearly softened the expectations of the next Fed hike. In consequence, real interest rates declined last week, despite weak inflation, as one can see in the chart below.
Chart 3: Real interest rates (yield of a 10-year Inflation-Indexed Treasury) over the last year.

Other June Data, Conclusions and Gold
When it comes to other data, the recent Beige Book showed that there was a shortage of qualified workers in the U.S., but it did not translate into a rapid pace of wage inflation. Meanwhile, the industrial production rose 0.4 percent in June, according to the Fed. The jump was mainly driven by a 1.6 percent surge in mining output. It shows that the recession in mining is over.
Nevertheless, the recent U.S. economic data was disappointing, on balance. Inflationary pressures softened further, while retail sales were again weak. Such developments should support the price of gold. Indeed, as the chart below shows, gold prices surged after the releases of recent data.
Chart 4: Gold price over the three last days.

However, the rebound may be only temporary. There is plenty of time before the December FOMC meeting – and we believe that investors may underestimate the hawkishness of the Fed. Hence, although in the short run the direction for gold from here might be sideways to higher, we could see lower prices in the medium term. Stay tuned!
Disclaimer: Please note that the aim of the above analysis is to discuss the likely long-term impact of the featured phenomenon on the price of gold and this analysis does not indicate (nor does it aim to do so) whether gold is likely to move higher or lower in the short- or medium term. In order to determine the latter, many additional factors need to be considered (i.e. sentiment, chart patterns, cycles, indicators, ratios, self-similar patterns and more) and we are taking them into account (and discussing the short- and medium-term outlook) in our trading alerts.
Thank you.
Arkadiusz Sieron
Sunshine Profits‘ Gold News Monitor and Market Overview Editor
Gold News Monitor
Gold Trading Alerts
Gold Market Overview


