Retail sales rose 0.1 percent, while the CPI jumped 0.2 percent in November. What does it mean for the gold market?
Retail Sales and Gold
We understandably focused on the FOMC meeting last week. However, many important economic reports were released over the few last days. Let’s analyze them, starting with retail sales.
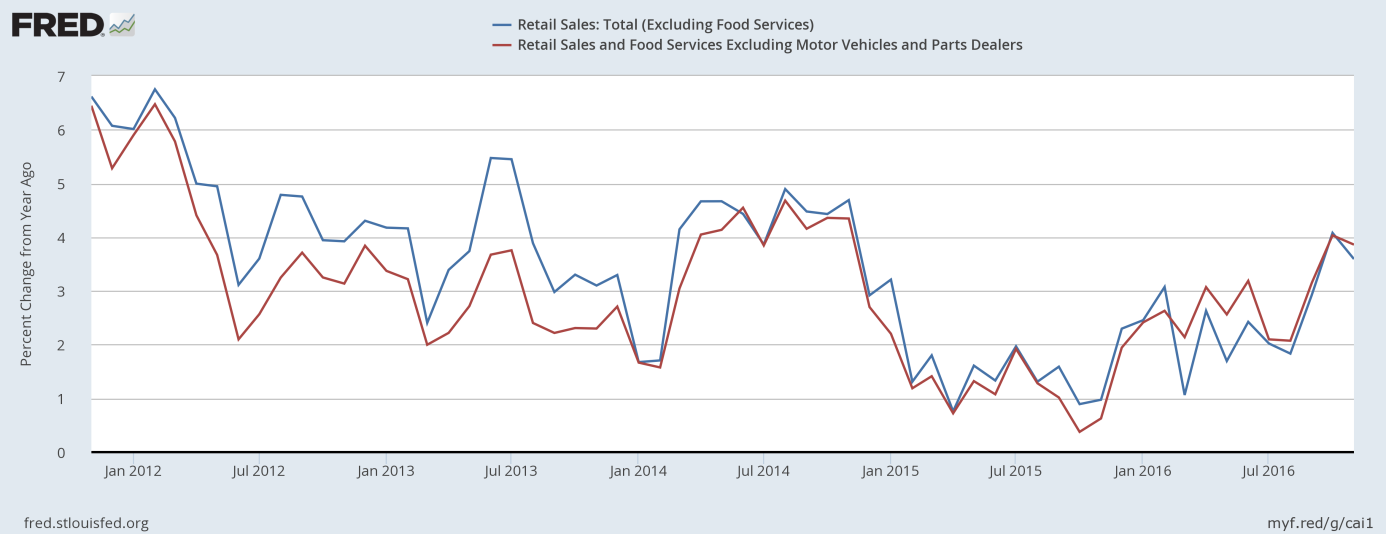
Sales at U.S. retailers increased just 0.1 percent last month, according to the U.S. Department of Commerce. The rise followed an 0.6 percent increase in October (after a downward revision from 0.8 percent) and fell short of expectations. The disappointing number was partially caused by a sharp drop in auto sales, which fell 0.5 percent. If they are excluded, the retail sales rose 0.2 percent, slightly better. On an annual basis, retail sales rose 3.8 percent. As one can see in the chart below, the annual pace of growth of retail sales slowed down in November a bit. It is not good news for the U.S. economy, so it should be positive for the gold prices. Indeed, the GDPNow model forecast for real GDP growth for the fourth quarter of 2016 declined from 2.6 to 2.4 after the release of the retail sales report.
Chart 1: Retail sales excluding food services (blue line) and retail and food services excluding motor vehicles and parts dealers (red line) as percent change from year ago, from November 2011 to November 2016.

CPI and Gold
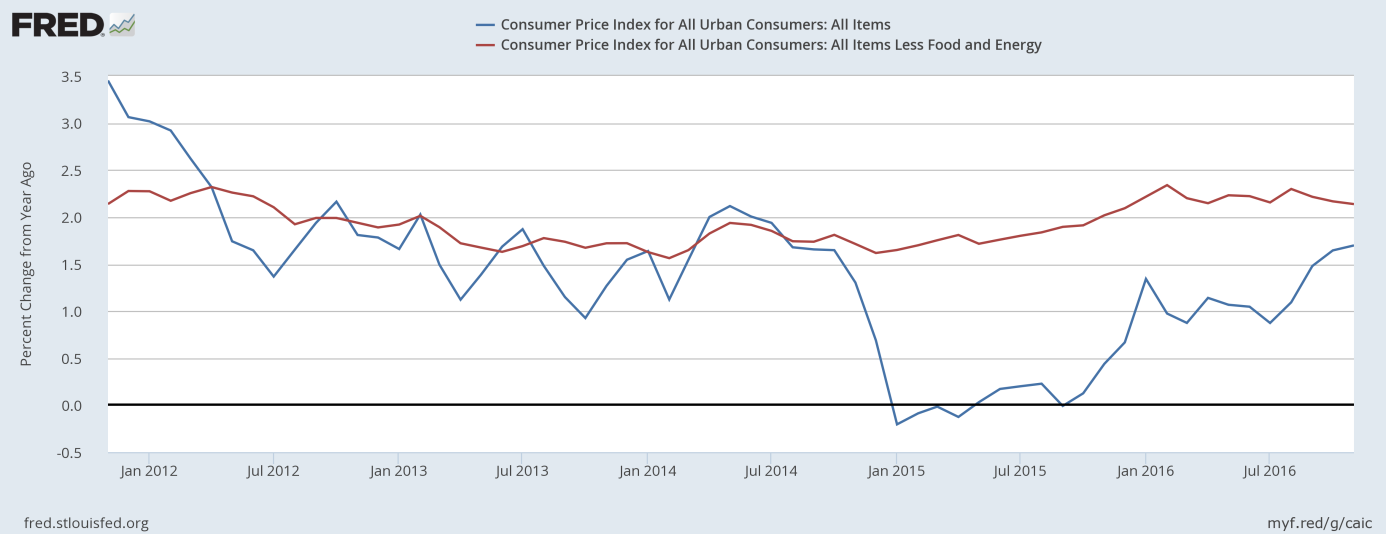
Consumer prices increased 0.2 percent last month, following a 0.4 percent rise in October, according to the Bureau of Labor Statistics. The jump was mainly driven by a 2.7 percent surge in gasoline prices. The core CPI increased 0.2 percent. On an annual basis, the index which excludes food and energy jumped 2.1 percent, while the overall CPI rose 1.7 percent, the largest gain in more than two years. As one can see in the chart below, the overall consumer inflation rate really accelerated over the last several months. The inflation rate rose from 0 percent in September 2015 to the current 1.7 percent. Although this surge was caused mainly by an increase in energy prices (the core CPI has been more stable), it should be welcomed by the Fed anyway, which is bad news for the gold bulls.
Chart 2: CPI (blue line) and core CPI (red line) year-over-year from November 2011 to November 2016.

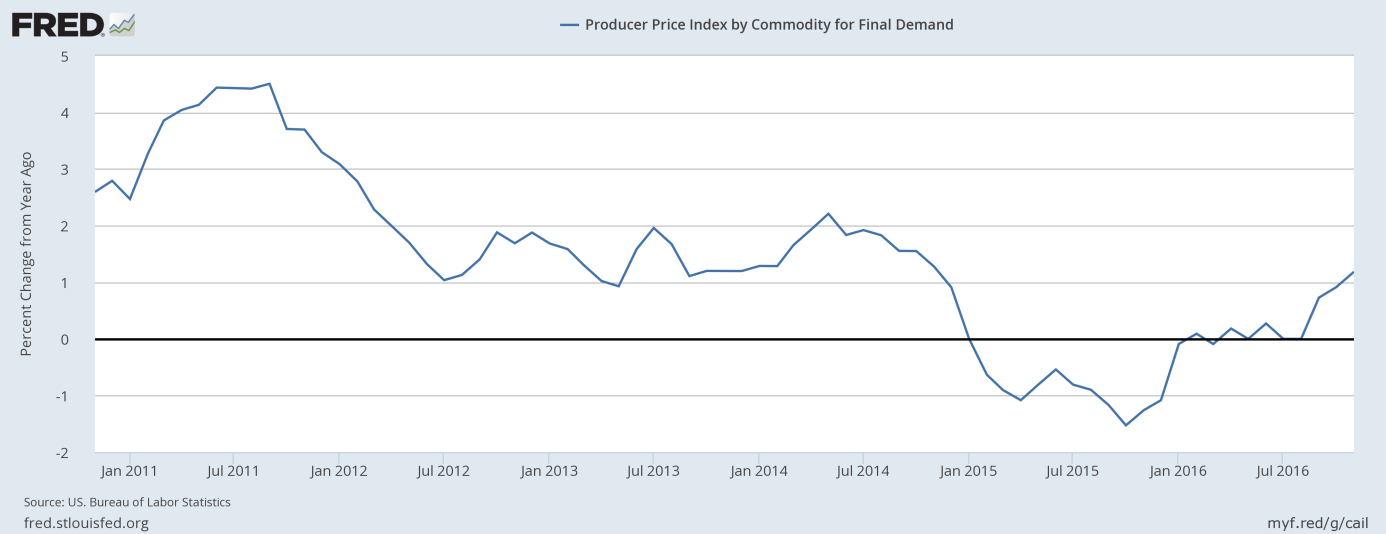
Moreover, U.S. wholesale prices jumped 0.4 percent on a monthly basis in November and they rose 1.3 percent over the last 12 months, the largest increase since the end of 2014, as one can see in the chart below. This rise is also not good for the gold market, as it strengthens the hawkish case for the Fed.
Chart 3: Producer Price Index for final demand from 2011 to 2016.

Other Data
When it comes to other data, industrial production fell 0.4 percent in November, the largest decline since March. On the other hand, the Philly Fed Index surged to 21.5 in December from 7.6 in the previous month, while the Empire State Index jumped from 1.5 to 9. It may signal the improved corporate mood after Trump’s victory. Moreover, the Markit Flash U.S. Manufacturing PMI hit a 21-month high in December at 54.2, which may signal a strong end of the year for domestic manufacturers. The confidence among home builders also rose after the presidential election. The NAHB/Well Fargo Housing Market Index jumped from 63 to 70 in December, much higher level than expected. However, housing starts plunged 18.7 percent in November, while building permits declined 4.7 percent.
Conclusions
The take-home message is that the recent U.S. economic data is rather mixed, but it remained solid enough to fuel optimism in the markets and to strengthen the hawkish case for the Fed. It is bad news for the gold bulls. However, it seems that what has recently improved were mainly the sentiment indices, but not necessarily the economic reality. Therefore, although the current sentiment is negative for the yellow metal, gold could shine again if the markets revise down their expectations of the positive economic effects of Trump’s policies.
Disclaimer: Please note that the aim of the above analysis is to discuss the likely long-term impact of the featured phenomenon on the price of gold and this analysis does not indicate (nor does it aim to do so) whether gold is likely to move higher or lower in the short- or medium term. In order to determine the latter, many additional factors need to be considered (i.e. sentiment, chart patterns, cycles, indicators, ratios, self-similar patterns and more) and we are taking them into account (and discussing the short- and medium-term outlook) in our trading alerts.
Thank you.
Arkadiusz Sieron
Sunshine Profits‘ Gold News Monitor and Market Overview Editor
Gold News Monitor
Gold Trading Alerts
Gold Market Overview


