

Briefly: In our opinion, full (150% of the regular full position) speculative short positions in gold, silver and mining stocks are justified from the risk/reward perspective.
Not much happened in the precious metals market yesterday despite a small bearish indication from gold stocks which failed to move higher even though gold did. Consequently, in today’s alert we will zoom out of the short-term events and focus on gold’s big chart. Its analysis will provide us with the intermediate and final targets for the yellow metal’s price.
Let’s take a closer look (charts courtesy of http://stockcharts.com).
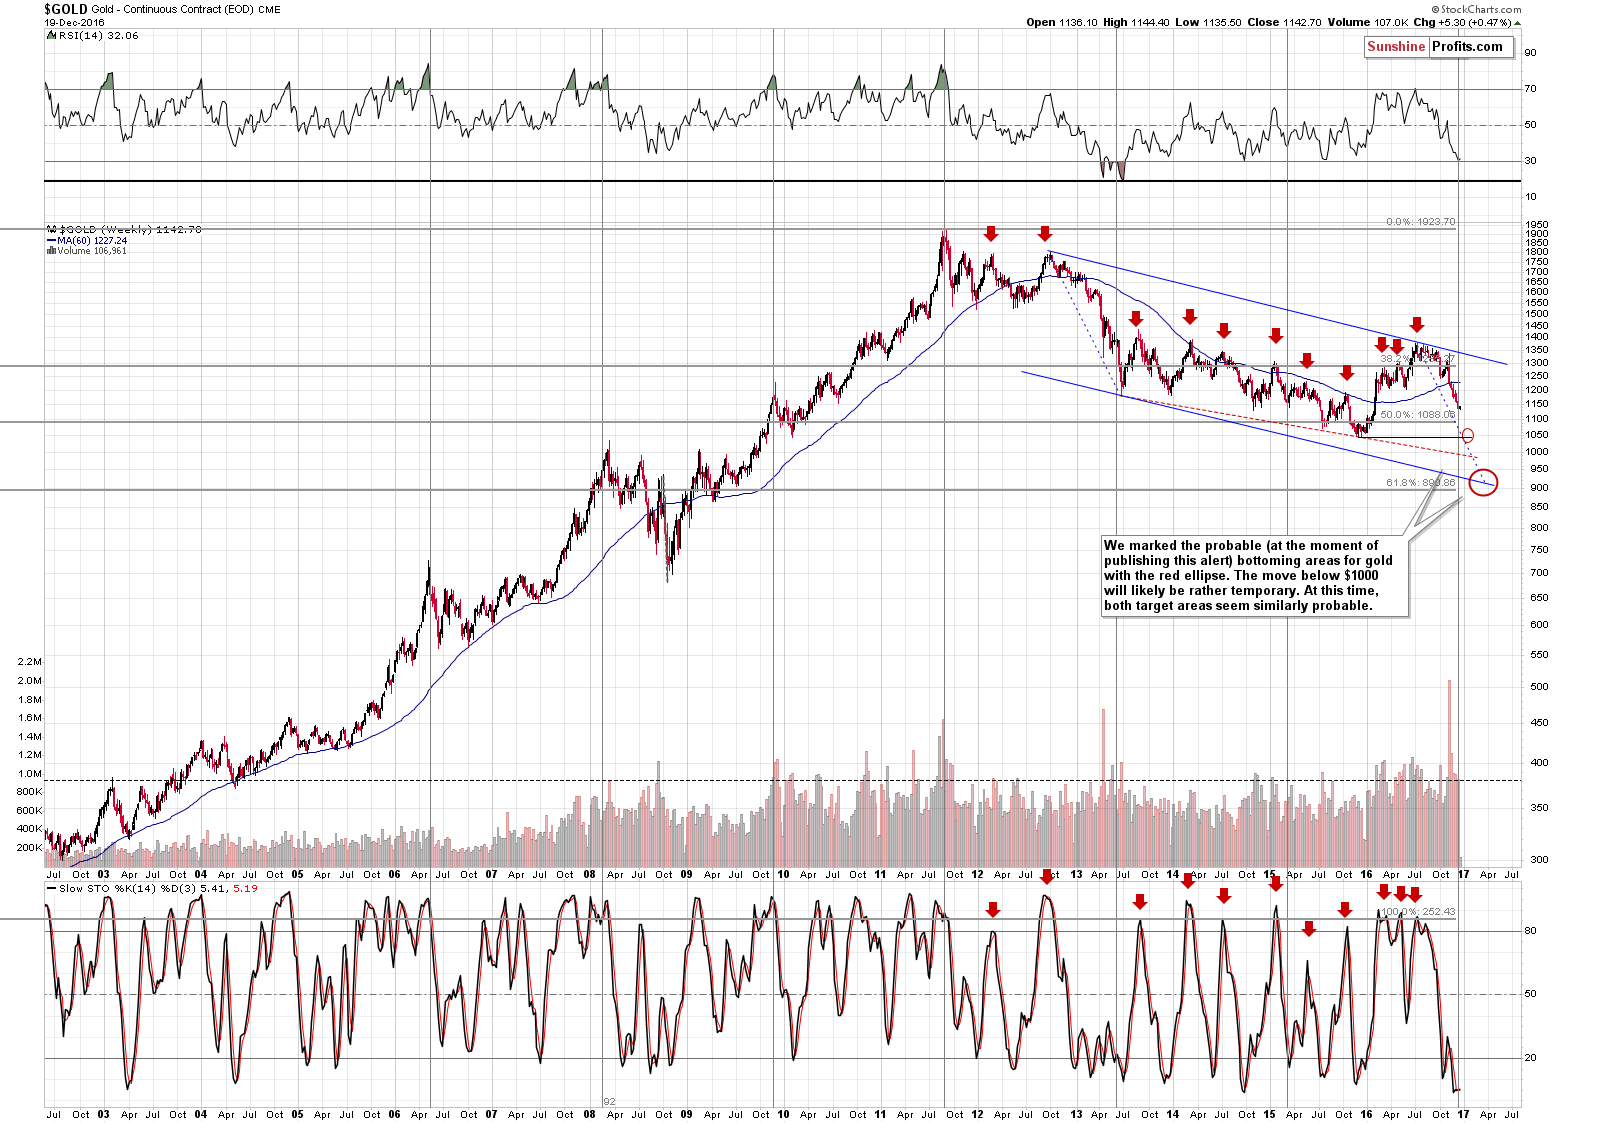
The shape of the recent price move (pace of the decline) and the RSI indicator both support the theory that the current decline is just like the 2013 decline. This analogy implies several things. Back in 2013, when the RSI moved to about 30, gold was still before its bottom (it bottomed – initially - once the RSI moved below 20) and it was right before the decline to the previous important bottom. It was the 2011 bottom that temporarily stopped the decline and we saw a quite sharp corrective upswing once it was hit. Is the above likely to take place also this time? It’s quite possible – not only do we have an important bottom at hand (the 2015 bottom), but reaching it in 1-3 weeks would mean that the pace of the current decline were at par with the 2013 one. Additionally, a local bottom at the 2015 bottom would also take place very close to the long-term cyclical turning point, which also makes it more probable.
How high could gold go after reaching the 2015 bottom – it’s a tough call right now, but the $1,100 - $1,150 area seems to be a quite likely target, with the lower border thereof being more likely. Why? Because it will be easy to view the next local bottom as a repeat of the 2015 bottom (prepare for the “double bottom is in” headlines) and back then gold initially moved a little above $1,100. However, we expect the similarity to both 2013 and 2015 bottom to end at that time – and only the similarity to the 2013 decline to continue, as it doesn’t seem that gold is hated enough to form a major bottom after moving only to its previous low.
As far as the “why is gold likely to move to new lows” issue is concerned, our previous comments on that matter remain up-to-date:
In short, because the gold market was not hated enough back in late 2015. Major tops and major bottoms are formed when everyone and their brother gets on a given side of the market. At the top, everyone wants to buy. At the bottom, everyone wants to sell and thinks that the price will fall much further. We’ve been monitoring surveys, predictions, headlines, website traffic, popularity of gold-related search terms in search engines and it doesn’t seem that gold is really hated enough for this to be the final bottom. Naturally, local tops and bottoms need to take place every now and then regardless of the bigger trend, as no market can move up or down in a straight line. There were local bottoms in 2013, in 2014 and in 2015. Why would the December 2015 bottom be THE bottom if it weren’t accompanied by extreme pessimism?
Some may say that the size of the rally that followed confirms that it was indeed the final bottom. We disagree – there were 2 very good reasons for this temporary upswing to be bigger than the previous ones – the NIRP remarks that were not followed by any NIRP-related action and the Brexit surprise (Brexit hasn’t really happened up to this day). If these events hadn’t happened, gold’s rally would have probably been no different than the previous local rallies that we saw in 2013, 2014 and earlier in 2015.
So, if the final bottom is not yet in, then where is gold likely to bottom? This is where technical levels come into play. We have two target areas – one is close to the $1,000 level and the second one is close to the $900 level. These targets will be updated as we move closer to them, but that’s what appears most likely at this moment. Why the former? A combination of a declining medium-term support line and $1,000 as a very round number provides good support. Why the second? There is one reason, but an extremely important one – the 61.8% Fibonacci retracement level. The Fibonacci retracement levels have proven to be a very useful tool in case of the precious metals market and the 61.8% retracement is one of the most important, classic ones. The other 2 (out of 3): the 38.2% retracement and the 50% retracement were already broken, so now the 61.8% retracement becomes a natural, very important target. The important thing is that as long as this level is not broken decisively and the breakdown is not confirmed, from the technical point of view, the entire 2011 – 2016/2017 decline will simply be a big correction after the 2000 – 2011 rally, and not a beginning of another bear market.
Summing up, it appears that we could see a corrective upswing once gold moves to its 2015 bottom and depending on the bullish confirmations that we may (!) see at that time, we may decide to take profits on the current short positions or even to very temporarily open a long position, but it’s too early to do any of the above at this time. Either way, it seems that the final bottom in the precious metals market will form below the 2015 low and we strongly suggest preparing for it.
As always, we will keep you – our subscribers – updated.
To summarize:
Trading capital (supplementary part of the portfolio; our opinion): Short positions (150% of the full position) in gold, silver and mining stocks are justified from the risk/reward perspective with the following stop-loss orders and initial target price levels:
- Gold: initial target price: $1,006; stop-loss: $1,183; initial target price for the DGLD ETN: $88.88; stop-loss for the DGLD ETN $58.77
- Silver: initial target price: $13.12; stop-loss: $17.53; initial target price for the DSLV ETN: $46.18; stop-loss for the DSLV ETN $24.86
- Mining stocks (price levels for the GDX ETF): initial target price: $9.34; stop-loss: $22.62; initial target price for the DUST ETF: $143.56; stop-loss for the DUST ETF $41.88
In case one wants to bet on junior mining stocks' prices (we do not suggest doing so – we think senior mining stocks are more predictable in the case of short-term trades – if one wants to do it anyway, we provide the details), here are the stop-loss details and initial target prices:
- GDXJ ETF: initial target price: $14.13; stop-loss: $38.12
- JDST ETF: initial target price: $104.26; stop-loss: $28.88
Long-term capital (core part of the portfolio; our opinion): No positions (in other words: cash)
Insurance capital (core part of the portfolio; our opinion): Full position
Plus, you might want to read why our stop-loss orders are usually relatively far from the current price.
Please note that a full position doesn’t mean using all of the capital for a given trade. You will find details on our thoughts on gold portfolio structuring in the Key Insights section on our website.
As a reminder – “initial target price” means exactly that – an “initial” one, it’s not a price level at which we suggest closing positions. If this becomes the case (like it did in the previous trade) we will refer to these levels as levels of exit orders (exactly as we’ve done previously). Stop-loss levels, however, are naturally not “initial”, but something that, in our opinion, might be entered as an order.
Since it is impossible to synchronize target prices and stop-loss levels for all the ETFs and ETNs with the main markets that we provide these levels for (gold, silver and mining stocks – the GDX ETF), the stop-loss levels and target prices for other ETNs and ETF (among other: UGLD, DGLD, USLV, DSLV, NUGT, DUST, JNUG, JDST) are provided as supplementary, and not as “final”. This means that if a stop-loss or a target level is reached for any of the “additional instruments” (DGLD for instance), but not for the “main instrument” (gold in this case), we will view positions in both gold and DGLD as still open and the stop-loss for DGLD would have to be moved lower. On the other hand, if gold moves to a stop-loss level but DGLD doesn’t, then we will view both positions (in gold and DGLD) as closed. In other words, since it’s not possible to be 100% certain that each related instrument moves to a given level when the underlying instrument does, we can’t provide levels that would be binding. The levels that we do provide are our best estimate of the levels that will correspond to the levels in the underlying assets, but it will be the underlying assets that one will need to focus on regarding the signs pointing to closing a given position or keeping it open. We might adjust the levels in the “additional instruments” without adjusting the levels in the “main instruments”, which will simply mean that we have improved our estimation of these levels, not that we changed our outlook on the markets. We are already working on a tool that would update these levels on a daily basis for the most popular ETFs, ETNs and individual mining stocks.
Our preferred ways to invest in and to trade gold along with the reasoning can be found in the how to buy gold section. Additionally, our preferred ETFs and ETNs can be found in our Gold & Silver ETF Ranking.
As always, we'll keep you - our subscribers - updated should our views on the market change. We will continue to send out Gold & Silver Trading Alerts on each trading day and we will send additional Alerts whenever appropriate.
The trading position presented above is the netted version of positions based on subjective signals (opinion) from your Editor, and the Tools and Indicators.
As a reminder, Gold & Silver Trading Alerts are posted before or on each trading day (we usually post them before the opening bell, but we don't promise doing that each day). If there's anything urgent, we will send you an additional small alert before posting the main one.
=====
Latest Free Trading Alerts:
Yesterday, there was a truck attack in Berlin, while Russia’s ambassador to Turkey was assassinated in Ankara. What do these tragic events mean for the gold market?
Will Attacks in Berlin and Ankara Boost Gold?
=====
Hand-picked precious-metals-related links:
Palladium Expected To Outperform Platinum In 2017
Meet This Year's Best Materials ETF
=====
In other news:
U.S. has 'strongest job market in nearly a decade,' says Janet Yellen
Markets Are Going to Roil Next Year
BOJ upbeat on economy, Kuroda shrugs off talk of rate hike
Scots Declare Brexit Red Lines After Renewed Independence Threat
Oil steady in timid trade ahead of holiday season
=====
Thank you.
Sincerely,
Przemyslaw Radomski, CFA
Founder, Editor-in-chief, Gold & Silver Fund Manager
Gold & Silver Trading Alerts
Forex Trading Alerts
Oil Investment Updates
Oil Trading Alerts

