Briefly: in our opinion, full (250% of the regular size of the position) speculative short position in gold, silver, and mining stocks is justified from the risk/reward perspective at the moment of publishing this Alert.
The more things change, the more they stay the same. Or how Heraclitus used to say it, “change is the only constant in life”. He probably never thought that his quote could be applied to the precious metals market and its short-term price swings about 2500 years later. But that’s precisely the case. Gold rallied yesterday and it’s all in tune with the bigger picture. And that picture tells us that something very interesting, and even more profitable is about to happen soon.
As always, the context is critical when determining the real meaning of a given price move. In yesterday’s analysis, we emphasized that the key observation and implications for gold is that it didn’t soar despite Fed’s uber-dovish stance that surprised the market. Indeed, gold should have rallied more than $50 and even taking yesterday’s $10 upswing (most of which is already erased in today’s pre-market trading) the strength of reaction is rather pathetic.
That’s what we can infer from the reaction to the fundamental news. Let’s check how much gold’s upswing has changed from the technical point of view. We’ll look at it from both: stand-alone basis, and when considering it relative to gold’s performance in 2012.
Putting Gold Performance Into Perspective
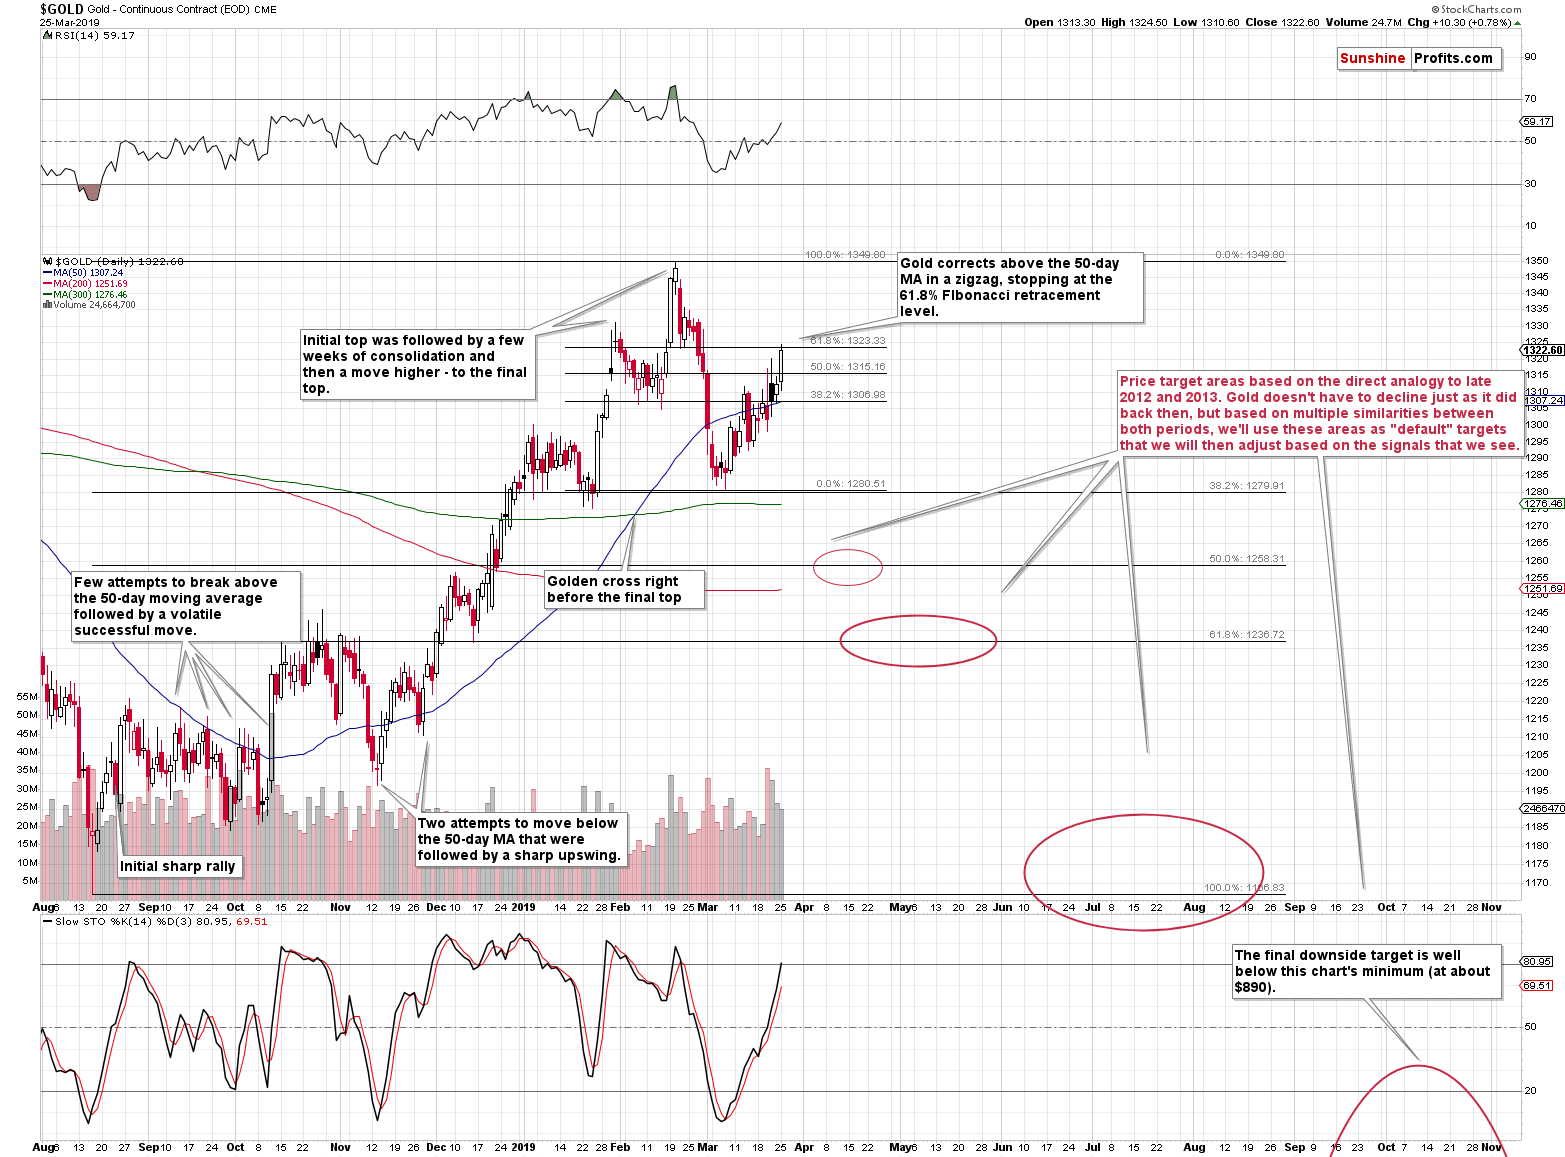
Starting with the former, we see that gold moved higher, and that it closed the session above the most recent intraday high. It didn’t soar substantially above the previous intraday high, though – only about $4 higher. The move seemed substantial in terms of the closing prices, but it actually didn’t take gold above its final of the classic retracement levels – the 61.8% Fibonacci retracement. This means that, technically, the entire March correction is nothing more than just that – a correction.
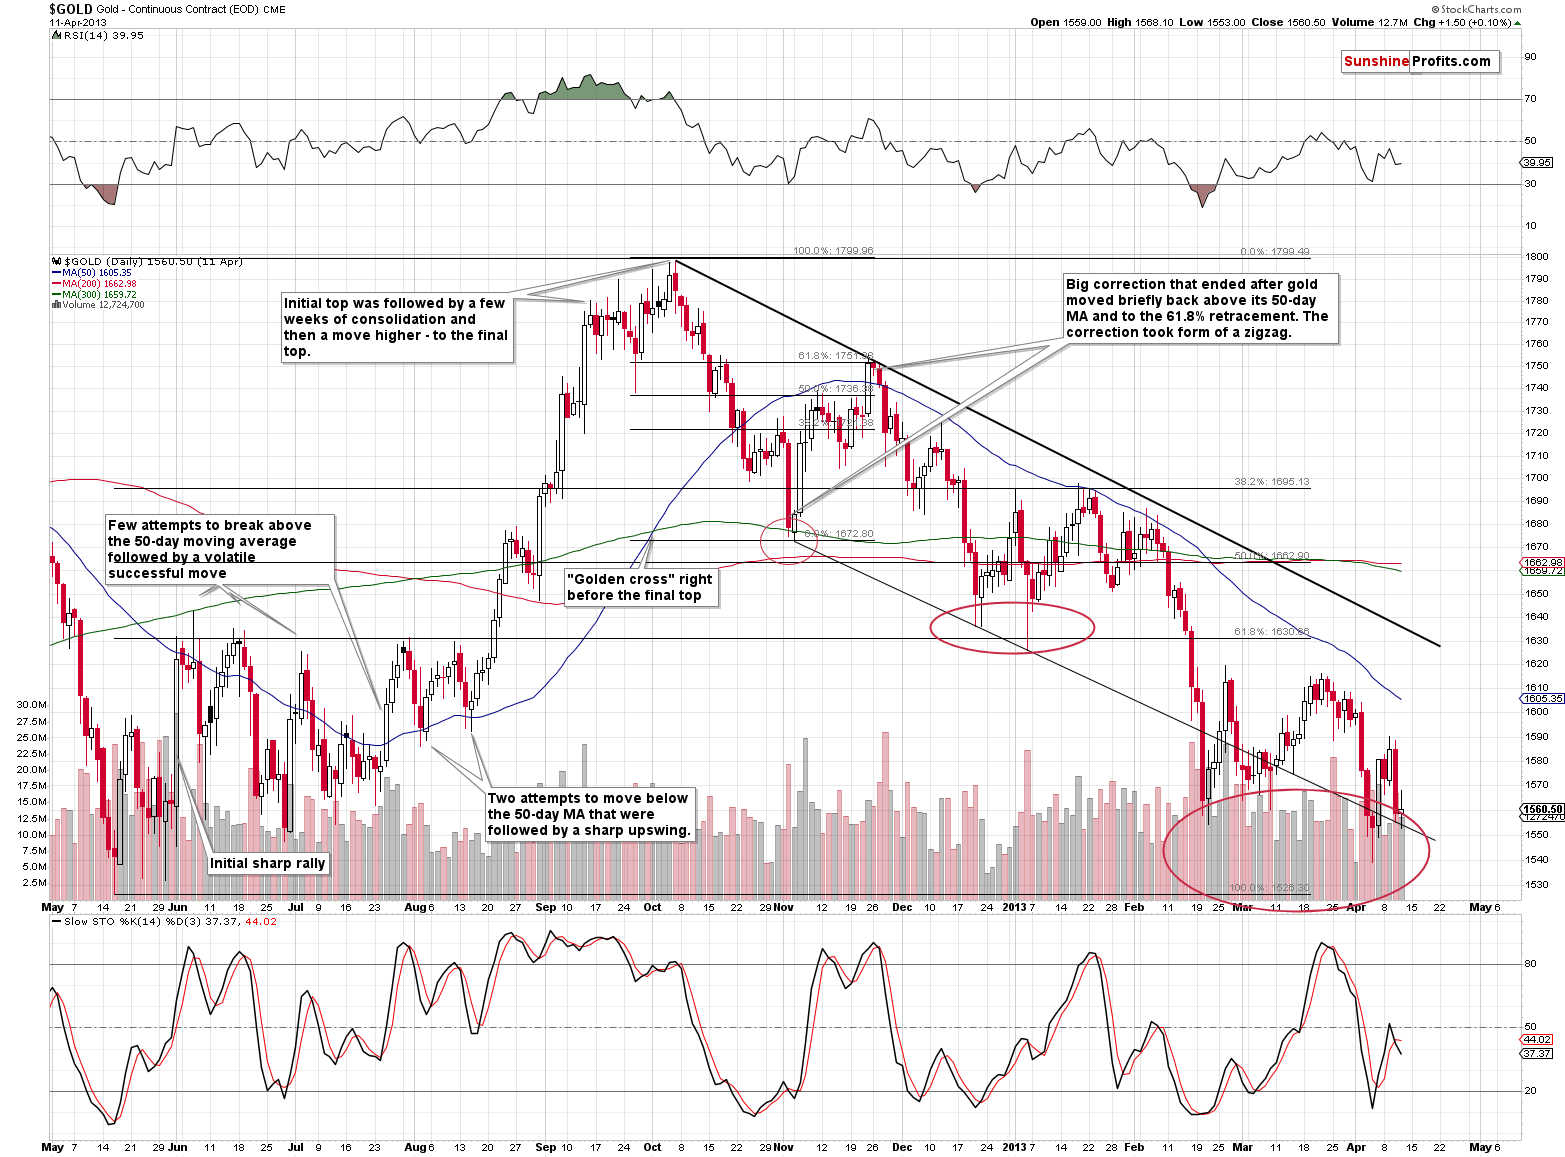
What about the link to the 2012-2013 price moves? Did yesterday’s upswing invalidate it?
Absolutely not. Conversely, what seems to have been a “change” in gold’s behavior, was actually in perfect tune with what we saw in the final days of November 2012. Gold topped right at the 61.8% Fibonacci retracement based on the previous short-term upswing. That’s when gold started the near-term decline to the 61.8% retracement based on the previous medium-term upswing. This corresponds to about $1,240 right now, and it seems that the short-term decline to this level has just begun. Gold is already over $5 lower in today’s pre-market trading, and if the analogy is to continue, gold’s pace of decline should accelerate in the following days. In yesterday’s Alert, we wrote that the reversal for the mining stocks is here, and given today’s pre-market decline and the points made above, it seems that we were early by just a few hours.
We would like to emphasize one important point about the late November 2012 top in gold that is very similar to the current one. Namely, we have never seen higher gold prices than the ones at that particular top.
This means that everyone who waited to either exit their long positions, or enter short ones, was never able to make transactions at better prices. If the history is repeating itself, it’s the worst possible moment to exit the short positions.
Summary
Summing up, it’s almost certain that the next big move lower has already begun and that the 2013-like slide is in its early stage. Based on the updated version of the 2013-now link, the implications are even more bearish than we had initially assumed. The downside target for gold remains intact ($890), and the corrective upswing that we just saw seems to be rather natural part of the bigger move lower – not a beginning of an important move higher. And it seems that the corrective move higher in the PMs is either over or about to be over shortly. Gold’s very weak reaction to Fed’s surprisingly dovish remarks strongly confirms the bearish outlook for the following weeks.
As we explained on Friday, if gold declines to $1,240, this might be an opportunity to go long, but it’s too early to say for sure at this time.
To summarize:
Trading capital (supplementary part of the portfolio; our opinion): Full short position (250% of the full position) in gold, silver, and mining stocks is justified from the risk/reward perspective with the following stop-loss orders and exit profit-take price levels:
- Gold: profit-take exit price: $1,062; stop-loss: $1,357; initial target price for the DGLD ETN: $82.96; stop-loss for the DGLD ETN $39.87
- Silver: profit-take exit price: $12.32; stop-loss: $16.44; initial target price for the DSLV ETN: $47.67; stop-loss for the DSLV ETN $23.68
- Mining stocks (price levels for the GDX ETF): profit-take exit price: $13.12; stop-loss: $24.17; initial target price for the DUST ETF: $76.87; stop-loss for the DUST ETF $15.47
Note: the above is a specific preparation for a possible sudden price drop, it does not reflect the most likely outcome. You will find a more detailed explanation in our August 1st Alert. In case one wants to bet on junior mining stocks’ prices (we do not suggest doing so – we think senior mining stocks are more predictable in the case of short-term trades – if one wants to do it anyway, we provide the details), here are the stop-loss details and target prices:
- GDXJ ETF: profit-take exit price: $17.52; stop-loss: $35.67
- JDST ETF: initial target price: $143.87 stop-loss: $30.97
Long-term capital (core part of the portfolio; our opinion): No positions (in other words: cash)
Insurance capital (core part of the portfolio; our opinion): Full position
Important Details for New Subscribers
Whether you already subscribed or not, we encourage you to find out how to make the most of our alerts and read our replies to the most common alert-and-gold-trading-related-questions.
Please note that the in the trading section we describe the situation for the day that the alert is posted. In other words, it we are writing about a speculative position, it means that it is up-to-date on the day it was posted. We are also featuring the initial target prices, so that you can decide whether keeping a position on a given day is something that is in tune with your approach (some moves are too small for medium-term traders and some might appear too big for day-traders).
Plus, you might want to read why our stop-loss orders are usually relatively far from the current price.
Please note that a full position doesn’t mean using all of the capital for a given trade. You will find details on our thoughts on gold portfolio structuring in the Key Insights section on our website.
As a reminder – “initial target price” means exactly that – an “initial” one, it’s not a price level at which we suggest closing positions. If this becomes the case (like it did in the previous trade) we will refer to these levels as levels of exit orders (exactly as we’ve done previously). Stop-loss levels, however, are naturally not “initial”, but something that, in our opinion, might be entered as an order.
Since it is impossible to synchronize target prices and stop-loss levels for all the ETFs and ETNs with the main markets that we provide these levels for (gold, silver and mining stocks – the GDX ETF), the stop-loss levels and target prices for other ETNs and ETF (among other: UGLD, DGLD, USLV, DSLV, NUGT, DUST, JNUG, JDST) are provided as supplementary, and not as “final”. This means that if a stop-loss or a target level is reached for any of the “additional instruments” (DGLD for instance), but not for the “main instrument” (gold in this case), we will view positions in both gold and DGLD as still open and the stop-loss for DGLD would have to be moved lower. On the other hand, if gold moves to a stop-loss level but DGLD doesn’t, then we will view both positions (in gold and DGLD) as closed. In other words, since it’s not possible to be 100% certain that each related instrument moves to a given level when the underlying instrument does, we can’t provide levels that would be binding. The levels that we do provide are our best estimate of the levels that will correspond to the levels in the underlying assets, but it will be the underlying assets that one will need to focus on regarding the signs pointing to closing a given position or keeping it open. We might adjust the levels in the “additional instruments” without adjusting the levels in the “main instruments”, which will simply mean that we have improved our estimation of these levels, not that we changed our outlook on the markets. We are already working on a tool that would update these levels on a daily basis for the most popular ETFs, ETNs and individual mining stocks.
Our preferred ways to invest in and to trade gold along with the reasoning can be found in the how to buy gold section. Additionally, our preferred ETFs and ETNs can be found in our Gold & Silver ETF Ranking.
As a reminder, Gold & Silver Trading Alerts are posted before or on each trading day (we usually post them before the opening bell, but we don't promise doing that each day). If there's anything urgent, we will send you an additional small alert before posting the main one.
Thank you.
Sincerely,
Przemyslaw Radomski, CFA
Editor-in-chief, Gold & Silver Fund Manager


