tools spotlight

-
The Cue from USDX That Gold Didn't Take
December 16, 2019, 7:35 AMIn Friday's Alert, we warned that gold and USD movement in the next few days might be a bit chaotic due to the geopolitical news that are currently hitting the markets. The new steps in the Brexit saga and the U.S.-China agreement continue to support intraday volatility. It's relatively normal and once the dust settles a bit, the markets are likely to return to their previous trends. In case of the gold market, this means a move lower. The short-term decline might not last long before we see another corrective upswing, though.
The reasons are most clear in case of silver.
The Thorough Examination of Silver

First of all, silver broke below the rising support line that's based on 4 lows - the May low and three November lows. The white metal didn't manage to break back above this line, which means that the decline is likely to continue.
Having said that, let's focus on the three characteristics of a decline: its starting point, its ending point, and its shape.
The starting point is likely to take place early this week, perhaps even today. How do we know that it's likely? Because of the triangle-vertex-based turning point that's just around the corner. This technique proved to be useful many times in many parts of the precious metals market, also in silver when it reversed earlier this month. So, the next silver slide is likely just around the corner.
The ending point could be marked by the second triangle-vertex-based reversal happening right before Christmas that we see on the chart. These reversals could work on a near-to basis, so let's say that the next week or the final week of the year are likely to include the next major reversal. That's in tune with reversals on other charts, including gold's long-term chart.
This doesn't leave much time for the decline to take place, but... that's where point number 3 comes in. The shape of the decline. Silver is known for (at least it should be known for) its fake breakouts and volatile declines. The latter means that seeing a quick decline shortly would not only not be odd - it would actually be in tune with the way silver declined previously. The September decline, the November decline, even the early-December decline - they all happened fast. Silver dropped decisively and quickly. As history tends to rhyme, it seems that we might see yet another show of silver's bearish volatility shortly.
Do other parts of the precious metals market confirm this outlook? Let's check.
The Short-Term Across PMs

Gold hasn't done anything to invalidate the previously bearish outlook. In terms of the closing prices, gold topped on December 3, which is when we took profits from our previous long position. It hasn't closed higher ever since, even though it had a very good reason to. Namely, the USD Index declined profoundly since that time.
The context is always the king and this time, the action in the USD Index completely changes the implications of gold's sideways trading. If the USDX was rallying and gold was refusing to decline, it would have been bullish. But that's not what has been taking place. Gold has been reported to consistently refuse to soar despite sliding USD. That's profoundly bearish for the short term.
The mining stocks provide us with yet another confirmation.

This confirmation comes from the volume. It was extremely low. In general, whenever something rises on very low volume, it's actually a bearish sign, because it shows that the market doesn't really support this kind of move, and is rather forced to react in a given way. In case of mining stocks, it was probably a reaction to a sharp slide in the USD Index and a new high in the general stock market.
We haven't seen volume this low in months. The last time when the GDX moved higher on a similarly low volume, was in late July. And what happened immediately thereafter? Miners plunged. Yes, they came back shortly thereafter, but the immediate reaction was very negative. This perfectly fits the implications of gold and silver charts.
The dynamics of other precious metals' sectors are far from the only defining element in gold price development. USD Index moves are another important piece of the puzzle. This is what the full version of the analysis covers - just as it features the key factors at play and the targets of our promising short position. We encourage you to join our subscribers and reap the rewards. Subscribe today!
-
Where Is the Gold Rally That Could Have Been?
December 13, 2019, 7:50 AMWe started yesterday's analysis with the discussion of support levels in the USD Index and we stated that USD's breakdown below the rising support line and the neck level of the head-and-shoulders pattern is both: likely to happen, and likely to cause gold to slide. That's exactly what happened. The breakdowns were invalidated, and gold responded with a sizable intraday decline. But what happened in the following hours was even more important.
The Immediate USDX-Gold Developments
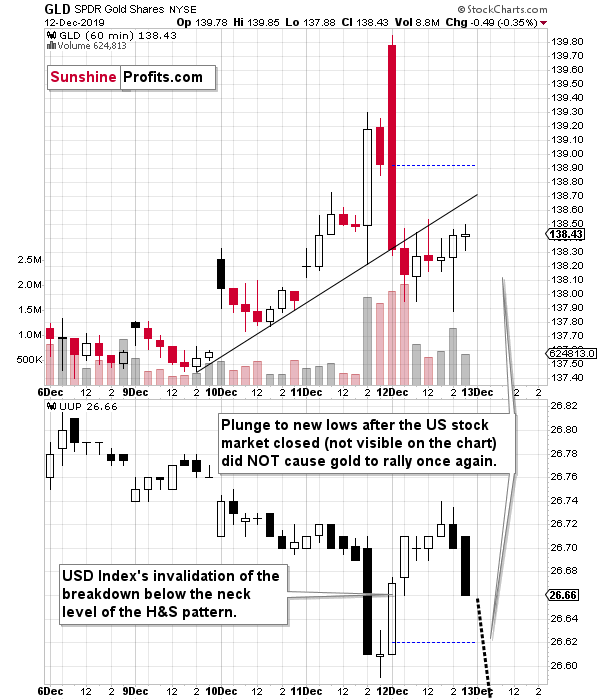
The above chart shows what happened in GLD and UUP ETFs in the last couple of days. Each candlestick represents one hour of trading. GLD is a proxy for gold, and the UUP is a proxy for the USD Index. We used these proxies, as the chart provider doesn't have the intraday charts for the USDX or gold futures, and the ETFs clearly show what we want to tell you.
The important thing is what happened, when, and what didn't happen at all. We already wrote what happened - gold erased the early gains (and then declined some more) as the USD Index invalidated its breakdown. USD Index's intraday high was 97.52 - well above what we described as the critical level (97.25).
But then...
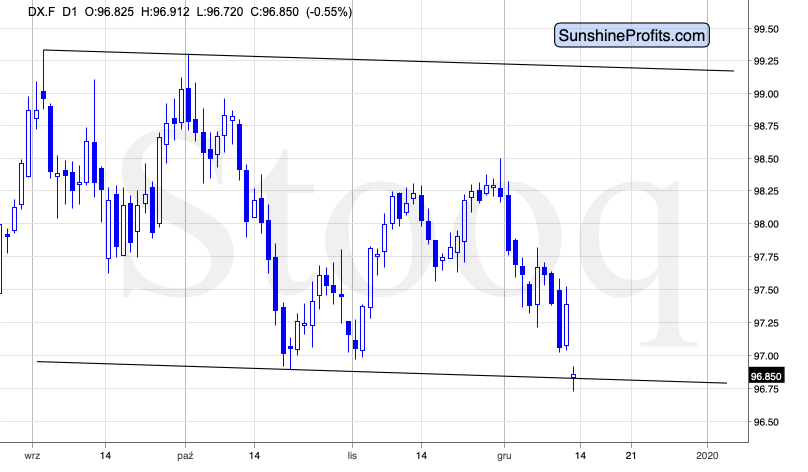
Then the USD Index declined profoundly, breaking below all the above-mentioned support levels and even the October lows. One would expect gold to soar in such a case, right?
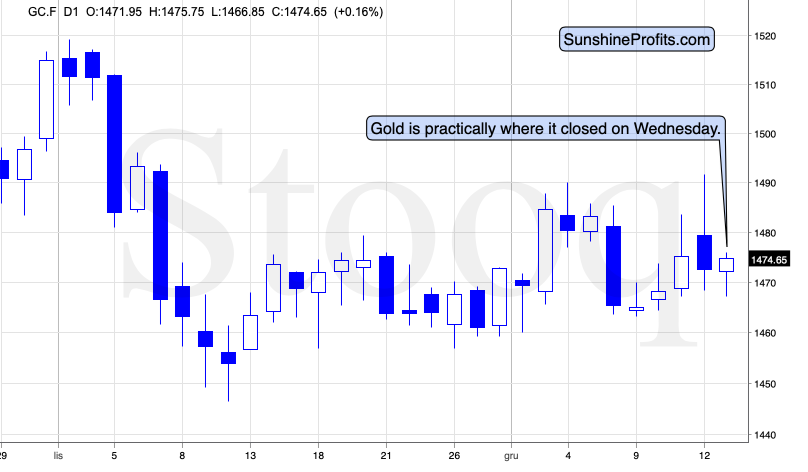
Gold practically ignored the USDX slide. If there ever was a perfect example of what gold's underperformance looks like - that's it.
Gold did follow the USD Index from the immediate-term point of view, but USD's slide (bullish factor for gold) was mostly ignored, while USD's comeback (bearish factor for gold) was mostly magnified.
The overall effect of seeing the above over and over again is that the USD Index is significantly lower than at the beginning of the month (almost 2 index points), but gold is barely up. Actually, just a few hours before writing these words, gold was below the November closing price.
This underperformance is even clearer on the chart below.
The USDX-Gold Dynamics
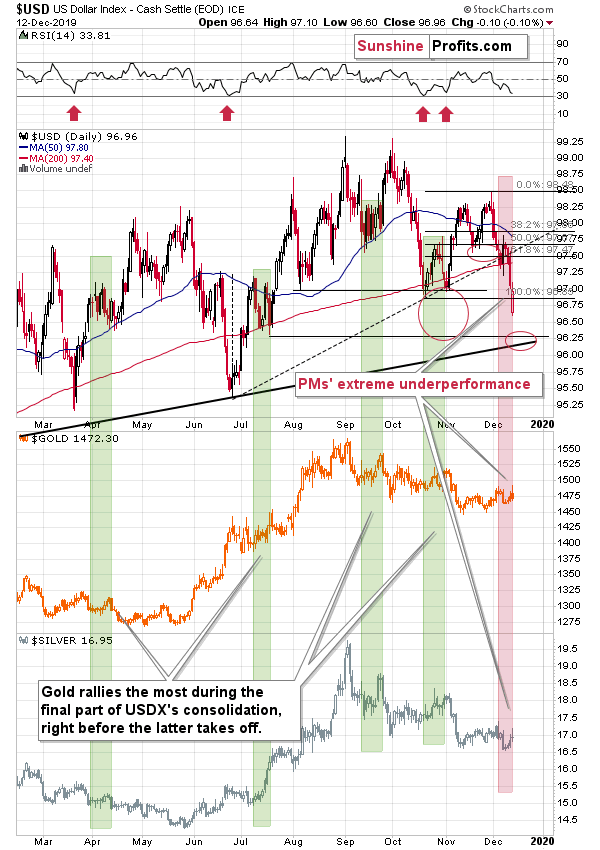
We have the same kind of non-reaction in silver. The white metal is below the November closing price. And that's very bearish for the following weeks.
Given this kind of weakness, gold and silver are poised to decline strongly indeed once the USD Index truly bottoms and then starts soaring back. And once the USD Index moves to its previous highs - and then above them - gold will be trading tens - or more likely - hundreds of dollars lower.
In the next few days, gold's and USD's performance might be a bit chaotic, though. The reason is the fact that likely triggered the moves - the outcome of the UK vote which made it likely that the Brexit would take place after all. This removed a lot of uncertainty from the market, which caused the British pound to soar and the USD Index to decline. This might be nothing more than an initial reaction to the drop in uncertainty, and a different course of action could follow. British pound could decline based on Brexit indeed happening, and the USD could gain as the safe-haven currency. We're not saying that it will happen, we're just saying that it might happen and it's difficult to say how the very near term will look like in case of the British Pound and the USD Index at least from my point of view. There are trading opportunities in other currency pairs, though.
Our profitable long precious metals position has been closed last week, and we've entered another trade immediately. This time, on the short side of the market, and it's profitable again. The full version of this analysis features updated gold outlook assessment, key factors at play and the targets of the profitable short position. Join us and profit along!
-
The USDX Battle for 97.25 and Its Implications for Gold
December 12, 2019, 6:23 AMThe USD Index took a dive yesterday and the precious metals sector rallied in response. USD's decline took it well below previous December lows and almost to its October lows.
USD Index in Hot Water

At the same time, the U.S. currency broke below two short-term support lines: the rising line based on the October and November lows, and the declining line based on the mid-November and early-December lows.
Based on the shape of the recent price movement, the declining support line is also the neck of the bearish head and shoulders pattern. Breakdown below it is therefore very bearish for the short term... If the breakdown is confirmed.
This might not be the case, because both above-mentioned support lines crossed several hours ago and the USD Index stopped declining approximately at that time. What does it mean? It means that the USDX might have just bottomed at its triangle-vertex-based reversal. It is usually the case that these reversals are based on support and resistance lines, but they can just as well be based on two support lines or two resistance lines.
If the USD Index has indeed reversed its course, then it would quite likely invalidate both above-mentioned breakdowns. Invalidation of breakdowns would be a very powerful bullish sign for the following days.
The critical price level above which the USD Index would need to get back above is 97.25. This would open the way to a strong rally from the current levels. And it would kick the door open for a sizable precious metals decline.
Our profitable long precious metals position has been closed last week, and we've entered another trade immediately. This time, on the short side of the market, and despite yesterday's move higher, it's profitable again. And the upswing gives us the added benefit of pinpointing the upcoming turning points. That's what the full version of this analysis features - you'll find there all the key short-term PMs market action coupled with the targets of the already-profitable short position. Join us and profit along!
-
The Miner's (Non)Reversal
December 11, 2019, 7:09 AMGold's cyclical turning point is here, and gold is still in the pause mode instead of declining (or rallying) profoundly. But during yesterday's session, miners first tested the previous December lows and then rallied, closing right at the 50-day moving average. Does this reversal - along with gold's turning point - indicate a major turnaround?
We doubt that.

The volume that accompanied yesterday's "reversal" was low, which means that it was not a true reversal. The bulls didn't engage the bears in a fierce fight, because there was none. It was a daily pause, which simply started and ended at similar price level with an intraday decline. The fact that there was no comeback above the 50-day moving average - only a move to it - further indicates that nothing really changed and that the bearish outlook for the short term remains intact.
Besides, please note that the last time GDX declined from similar levels - in early November - it also paused around $27. Back then, the quick comeback was even bigger than what we saw right now. Consequently, the odds are that the decline will resume relatively soon - quite likely very soon.
Our profitable long precious metals position has been closed last week, and we've entered another trade immediately. This time, on the short side of the market, and it's going profitable again. The full version of this analysis features all the details and targets of the already-profitable short, and also lays out the precious metals' turning points together with seasonality signals not to miss. Join us and profit along!
-
Silver Miners Pinpoint the Precious Metals' Outlook
December 10, 2019, 7:17 AMVery little happened in the precious metals market both yesterday and in today's pre-market trading - at least so far. We will take this opportunity to discuss something that we haven't done in a while - silver stocks. To be clear, we're not going to discuss the silver mining stock selection, as that's something our proprietary algorithms do on a daily basis. And yes, during the recent long trade, the gain on the individual gold and silver miners was bigger than the one from the GDX ETF.
Instead, we're going to take a look at this sector's performance and compare it to one very similar case from the past. Yes, just one, which may not looks like an appropriate base for drawing conclusions, but the level of similarity makes it definitely relevant to the current situation. So, without further ado, let's take a closer look at the SIL ETF - the proxy for silver miners.
Silver Miners in the Spotlight
(click on the chart to enlarge it)
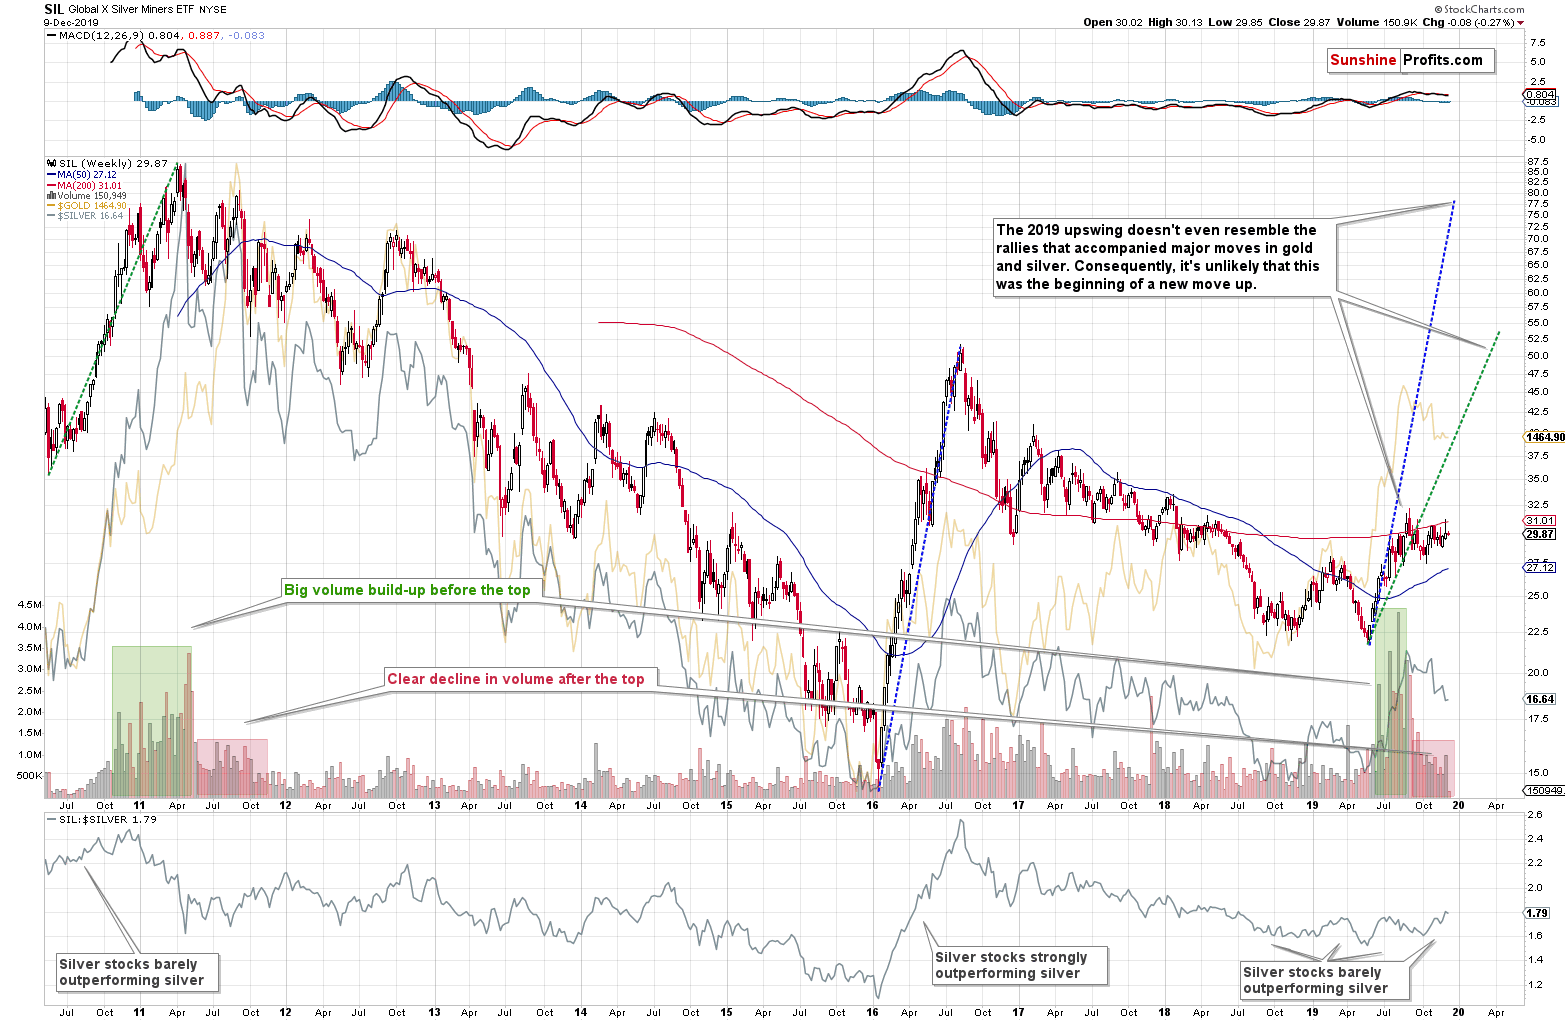
Ever since the SIL ETF started trading (in 2010), we saw three significant rallies in gold and silver. The first rally took place right at the beginning of this chart, leading to the 2011 tops. The second rally started in early 2016 and it was significant in case of both metals. The third notable rally started in the second half of 2018 and it ended in August 2019. It was much bigger in the case of gold than it was in silver and mining stocks, but it's clear that overall it was something major.
The first takeaway from the above chart is based on the sizes of these three moves. The most recent upswing in the silver stocks was tiny. Even though gold and silver moved higher in a visible manner, silver miners are barely up. To be clear, the rally is visible, but it's orders of magnitude smaller than what we saw in 2016. We copied the sizes of the previous rallies to the current situation (blue and green dashed lines). It's clear how tiny the recent upswing was compared to them.
The mining stocks are the part of the precious metals market that tends to show strength at the beginning of a major move up. We saw exactly the opposite. Silver miners were weak compared to what the underlying metal did. Consequently, the odds are that what we saw last and this year was not the start of a long-term bull market in the precious metals market. We will most likely get there eventually, but we are not there just yet.
The thing that we just discovered is that we see not only the similarity in terms of prices, but also in terms of volume movement. The recent move higher was not very similar to the previous upswings in terms of price, but the way volume increased and then declined is very similar to what happened during previous big rallies in gold and silver. In particular, it's reminiscent of what we saw in 2010 and 2011. Because of both the shape of volume, and of the way silver stocks outperformed silver (barely). The latter is what differentiates the recent upswing and what we saw in 2016 - back then, silver miners strongly outperformed silver.
The final parts of the rallies were accompanied by huge volume levels, but once the top was in, the volume levels notably decreased. That's what happened in mid-2011 and that's what happened recently. We marked it with red rectangles. Within the 2011 red rectangle, we saw a few separate volume spikes, and something similar accompanied the recent action too. Back in 2011, the volume spiked during the topping process. It marked the final top in gold, the second top in silver, and also the second top in the silver miners.
Higher gold prices were never seen since that time.
Higher silver prices were never seen since that time.
Neither higher silver stock prices were ever seen since that time.
The silver stock volume spiked last week in a way that was very similar to what we saw in mid-2011. Moreover, last week's session was a clear shooting star reversal candlestick. These candlesticks are powerful bearish signals if they are accompanied by big volume. And that's exactly what we saw. When we exited our long positions and entered short ones close to last week's high, the outlook was already bearish, but seeing this kind of powerful confirmation of the reversal in silver stocks makes this change even more justified.
All in all, the recent performance of silver stocks serves as a perfect confirmation of what we previously wrote about gold, silver, and gold miners. Namely, the short-, and medium-term outlook for the precious metals sector remains bearish.
Our profitable long precious metals position has been closed last week, and we've entered another trade immediately. This time, on the short side of the market, and it's going profitable again. The full version of this analysis features all the details and targets of the already-profitable short, digging into the factors supporting this move and the bearish outlook. Join us and profit along!
Gold Investment News
Delivered To Your Inbox
Free Of Charge
Bonus: A week of free access to Gold & Silver StockPickers.
Gold Alerts
More-
Status
New 2024 Lows in Miners, New Highs in The USD Index
January 17, 2024, 12:19 PM -
Status
Soaring USD is SO Unsurprising – And SO Full of Implications
January 16, 2024, 8:40 AM -
Status
Rare Opportunity in Rare Earth Minerals?
January 15, 2024, 2:06 PM


