tools spotlight

-
Gold's Short-Term Upswing: Is the Glass Half-Full or Half-Empty?
November 22, 2019, 8:07 AMDo you remember when we wrote that the USD Index was likely forming a broad bottom? Yesterday's action in the USD Index perfectly confirms that. The U.S. currency once again moved to our target area and it bounced from it.
USD Index Retesting Recent Lows
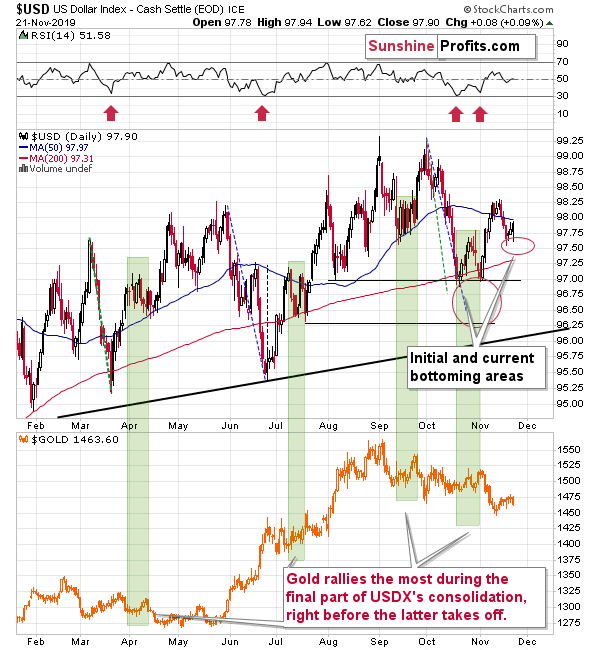
Ultimately, the USD Index ended the day higher, which caused gold to move lower. However - once again, as we wrote previously - it didn't take long for gold to regain its strength. The yellow metal is up by over $7 in today's pre-market trading, while the USDX is practically flat.
This means that our previous comments on the above chart remain up-to-date and the implications for the short term remain bullish for gold:
Now, since the USD Index already moved to our target area, there comes the question of whether this is likely to translate into a top in gold or not. Our answer is that it indicates that the top is relatively close, but not necessarily in yet.
You see, the link between gold and the USD Index is not as straightforward at it may appear at first sight. People will usually expect gold to move higher on the same day when the USD Index moves lower and vice-versa. And it quite often happens in this way. However, the strength of reaction varies. In fact, it could vary so much that moves in the USDX are going to be mostly ignored once the day-to-day price noise is filtered out.
In today's Alert, we will focus on the very specific part of the gold-USD dynamics - on gold's behavior during USD's consolidations. And more precisely, what happens if the USD Index continues to move sideways for a while and soars only after some time.
After all, that's exactly what could happen right now. The USD Index has already moved to our target area, but it doesn't automatically mean that the next upswing has to start immediately. In fact, pauses before rallies were quite common in the previous months. We marked those cases with green rectangles.
There were four similar cases this year. In two cases, the USDX consolidated after rallying and in two cases, it consolidated after declining. And yet, as far as the consolidation itself is concerned, we see the same kind of reaction in gold in all four of them.
Gold rallied most visibly when the consolidation in the USD Index was ending.
This is profound, because it means that the USD Index doesn't have to slide from here for gold to move higher in the next several days. The USD Index might move back and forth (perhaps slightly higher or slightly lower) and gold could form the final short-term pop-up just like it did in mid-April, mid-July, late-September, and late-October. In other words, our USD Index analysis doesn't invalidate our gold analysis.
Of course, if the USD Index declines some more, then gold would likely rally anyway.
That's the outlook for the short term and the short term only. After it's all said and done and the dust settles, the USDX is likely to resume it's medium- and long-term trends.
The USD Index doesn't seem to have finished its bottoming process just yet as all similar declines took a bit longer. This means that gold has yet to show us the final show strength - the short-term rally is likely to continue.
But what about the short-term, how will our long position opened right after the November 12 reversal likely do next? Apart from outlining the take-profit targets, the full version of this analysis dives into the current silver and gold performance. The relative dynamics thereof is an invaluable tool in planning when and where to switch market sides.
Please note that you can still subscribe to these Alerts at very promotional terms – it takes just $9 to read the details right away, and then receive follow-ups for the next three weeks. Profit along with us.
-
Gold's Upcoming Lesson from the Metal with PhD. in Economics
November 21, 2019, 6:07 AMLet's continue with yesterday's way of starting the Alert, and keep the focus on the big picture. This time, we'll go beyond the precious metals market and into the industrial world. But don't worry, we'd still analyze the PM realm. Analyzing copper - because that's what we're going to do - is not very far from analyzing silver, for instance. Out of all the metals, copper is the second best conductor of electricity and heat, while silver is the first (it's 6% better in case of electricity, and electricity and heat conduction are based on the same property of metals' atomic structure, by the way). Gold takes the third place in the ranking.
If the similarity ended there, it would be of little use from the investment point of view. Fortunately, there's much more to discuss as copper has been forming a very specific chart pattern since 2017 and when it did that previously, something epic happened in the precious metals market.
Copper's Ongoing Pattern
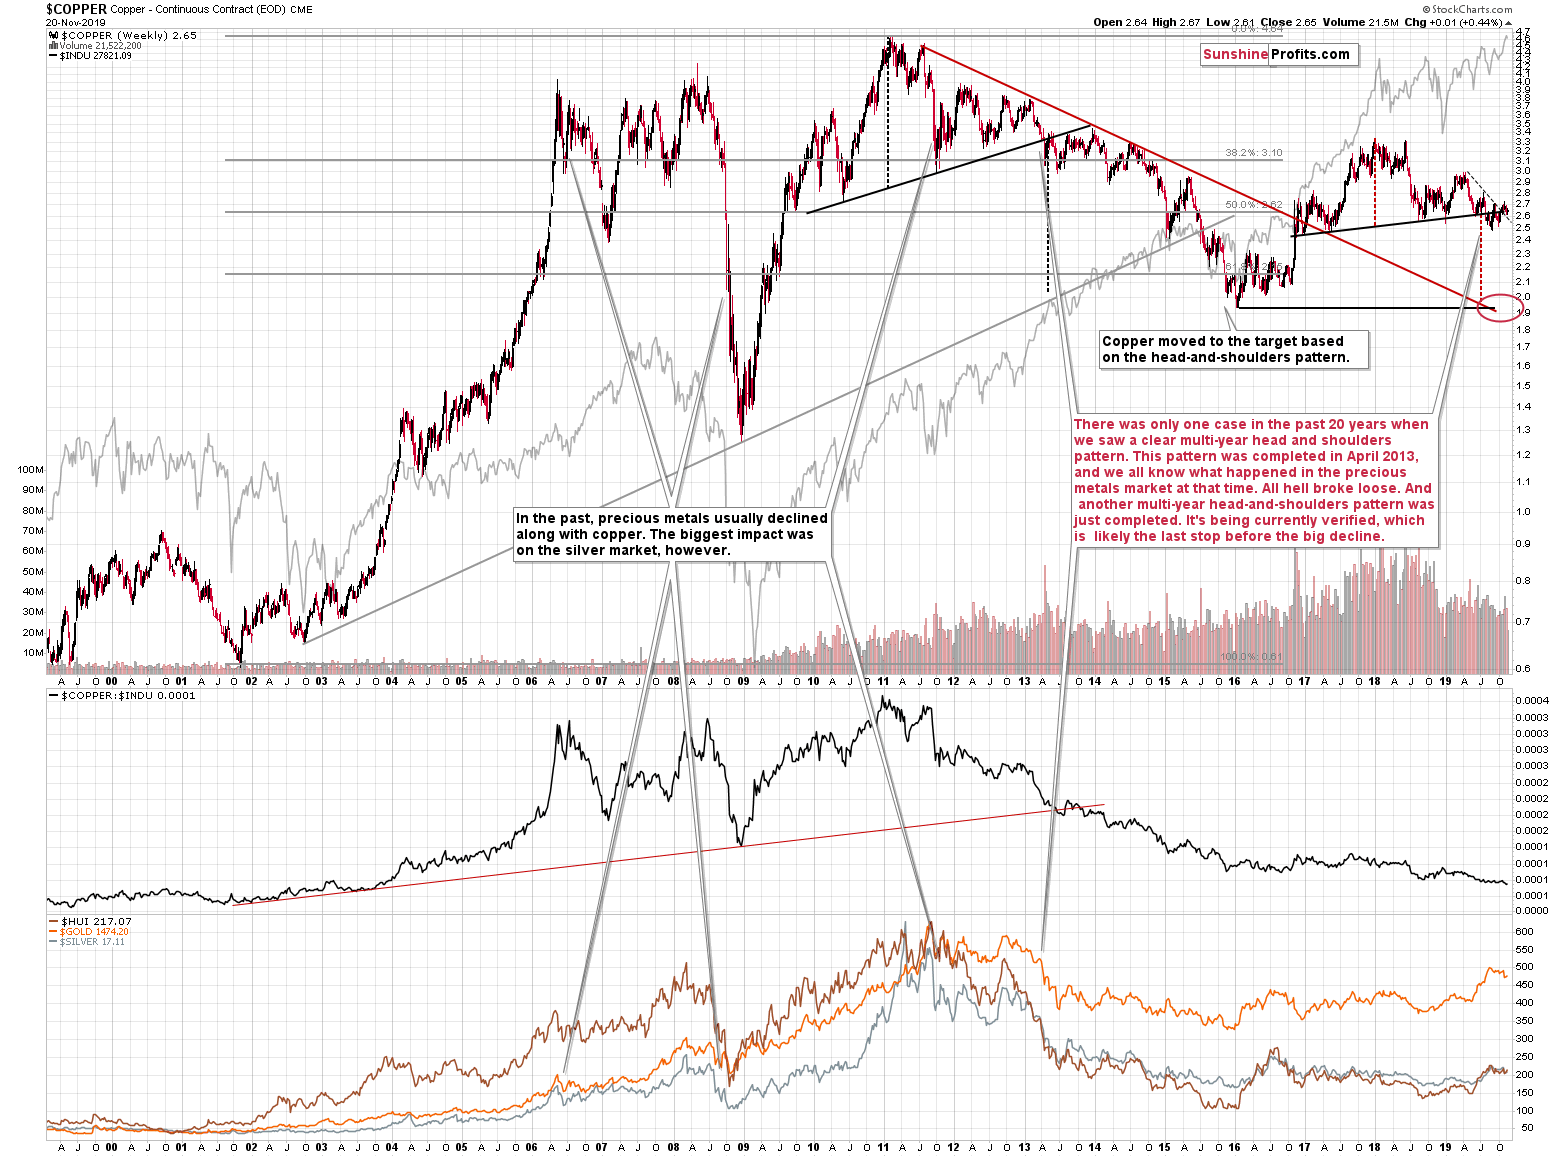
The patter is a huge head-and-shoulders formation, and we previously saw it between late 2009 and early 2013. And you know very well what happened in 2013. Gold, silver, and mining stocks plunged without giving it a second thought. The decline in the precious metals market happened right after copper successfully broke below the H&S pattern. before that happened gold showed some strength, rallying to its previous highs, while gold miners and silver moved higher, but nowhere close to analogous price levels.
The same thing is happening right now. Gold topped well above its 2016 high, but silver and gold stocks refused to move much higher. They just corrected the decline that started at the 2016 highs - nothing more.
History tends to repeat itself, so we're probably right before a bigger decline in the PMs. The situation in the USD Index definitely confirms it.
Copper broke below its big head-and-shoulders pattern earlier this year. Then it invalidated the breakdown. Then it broke lower again. And invalidated the breakdown again. Right now, copper is trading practically right at the neck level of the pattern, meaning that it could break lower any month, week, or day. This may or may not happen immediately, but a rally in the USD Index could definitely trigger copper's decline. After all, their long- and medium-term moves have been quite aligned.
The USD Index Long-Term
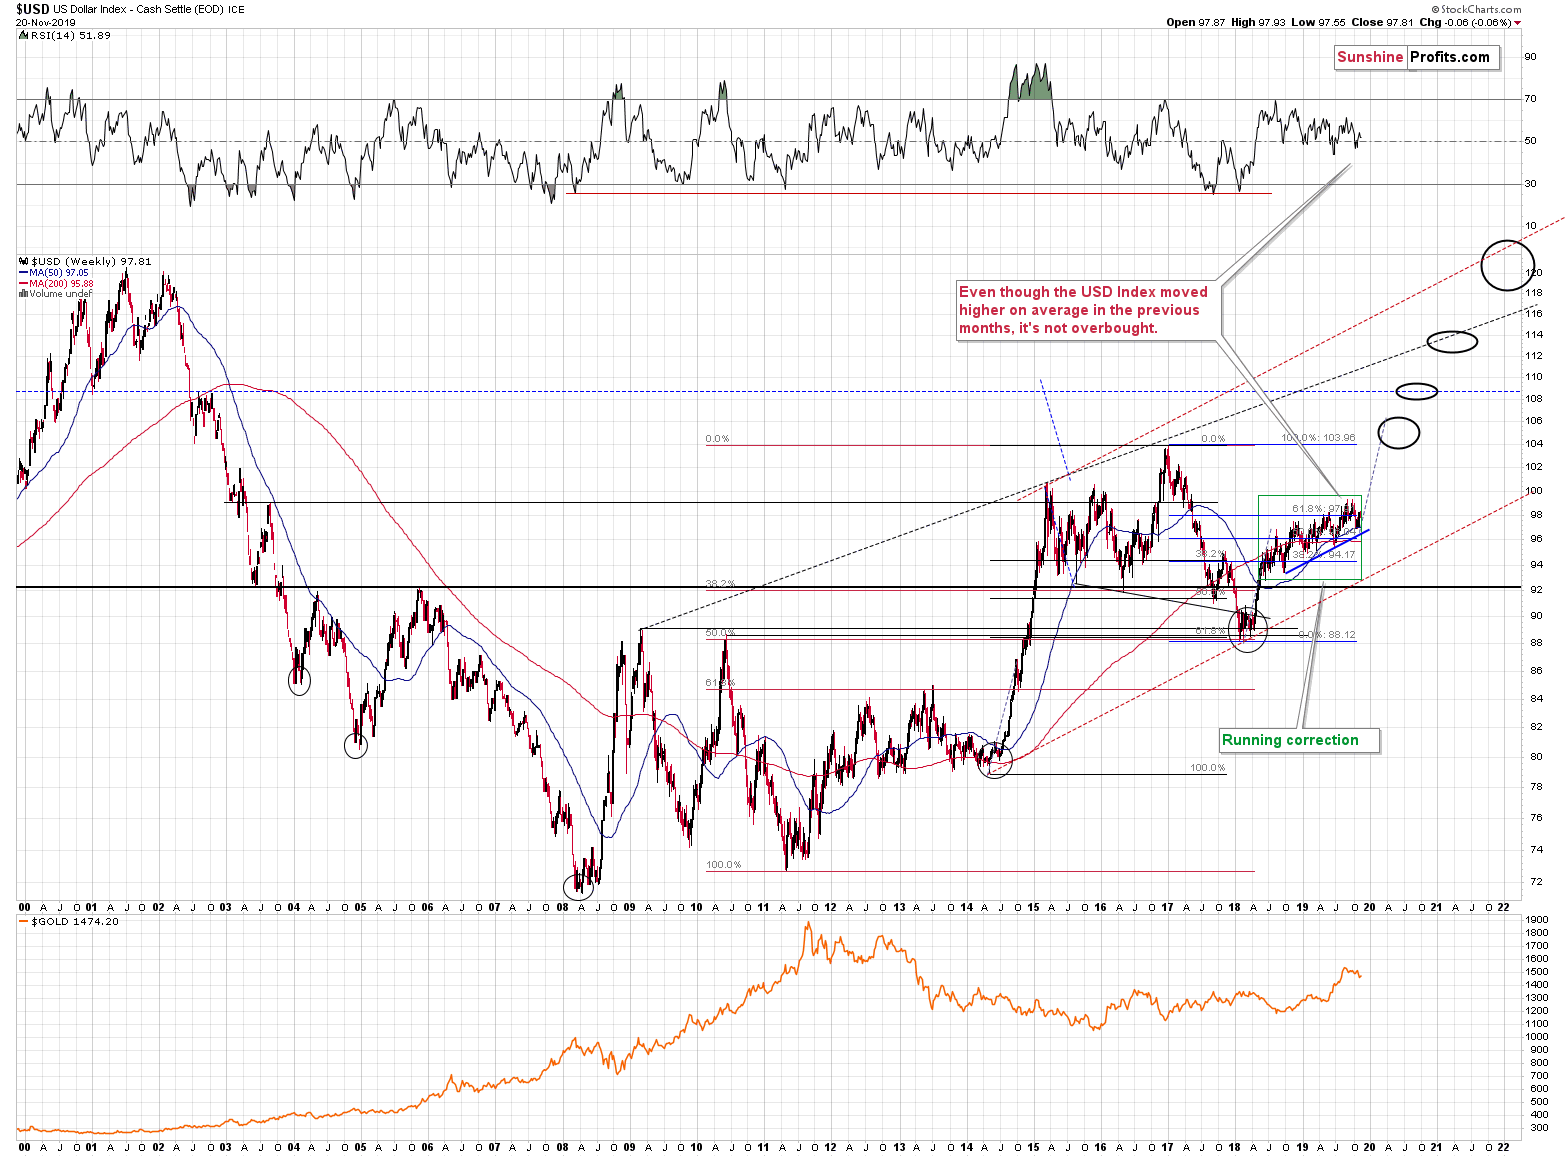
The 2008 and 2011 bottoms in the USD Index clearly correspond to copper's tops and many medium-term moves in copper are a reflection of what the USD Index has been doing. For instance, the running correction that has been in place since mid-2018 corresponds to copper's right shoulder of the H&S pattern along with the prolonged test of the breakdown below the neck level.
Once the USD Index breaks higher, the odds are that copper's breakdown will result in much lower values. The precious metals market is likely to react all this with a big decline as well.
But what about the short-term? After taking profits from our previous short position, we went long right after the November 12 reversal. The full version of this analysis outlines the take-profit targets of the long position, and features more time and price details of switching the market sides. Learn more about the short-term outlook of PMs and the USD Index - join our subscribers and profit along. Subscribe today.
-
Both the Gold Decline and the Gold Rally Continue
November 20, 2019, 7:36 AMWe started the last few analyses with the micro point of view in which we explained why gold is likely to rally in the short term. Therefore, balance requires an overview of what's really going on in case of the medium-term trends. Instead of introducing you to quite a few relevant trees, let's take a look at the whole forest.
Gold Long-Term
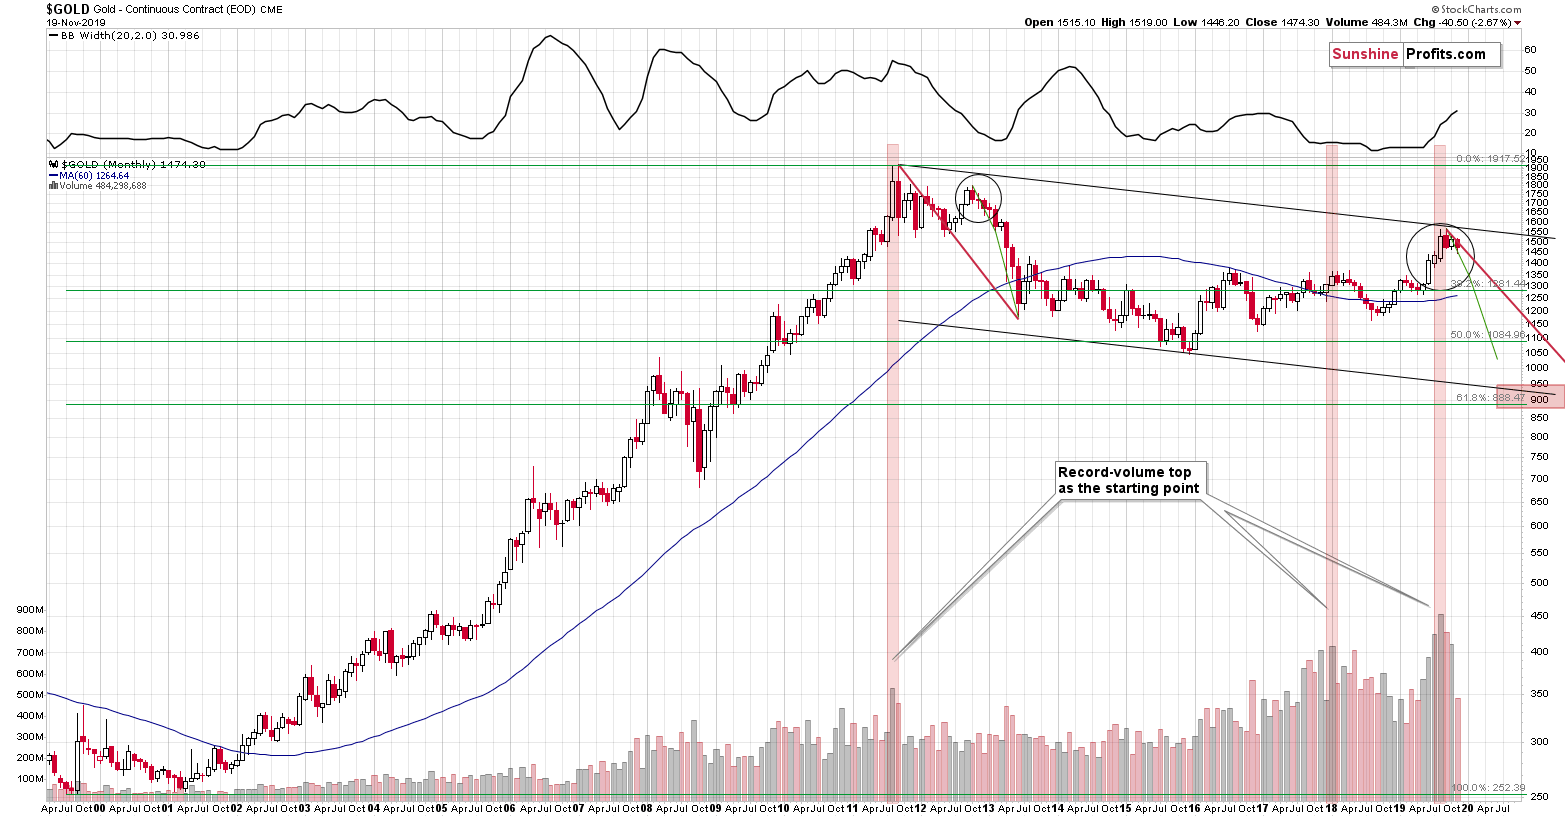
The big picture shows one crucial thing. Gold has most likely formed a key 2019 top in August. The confirmation comes from the shape of the preceding upswing and the volume of the final monthly rally. Record-breaking volume shows that the investors' emotions got to the red-hot status and yet they were overwhelmed by the sellers.
There were only two cases when the monthly volume that we saw after a sizable upswing was similarly big, and it was at the 2011 and 2018 tops. Both were followed by substantial declines (in case of the former top, the above is an understatement), and since history tends to repeat itself, gold is likely to decline in the following weeks once again.
Please note that it's not just the similarity to the two above-mentioned cases that makes the medium-term outlook bearish. It's the way the volume works and it literally speaks volumes. It's not an out-of-the-blue analogy - investors' emotions are supposed to get red-hot at the major tops and the volume confirmed that this has indeed happened.
When people wonder how do I buy gold, they often end up buying something else than gold, but with - seemingly - analogous potential. Gold stocks. After all, the latter are less bulky to purchase and the transaction is often just several clicks away. Gold needs to be stored in a safe place, and so on. Don't get us wrong - we think that physical gold ownership has many merits, but we want to emphasize that many people choose to ignore them and go with the easier way of being in the precious metals market, as its - well - easier.
Consequently, when discussing gold's big picture, it's a great idea to supplement the yellow metal's analysis with the one of the mining stocks. In case of the long-term point of view, it's particularly interesting to see how mining stocks perform relative to other stocks. Thanks to this approach, we can isolate the moves in gold stocks that don't depend on the entire general stocks market.
That's valuable, because in this way we can avoid falling into the "tide lifts all boats" analytical trap. The factors that cause all stocks (including mining stocks) to move higher or lower will be taken out of the picture once we look at mining stocks through their ratio to other stocks. Consequently, let's take a look at the HUI to S&P 500 ratio.
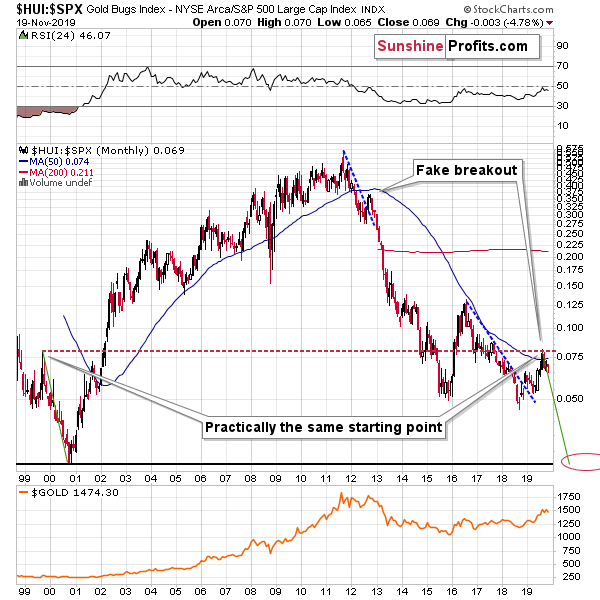
As gold topped in August, the ratio topped as well, but while gold's top formed close to the late-2011 and mid-2012 lows (in terms of the weekly and monthly closing prices), the ratio formed at a level that's much more important from the long-term point of view. The ratio topped at its 1999 top.
That's a major top not only because of how clear it is. It's so important, because it was the final top before the previous multi-year bear market in the precious metals ended. The PMs then declined for about a year and the final bottom that formed, started a multi-year rally.
Just because the ratio is moving lower from the same level doesn't mean that it absolutely has to move in the same way, but there are multiple indications that point to this outcome anyway, so the above serves as a good confirmation. Besides, that's not the only bearish thing about the above chart.
The interesting thing about the 1999 top is that it already worked as support two times. It stopped (for a while, but still) the decline in late 2014 and it triggered a rebound in late 2015. The decline in the ratio resumed only after the ratio moved below the 1999 top. This year's top was actually the first time when this level served as resistance. This suggests that a bigger move lower is indeed likely just around the corner.
Speaking of resistances that have been useful and triggered a decline recently, there's also the 50-month moving average. It served as resistance in 2001, as support in 2005, 2006, and 2007. It served as resistance in 2012 and 2016. And it served as resistance this year as the ratio turned lower after attempting to confirm the breakout above it.
Moreover, please note what the ratio did when the new bull market started - after the 2000 bottom it soared and then it continued to show strength for the next few years. In fact, the biggest part of the rally in the ratio took place in the first few years of the 2000 - 2011 upswing. And what did the ratio do recently?
It was barely up even though gold rallied visibly, and it failed to take out the above-mentioned resistance levels. What's even more striking is that the recent rally in the ratio was much smaller than the ratio that we saw in 2016. The strength that we saw in the gold miners to other stocks ratio at the beginning of the previous bull market was definitely not present this year. Consequently, it's very unlikely that we saw a start of a new powerful, long-term rally in the ratio and in the rest of the precious metals sector.
Based on the above, the odds are that the decline will now continue, and since this ratio moves in tune with gold over the long run, it supports the bearish outlook for gold in the medium term. Consequently, while gold's rally continues in the short run, it's decline continues in the medium term.
We took profits from our previous short position and entered a long position right after the November 12 reversal. In the full version of this analysis, we outline the prices at which we are going to take profits from the long position and likely enter another short position. We're also discussing when that's (approximately) likely to take place. We encourage you to join our subscribers and profit along with us. Subscribe today.
-
Is the Rally Ending? Gold Miners Say "No"
November 19, 2019, 7:53 AMYesterday, we warned you that the zig-zag in the yellow metal was not as bearish as it appeared at first sight and that it was likely a rather normal correction within a short-term (and short-term only) uptrend. Shortly thereafter, gold rallied back with vengeance and ultimately closed the session in the green. Miners moved above the recent highs and silver is rallying to new highs in today's pre-market trading. Let's take a look at the details.
The Short-Term in PMs

The rally in gold may caught the most interest from traders, but it was yesterday's rally in the miners, and it is today's rally in silver that have more important implications.
Gold miners tend to be strong relative to gold during rallies, especially in a given rally's early part. That's exactly what we saw yesterday. After a brief pause, miners resumed their rally and moved above the most recent highs, even though gold itself didn't. That's a subtle, yet important - sign of strength.
Since miners are outperforming gold and silver particularly well in the initial part of a rally (and silver catches up relatively close to the end of the rally), yesterday's performance suggests that the rally has still some steam left in it. That's very good, because - while our long positions are already profitable - it means that the profits are likely to become even bigger and that those who missed the buying opportunity can still join in.
Silver's short-term outperformance will be one of the things we'll be looking at in order to confirm the end of this short-term rally. At the same time, it might imply a great shorting opportunity.
At this time, you might be wondering if silver's pre-market upswing (at the moment of writing these words, silver is up by $0.10 while gold is more or less flat) is already the sign that we were waiting for. The short answer is "no". The outperformance is too insignificant so far and it would be best if at the same time silver outperformed gold and miners underperformed it. In this way, both signals would confirm each other.
The same thing can be observed from the more long-term point of view. Most of gold miners' gains that you can see on the above chart happened between May and late June. However, in case of silver, most gains took place between early August and early September. It works from the long-term point of view as well. Remember how silver and gold miners performed about 10 years ago?
Taking the 2008 bottom as the starting point, the vast majority of gains in the gold miners happened before the end of 2009. In case of silver, however, the rally really picked up in mid-2010 and ended with a blast in 2011. Knowing how to move between these markets could have made very big profits while one stayed long precious metals for the entire time. On a side note, we dedicated a big research report to this phenomenon, in which we called the above strategy buy-and-hold on steroids. Cheesy name? A bit. Profitable? You bet. Interestingly, we know no fund managers with this specific approach to long-term precious metals investing (well, other than your truly, that is).
Moving back to the short term, knowing the dynamics between silver and mining stocks should be helpful in pinpointing the next turnaround. We already have quite a few indications of when and at what price the turnaround will likely take place and when we'd take profits off the table, but the above is likely to serve as a valuable confirmation.
There are still profits to be made on the current long trade in gold, silver, and mining stocks, but the odds are significantly lower if one doesn't have a plan for taking profits off the table at the optimal risk to reward point. That's exactly what we focus on in this trade and today's Gold & Silver Trading Alerts provides all the trade details. Please note that you can still subscribe to these Alerts at very promotional terms - it takes just $9 to read the details right away, and then receive follow-ups for the next three weeks. Profit along with us.
-
Zig-Zagging Gold Is Not Necessarily Bearish Gold
November 18, 2019, 9:26 AMIn Friday's article, we wrote that what comes up must co..rrect and gold has indeed shown to be in a corrective mode. We also wrote that the yellow metal was unlikely to break below the 61.8% Fibonacci retracement based on the previous upswing and while gold moved to this level earlier today, it didn't break below it. At least not in any significant way - the few cents below this level doesn't really count. Let's take a closer look at gold's overnight chart to see what the decline means.

In short, it doesn't mean much. All markets, including gold, quite often correct in a zigzag fashion, and they relatively often correct between 38.2% and 61.8% of the preceding move before continuing their previous move. That's exactly what is happenning in gold.
Gold moved to the 61.8% Fibonacci retracement level based on the preceding upswing and it moved there in a zig-zag style. Gold reversed after reaching the retracement, so the bottom might be in and the yellow metal could be ready to resume its upswing shortly. If gold confirms the breakdown below the 61.8% Fibonacci retracement level ($1457), the bullish forecast for gold for the short-term might change, but that's not the case so far.
Besides, the short-term correction in the USD Index that's likely to contribute to higher gold, silver, and mining stock values in the short run is not over just yet.
Is the USD Index Done Declining?

The breakdown below the very short-term rising wedge pattern resulted in a major decline. "Major" from the very short-term point of view as the following daily downswing has been the biggest daily decline that we saw this month. After the initial decline, the move lower continued and the USDX closed the week below its 50-day moving average. The 50-day MA has been providing support quite reliably in the previous months. It was not always strong support, but often meaningful enough to make it useful as a trading tool. While it stopped the decline on Thursday, the USDX broke below it overall.
The above breakdown opened the way to even lower USDX values.
The green and blue dashed lines represent declines that are similar to the October decline. The rallies that followed them were quite sharp, but they too had smaller pauses within them. Both: March-April, and July rallies consolidated after the USDX moved above its 50-day moving average.
The short-term decline that we saw so far doesn't compare to what we saw in early April and in mid-June. Consequently, the odds are that the USD Index will decline some more before soaring to new highs.
This means that gold is likely to move higher before plunging. Consequently, the odds are that reports of gold turning bearish for the short run are premature.
Also, let's keep in mind that this decline is taking place after both gold and silver invalidated their previous breakdowns in terms of daily closing prices.
Precious Metals Short-Term

On Thursday, both precious metals closed slightly (but still) above their lowest closing prices of September. Silver didn't move back above the rising red support/resistance line, but the breakdown below the previous low was invalidated.
The resistance provided by the lows is a good reason why gold and silver corrected on Friday and earlier today. But, just as the decline in the USDX doesn't seem to be over, the rally in gold and silver seems to have more upside.
And the mining stocks?

Looking at miners' performance in one way provides us with bearish implications for the day, but looking from a different angle shows the silver lining.
The bearish case is based on the shape of the last three sessions. They look like an island top that formed right after the bullish reversal. Gold is down in today's pre-market session, so gold stocks are likely to decline today as well, in tune with implications of the above-mentioned top formation.
On the other hand, such a daily comeback close to the start of the rally is exactly what happened about a month ago, and it was a relatively normal part of the upswing. The similarity may not be obvious at first sight, but please note the three intraday attempts to reach more than about half of the preceding downswing. In the following days, the HUI Index continued to rally, but not without a daily decline first.
The positions of Stochastic and RSI indicators confirm the similarity between these two cases.
All in all, even though gold moved lower today, it doesn't mean that the short-term rally is already over.
The short term is one thing and the big move that's likely to unfold is something quite different. The gold futures open interest (number of positions in gold futures) just exceeded its previous extremes and if it sounds as something of key importance to you - you're perfectly right. There are two ways in which this major development is practically screaming what's going to happen next. But one needs to know how to read this sign. Today's Gold Trading Alert - the full version of this analysis - covers all the details to know before (!) the big gold price move happens. Please note that you can still subscribe to these Alerts at very promotional terms - it takes just $9 to read the details right away and then receive follow-ups for the next three weeks. Stay informed at very preferred terms.
Gold Investment News
Delivered To Your Inbox
Free Of Charge
Bonus: A week of free access to Gold & Silver StockPickers.
Gold Alerts
More-
Status
New 2024 Lows in Miners, New Highs in The USD Index
January 17, 2024, 12:19 PM -
Status
Soaring USD is SO Unsurprising – And SO Full of Implications
January 16, 2024, 8:40 AM -
Status
Rare Opportunity in Rare Earth Minerals?
January 15, 2024, 2:06 PM


