Briefly: in our opinion, full (300% of the regular position size) speculative short positions in junior mining stocks are justified from the risk/reward point of view at the moment of publishing this Alert.
Today’s short-term analysis will once again be in video format. However, to make a long story short, the precious metals sector declined yesterday, and what we wrote previously remains up-to-date.
Having said that, let’s take a look at the markets from a more fundamental angle.
No One Believes the Fed, Including Gold
With the gold price continuing to rise, the yellow metal approached $1,900 on Jan. 9. Moreover, with the USD Index and the U.S. 10-Year real yield heading in the opposite direction, the medium-term bullion bulls continue to ride the wave higher.
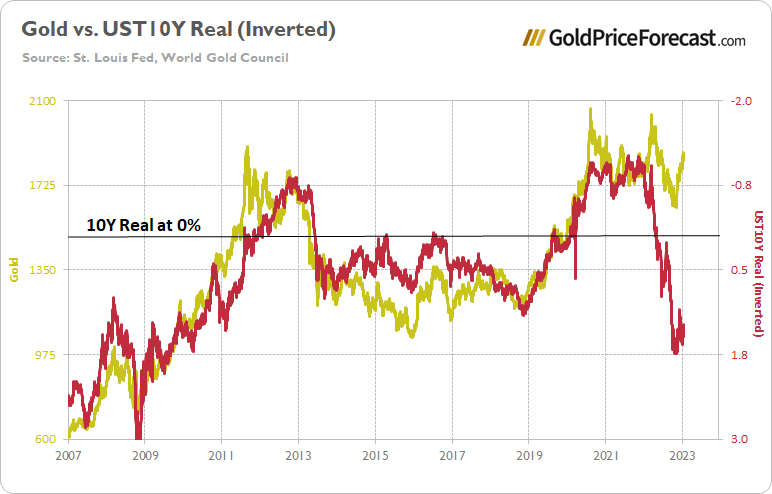
But, with the crowd confusing momentum for fundamentals, the economic backdrop supports a sharp reversion in the months ahead. For example, a subscriber highlighted the recently broken relationship between 10-year inflation-linked bonds and the gold price.
In a nutshell: the gold price should move inversely to real interest rates, as the latter’s strength is bullish for the USD Index and the U.S. federal funds rate (FFR).
In addition, the PMs are non-yielding assets, so when real interest rates are positive, the theoretical nominal return from owning bonds is higher than owning gold. As a result, the combination of a stronger dollar and higher-yielding alternatives depresses the outlook for the yellow metal.
Please see below:
To explain, the gold line above tracks the price tallied by the World Gold Council, while the red line above tracks the inverted (down means up) U.S. 10-Year real yield. We wrote on Apr. 11, 2022:
The historical fundamental playbook shows:
- When a crisis erupts, the Fed cuts interest rates and commences QE
- Real yields turn deeply negative
- Gold rallies sharply
- The Fed normalizes monetary policy, real yields surge and gold plunges
If you analyze the left side of the chart, you can see that the U.S. 10-Year real yield soared and gold plunged during the global financial crisis (GFC). However, when the Fed launched QE and the U.S. 10-Year real yield sunk to an all-time low, gold hit a new all-time high along the way.
Furthermore, the current situation is a spitting image. When Fed Chairman Jerome Powell performed a dovish pivot in late 2018, the U.S. 10-Year real yield suffered. Then, when the Fed fired its liquidity bazooka in March 2020, it pushed the metric to another all-time low. And surprise, surprise, gold hit another all-time high.
However, we're now in stage four of the historical fundamental playbook. With the Fed normalizing policy, the U.S. 10-Year real yield has surged in recent weeks. Moreover, the Fed needs to push the metric above 0% to curb inflation.
To that point, while the fundamentals unfolded as expected, and the gold price sunk below $1,650 in September, October and November, the yellow metal was still far from the lows implied by the U.S. 10-Year real yield. Likewise, with pivot optimism pushing the gold price higher in recent months, the crowd is drooling over the potential return of pre-pandemic monetary policy.
As a result, investors are buying gold and ignoring the U.S. 10-Year real yield because they believe the Fed will fold. Remember, buying the dip has been profitable since the GFC because monetary authorities ran to the rescue during every crisis and saved the bull market. Therefore, it’s hard to break that psychology, as investors rely on what worked for them in the past.
Consequently, with the crowd pricing in rate cuts in late 2023, the medium-term gold bulls will say: “why should we worry about a higher U.S. 10-Year real yield when the Fed will cut the FFR and real interest rates will turn negative in the months ahead?”
Thus, their mindset is to front-run the prospective fundamental environment, and dismiss the real yields they believe will be much lower over the medium term.
Conversely, we believe the thesis is shortsighted:
- Inflation is still highly problematic, and the consensus underestimates the difficulty of returning the metric to 2%.
- The FFR has eclipsed the peak year-over-year (YoY) core CPI in every inflation fight since 1961; and since the YoY core CPI peaked (for now) at 6.66% in September 2022, the historically-implied peak FFR is at least 6.67% , and the crowd is ignoring the historical lessons of where the FFR needs to go to eliminate inflation.
- Nine of the last 10 bouts of rising inflation ended with recessions, and recessions are bearish for gold. During the dot-com collapse, the GFC, and the COVID-19 crisis, gold declined substantially when panic ensued. As such, U.S. Treasury bonds and the U.S. dollar are the primary safe havens during liquidations, not gold.
- While everyone assumes that the FOMC is wrong about higher-for-longer interest rates, we believe the fundamentals support its outlook.
So, while the crowd pushes the gold price in one direction, the fundamentals are far from supportive. In addition, another question considers whether real interest rates can rise if the Fed raises the FFR to 5.25% and then pauses. Historically, after a pause, the answer is no. But, plenty of upside can be realized until then. To explain why, we wrote on Oct. 7:
The U.S. 10-Year real yield often peaks alongside the FFR (or near it). With the Fed poised to raise the FFR by at least another 1.25% (to reach 4.5%), the U.S. 10-Year real yield should have more room to run, which is bullish for the USD Index.
Please see below:
To explain, the red line above tracks the U.S. 10-Year real yield, while the green line above tracks the FFR. As you can see, a higher FFR supports higher real interest rates. Also, when the FFR hit ~4.5% in February 2006, the U.S. 10-Year real yield reached a monthly high of 2.14%, and it occurred with a YoY CPI at roughly half the current rate.
Thus, with the U.S. 10-Year real yield hitting a 2022 high of 1.74% and ending the Jan. 9 session at 1.31%, a rise above 2% is well within the expected range of outcomes. Furthermore, if the FFR surpasses the YoY core CPI like it has in every inflation fight since 1961, the U.S. 10-Year real yield could hit 2.5% or more. Either way, the current market pricings contrast the historical and economic realities required to normalize inflation.
Overall, the crowd continues to dismiss the hawkish warnings from the FOMC. When QE was fashionable, the motto was ‘don’t fight the Fed;’ and now that QT is fashionable, the motto is ‘fight the Fed.’ Therefore, while the bulls want to have their cake and eat it too, the latter creates a bearish environment for risk assets, and they should learn this lesson the hard way in the months ahead.
Please let us know what you think. Why are investors so keen to fight the Fed? Is history irrelevant in this inflation fight? How do you see Powell reacting to their dismissive behavior?
Does Silver Have a Problem With $24?
While silver has continued its uptrend in the face of materially hawkish data, its inability to consistently hold $24 highlights its fundamental frailty. Moreover, while the recent weakness is immaterial, given how overvalued the price is relative to the fundamental backdrop, a substantial drawdown should occur over the medium term.
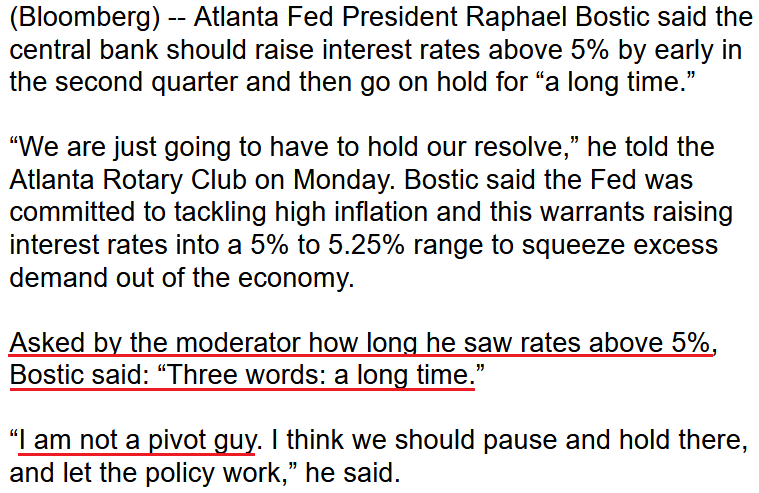
While the crowd doesn’t care at the moment, Fed officials have furiously pushed back against investors’ pivot hopes; and from our perspective, these warnings are like a fire alarm that shouldn’t be dismissed.
For example, while market participants have become more brazen in their condescending attitudes toward the FOMC’s projections, officials have equally upped the ante. Before, Fed officials used hawkish, but passive, language to avoid upsetting investors. Now, they’re being much more direct.
Atlanta Fed President Raphael Bostic said on Jan. 9:
Likewise, San Francisco Fed President Mary Daly said on Jan. 9:
It is “really too soon to declare victory” on inflation. “We’re determined, dedicated, united, resolute… to bringing inflation down to our price stability target,” and we’ll keep at it “until the job is well and truly done.”
As a result, Daly also expects the FFR to exceed 5% in 2023.
Please see below:
Thus, while the PMs continue to call the Fed’s bluff, investors are not prepared for a Fed that actually delivers on its promises; and since the 2022 divergences ended with risk assets suffering sharp drawdowns, we believe they are more relevant than the post-GFC crowd’s prayers for QE.
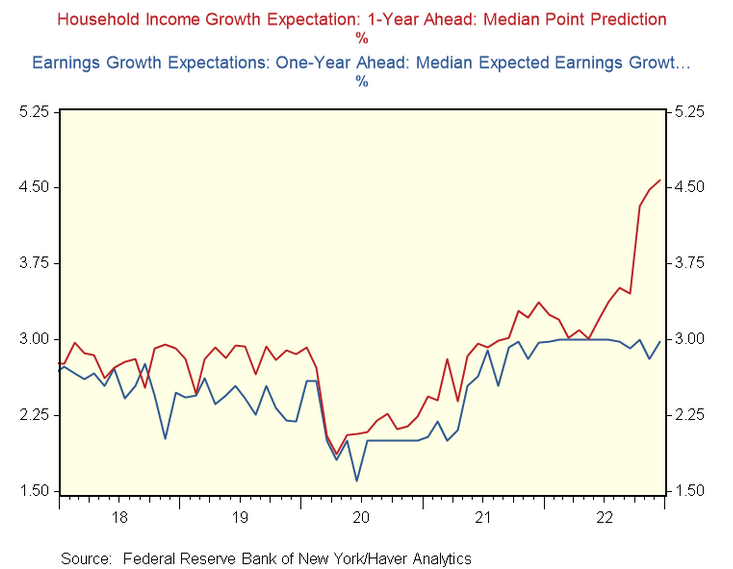
In addition, the New York Fed released its Survey of Consumer Expectations (SCE) on Jan. 9; and while short-term inflation expectations fell and long-term inflation expectations rose, the implications of widespread wage inflation were prevalent. The report stated:
“The median expected growth in household income rose by 0.1 percentage point to 4.6% in December, a new series high.”
Please see below:
To explain, the red line above tracks American households’ median 12-month income growth expectations, while the blue line above tracks Americans’ median 12-month earnings expectations. If you analyze the performance of the former, you can see that it hit a new all-time high. Similarly, the blue line jumped in December and matched its all-time high.
As a result, we’ve warned repeatedly that U.S. households are flush with cash, and persistent wage inflation only enhances consumers’ spending power.
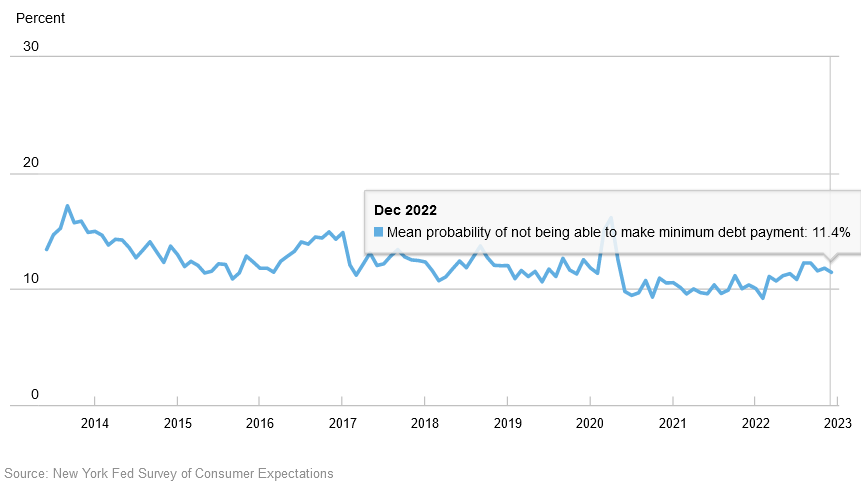
On top of that, while the crowd assumed that higher interest rates would create a deluge of delinquencies, Americans are not concerned about their debt payments.
Please see below:
To explain, the mean probability of missing a debt payment declined again in December, and the metric currently stands near the low end of its pre-pandemic range. Therefore, while interest rates are much higher now, the developments have not stressed consumers to the point where demand destruction has materialized.
As such, Americans’ ability and willingness to spend should keep inflation uplifted for longer than the consensus expects, and a realization is bullish for the FFR, real yields and the USD Index.
Finally, former Fed Chairman Alan Greenspan warned on Jan. 3 that wage growth is too high to meaningfully reduce inflation without a recession. He said:
“We may have a brief period of calm on the inflation front but I think it will be too little too late.” If the Fed pivots, inflation “could flare up again and we would be back at square one. For that reason alone, I do not expect the Federal Reserve to loosen prematurely unless they deem it absolutely necessary, for example, to prevent financial market malfunctioning.”
Thus, while we warned on numerous occasions that it would take a climactic event (bank failure, labor market collapse, bankruptcy shock, etc.) to provoke a dovish 180, the resilient economic backdrop does not support that right now. As it stands, the FFR should continue its ascent, and the hawks should emerge victorious in the months ahead.
Overall, the silver price has consolidated recently and underperformed gold. But, both are trading well above their fundamental values, and their optimism is driven by investors’ misguided pivot expectations. As a result, when those hopes reverse, the silver price should follow suit. Consequently, while the S&P 500 has made some bullish advances, the outlook for risk assets remains bearish.
Please share your thoughts. Why is the economic data so resilient despite all of the doomsday predictions? Can it last? And who will blink first: investors or the Fed?
The Bottom Line
With Fed Chairman Jerome Powell set to speak today, investors will be on guard ahead of his speech. However, with his deputies amplifying their hawkish rhetoric recently, we noted the significance on Dec. 16, 2021. We wrote:
As one of the most important quotes of the [post-FOMC] press conference, [Powell] admitted:
“My colleagues were out talking about a faster taper and that doesn’t happen by accident. They were out talking about a faster taper before the president made his decision. So it’s a decision that effectively was more than entrained.”
And while Powell sounded a little rattled during the exchange, his slip highlights the importance of Fed officials’ hawkish rhetoric. Essentially, when Clarida, Waller, Bostic, Bullard, etc., are making the hawkish rounds, “that doesn’t happen by accident.” As such, it’s an admission that his understudies serve as messengers for pre-determined policy decisions.
So, if the relationship still holds, it could have ominous implications for risk assets in the days and weeks ahead.
In conclusion, the PMs were mixed on Jan. 9, as gold diverged from silver and mining stocks; and with the S&P 500 reversing in the afternoon, the index’s struggle with 3,900 is like silver’s struggle with $24. In any event, both are materially overvalued and their medium-term nadirs should be much lower than where we are now.
Overview of the Upcoming Part of the Decline
- It seems to me that the corrective upswing is over (or about to be over) and that the next big move lower is already underway (or that it’s about to start).
- If we see a situation where miners slide in a meaningful and volatile way while silver doesn’t (it just declines moderately), I plan to – once again – switch from short positions in miners to short positions in silver. At this time, it’s too early to say at what price levels this could take place and if we get this kind of opportunity at all – perhaps with gold prices close to $1,500 - $1,550.
- I plan to switch from the short positions in junior mining stocks or silver (whichever I’ll have at that moment) to long positions in junior mining stocks when gold / mining stocks move to their 2020 lows (approximately). While I’m probably not going to write about it at this stage yet, this is when some investors might consider getting back in with their long-term investing capital (or perhaps 1/3 or 1/2 thereof).
- I plan to return to short positions in junior mining stocks after a rebound – and the rebound could take gold from about $1,450 to about $1,550, and it could take the GDXJ from about $20 to about $24. In other words, I’m currently planning to go long when GDXJ is close to $20 (which might take place when gold is close to $1,450), and I’m planning to exit this long position and re-enter the short position once we see a corrective rally to $24 in the GDXJ (which might take place when gold is close to $1,550).
- I plan to exit all remaining short positions once gold shows substantial strength relative to the USD Index while the latter is still rallying. This may be the case with gold prices close to $1,400 and GDXJ close to $15 . This moment (when gold performs very strongly against the rallying USD and miners are strong relative to gold after its substantial decline) is likely to be the best entry point for long-term investments, in my view. This can also happen with gold close to $1,400, but at the moment it’s too early to say with certainty.
- The above is based on the information available today, and it might change in the following days/weeks.
You will find my general overview of the outlook for gold on the chart below:
Please note that the above timing details are relatively broad and “for general overview only” – so that you know more or less what I think and how volatile I think the moves are likely to be – on an approximate basis. These time targets are not binding nor clear enough for me to think that they should be used for purchasing options, warrants, or similar instruments.
Letters to the Editor
We received a few messages over e-mail, but as we are moving to our new Golden Meadow platform, we will be transferring them below the articles as comments – and that’s where we’ll be replying to them.
On the platform, please ask your questions below the articles or in the spaces called “Ask the Community” or “Position Sizes” directly – it will help us deliver a reply sooner. In some cases, someone from the community might reply and help even before we do.
Please remember about the Pillars of our Community, especially about the Kindness of Speech Pillar.
Also, if there’s anything that you’re unhappy with, it’s best to send us a message at [email protected].
Please note that this section is going to go away within the next 1-8 weeks, as you can add comments/questions below the article on Golden Meadow – the platform that we’re using to provide our analyses. Your notification e-mails include an invitation link that allows you to access the “Gold Trading Alerts” space.
Also, if you haven’t had the chance to see the video, in which I’m talking about the new platform and why we essentially moved from Sunshine Profits to Golden Meadow, I strongly encourage you to do so:
Summary
Summing up, it seems that the major bottom in the USD Index is in, while the correction in stocks, gold, silver, and mining stocks is over or very close to being over.
The nature of the recent corrections was mostly technical and rumor-based. The rumor was that the Fed would be making a dovish U-turn soon, and it recently became clear that this was not going to be the case. Consequently, the corrective upswing is likely to be reversed, and medium-term downtrends are likely to resume.
In my opinion, the current trading position is going to become profitable in the following weeks, and quite possibly in the following days. And while I can’t promise any kind of performance, I fully expect it to become very profitable before it’s over and to prolong our 2022 winning streak.
After the final sell-off (that takes gold to about $1,350-$1,500), I expect the precious metals to rally significantly. The final part of the decline might take as little as 1-5 weeks, so it's important to stay alert to any changes.
As always, we'll keep you – our subscribers – informed.
To summarize:
Trading capital (supplementary part of the portfolio; our opinion): Full speculative short positions (300% of the full position) in junior mining stocks are justified from the risk to reward point of view with the following binding exit profit-take price levels:
Mining stocks (price levels for the GDXJ ETF): binding profit-take exit price: $20.32; stop-loss: none (the volatility is too big to justify a stop-loss order in case of this particular trade)
Alternatively, if one seeks leverage, we’re providing the binding profit-take levels for the JDST (2x leveraged). The binding profit-take level for the JDST: $22.87; stop-loss for the JDST: none (the volatility is too big to justify a SL order in case of this particular trade).
For-your-information targets (our opinion; we continue to think that mining stocks are the preferred way of taking advantage of the upcoming price move, but if for whatever reason one wants / has to use silver or gold for this trade, we are providing the details anyway.):
Silver futures downside profit-take exit price: $14.32
SLV profit-take exit price: $13.42
ZSL profit-take exit price: $48.87
Gold futures downside profit-take exit price: $1,504
HGD.TO – alternative (Canadian) 2x inverse leveraged gold stocks ETF – the upside profit-take exit price: $16.47
HZD.TO – alternative (Canadian) 2x inverse leveraged silver ETF – the upside profit-take exit price: $36.87
Long-term capital (core part of the portfolio; our opinion): No positions (in other words: cash)
Insurance capital (core part of the portfolio; our opinion): Full position
Whether you’ve already subscribed or not, we encourage you to find out how to make the most of our alerts and read our replies to the most common alert-and-gold-trading-related-questions.
Please note that we describe the situation for the day that the alert is posted in the trading section. In other words, if we are writing about a speculative position, it means that it is up-to-date on the day it was posted. We are also featuring the initial target prices to decide whether keeping a position on a given day is in tune with your approach (some moves are too small for medium-term traders, and some might appear too big for day-traders).
Additionally, you might want to read why our stop-loss orders are usually relatively far from the current price.
Please note that a full position doesn't mean using all of the capital for a given trade. You will find details on our thoughts on gold portfolio structuring in the Key Insights section on our website.
As a reminder - "initial target price" means exactly that - an "initial" one. It's not a price level at which we suggest closing positions. If this becomes the case (as it did in the previous trade), we will refer to these levels as levels of exit orders (exactly as we've done previously). Stop-loss levels, however, are naturally not "initial", but something that, in our opinion, might be entered as an order.
Since it is impossible to synchronize target prices and stop-loss levels for all the ETFs and ETNs with the main markets that we provide these levels for (gold, silver and mining stocks - the GDX ETF), the stop-loss levels and target prices for other ETNs and ETF (among other: UGL, GLL, AGQ, ZSL, NUGT, DUST, JNUG, JDST) are provided as supplementary, and not as "final". This means that if a stop-loss or a target level is reached for any of the "additional instruments" (GLL for instance), but not for the "main instrument" (gold in this case), we will view positions in both gold and GLL as still open and the stop-loss for GLL would have to be moved lower. On the other hand, if gold moves to a stop-loss level but GLL doesn't, then we will view both positions (in gold and GLL) as closed. In other words, since it's not possible to be 100% certain that each related instrument moves to a given level when the underlying instrument does, we can't provide levels that would be binding. The levels that we do provide are our best estimate of the levels that will correspond to the levels in the underlying assets, but it will be the underlying assets that one will need to focus on regarding the signs pointing to closing a given position or keeping it open. We might adjust the levels in the "additional instruments" without adjusting the levels in the "main instruments", which will simply mean that we have improved our estimation of these levels, not that we changed our outlook on the markets. We are already working on a tool that would update these levels daily for the most popular ETFs, ETNs and individual mining stocks.
Our preferred ways to invest in and to trade gold along with the reasoning can be found in the how to buy gold section. Furthermore, our preferred ETFs and ETNs can be found in our Gold & Silver ETF Ranking.
As a reminder, Gold & Silver Trading Alerts are posted before or on each trading day (we usually post them before the opening bell, but we don't promise doing that each day). If there's anything urgent, we will send you an additional small alert before posting the main one.
Thank you.
Przemyslaw K. Radomski, CFA
Founder, Editor-in-chief


