Briefly: in our opinion, full (300% of the regular position size) speculative short positions in junior mining stocks are justified from the risk/reward point of view at the moment of publishing this Alert.
After a few failed attempts to break to new short-term highs, gold just made another attempt. This time it moved even higher, but it has already reversed and is back below the previous intraday high. 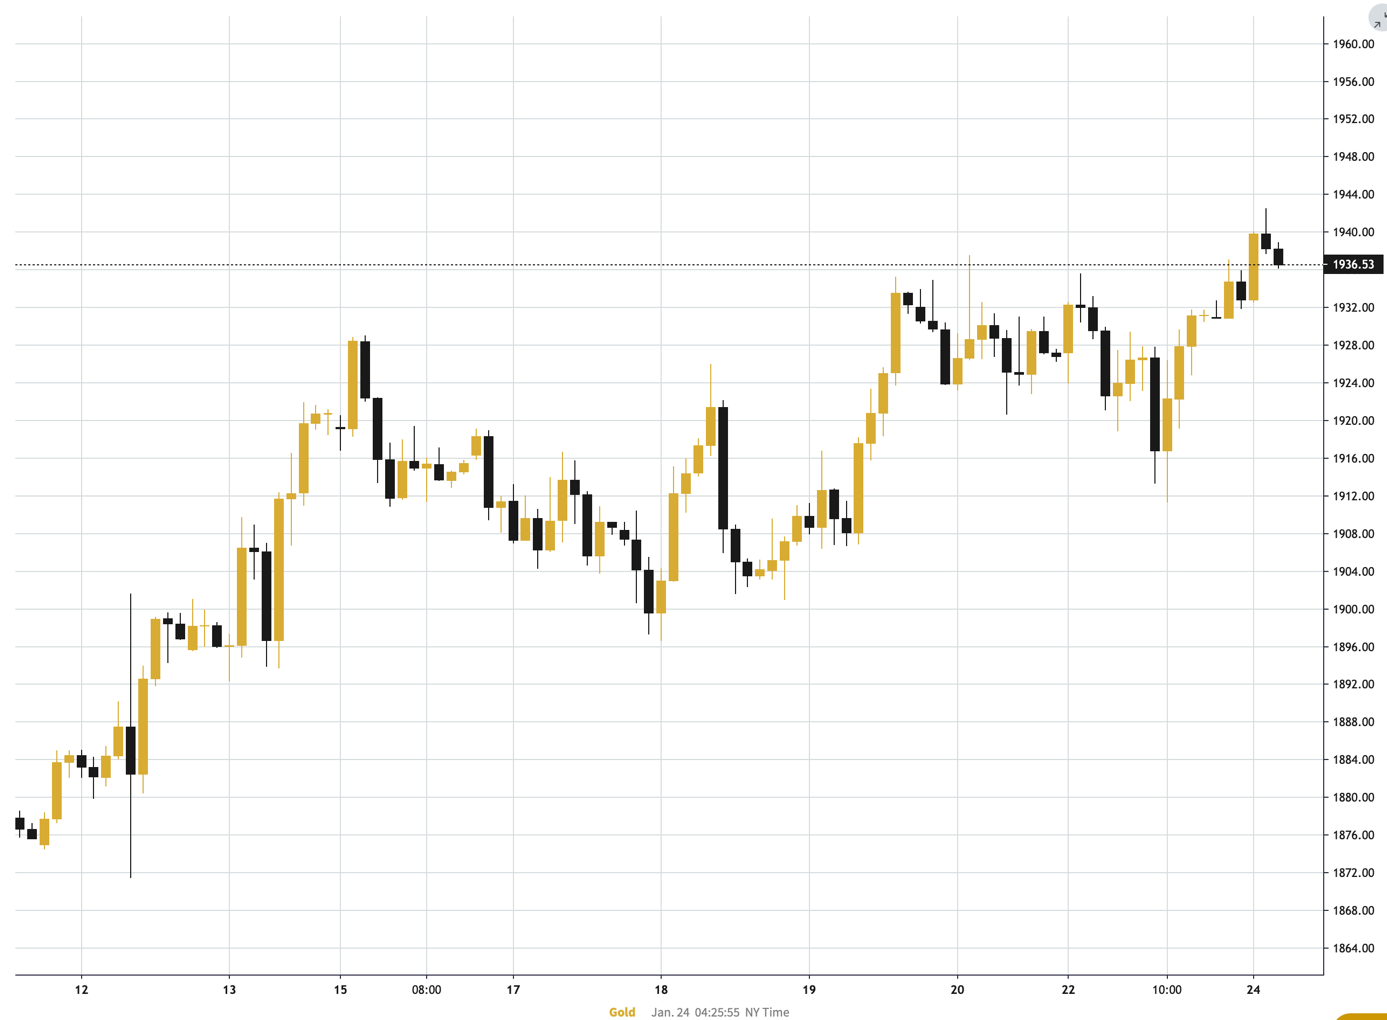
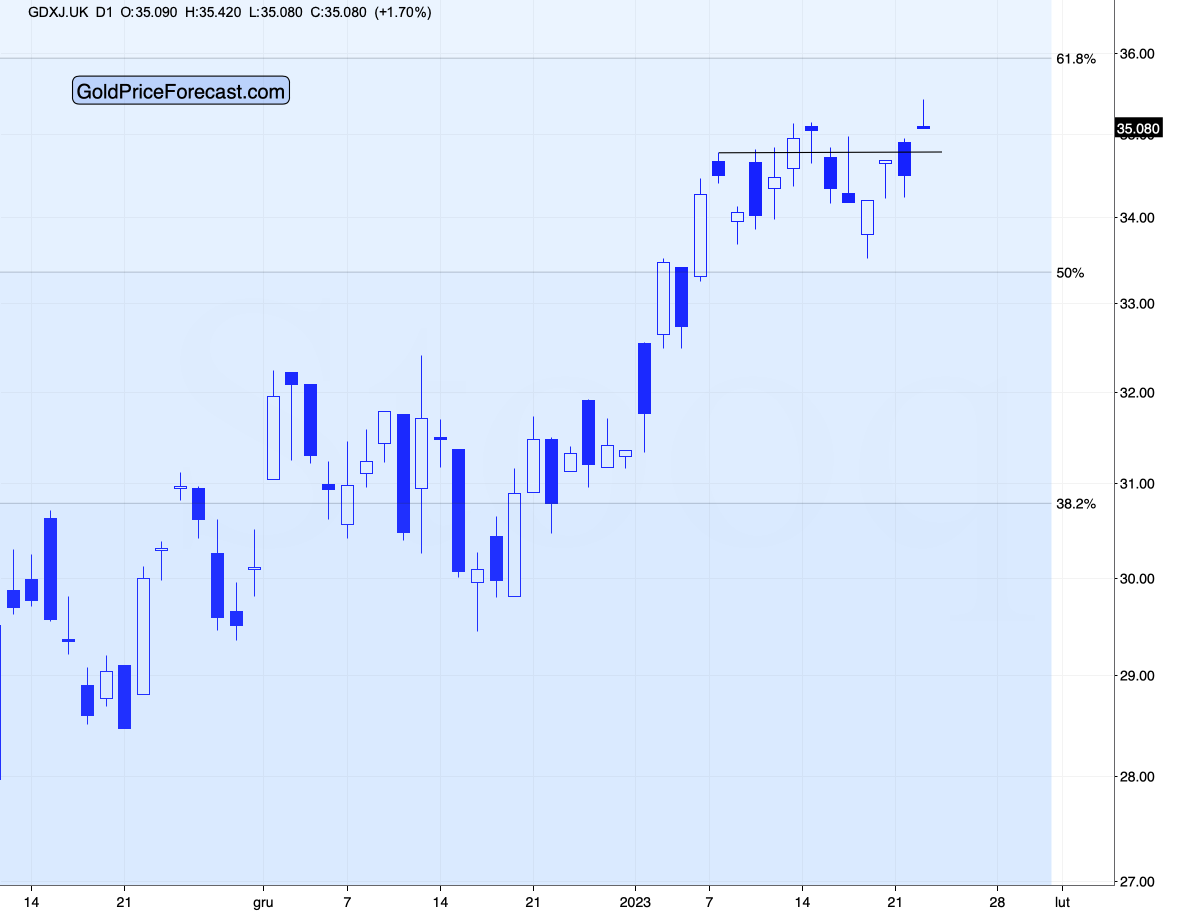
In response, junior miners moved slightly above their recent high, and then they moved back below them.
The GDXJ ETF did manage to move above its Jan. 9 intraday high, but it’s just a few-hour event, and given that half of that upswing was already erased, it doesn’t look stable at all.
Silver moved a bit higher, but it didn’t move close to its $24 resistance.
So, what does today’s overnight action change? Pretty much nothing.
Gold was unchanged yesterday, and the GDXJ moved lower by 0.6%. Today’s pre-market action is very far from being confirmed. This means that what I wrote about the context (and outlook) yesterday remains up-to-date:
Yes! The breakout above the $1,900 and 61.8% Fibonacci retracement levels in gold was confirmed, which is bullish.
Yup, that’s a fact, and there’s no denying it. However, does this single bullish fact change the outlook? I don’t think so. Here are a few major reasons why.
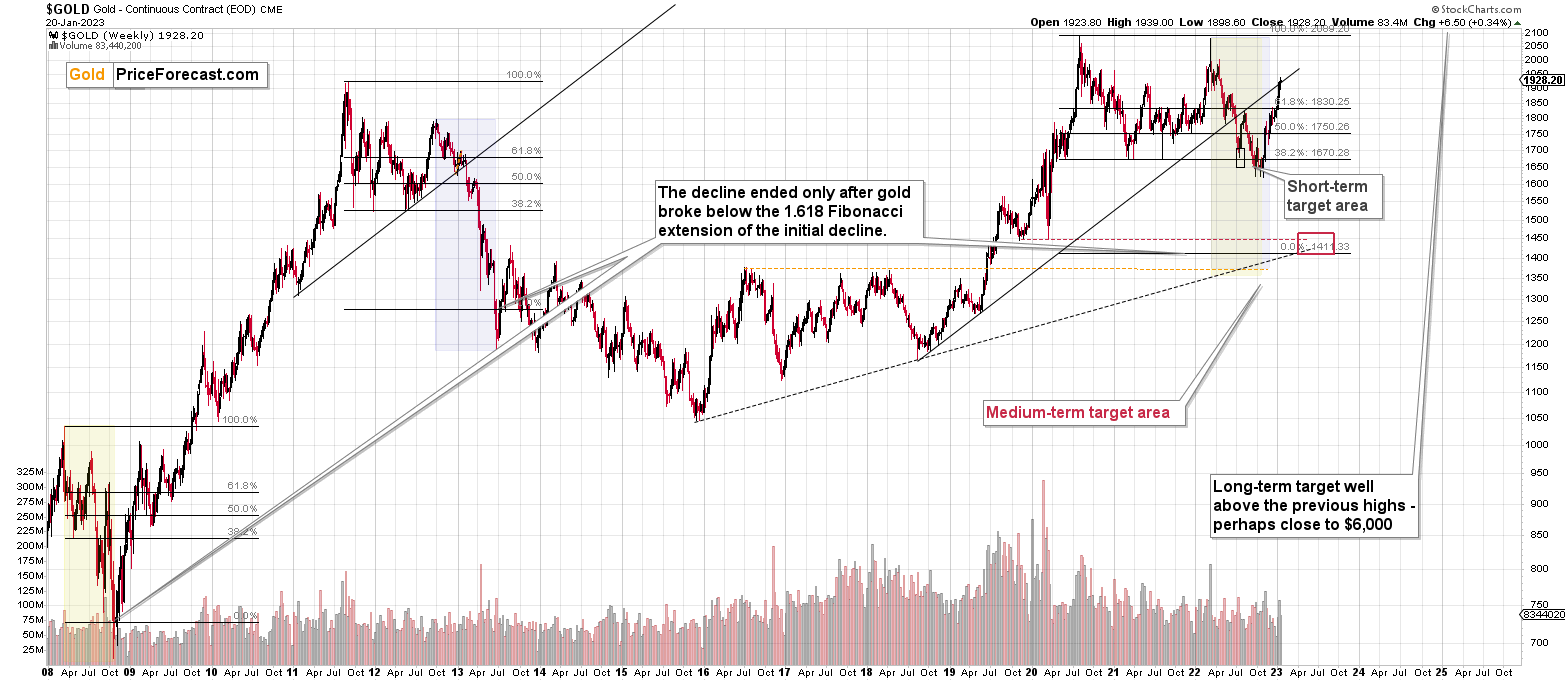
The most important one comes from gold’s very long-term chart.
I wrote about the key long-term fact a week ago:
Do you know what levels gold has recently reached? Hint: those are very, very, very important price levels…
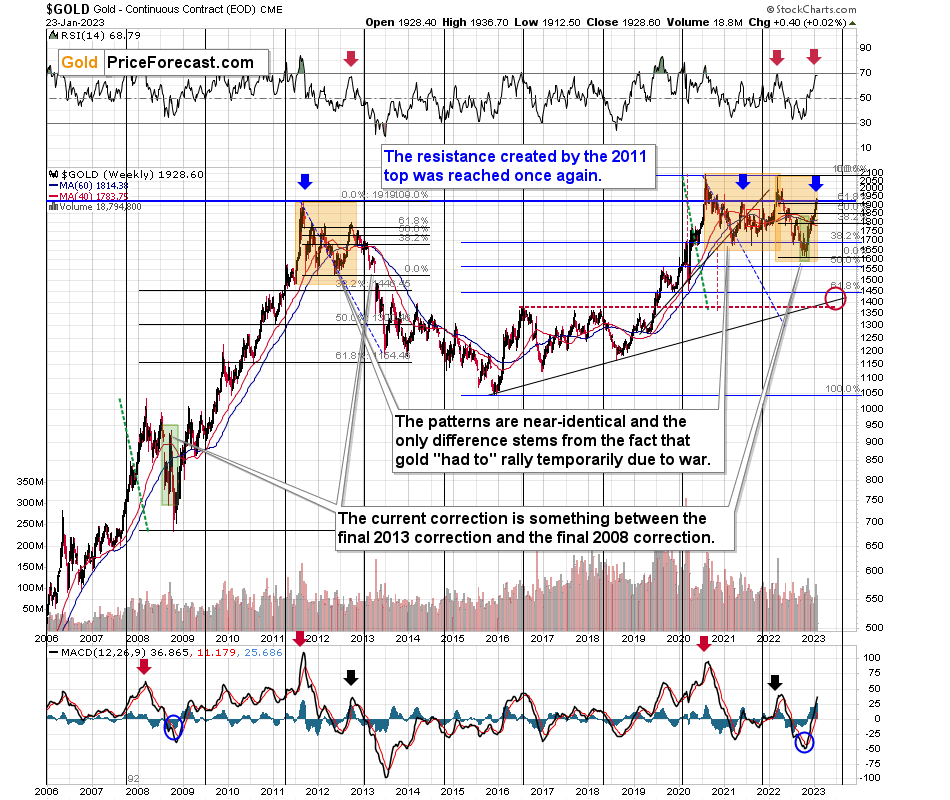
Gold just once again reached its 2011 high. The one that triggered reversals either immediately or after an additional rally (but it took a war outbreak in Europe to push gold temporarily (!) above this level). Therefore, the importance of this long-term resistance can’t be overstated.
That’s one thing. Another thing is that, given the major fundamental event that I already mentioned above (the war outbreak), it’s possible for the technical patterns to be prolonged and perhaps even repeated before the key consequence materialized. Similarly to the head-and-shoulders pattern that can have more than one right head before the breakdown and slide happen.
In gold’s case, this could mean that due to the post-invasion top, the entire 2011-2013-like pattern got two major highs instead of one. And thus, the initial decline and the subsequent correction are pretty much a repeat of what we saw in 2020 and early 2021, as well as what we saw in 2011 and 2012.
The particularly interesting fact (!) about the correction that we saw after the 2011-2012 decline (the one that was followed by the huge 2012-2013 decline) is that during it, gold corrected slightly more than 61.8% of the preceding medium-term decline. Consequently, the current situation is just like what happened back then.
And if all the above wasn’t bearish enough, please take a look at the reading of the RSI indicator based on the weekly price changes. It’s now just below 70, and guess where it was at the final top before the 2012-2013 slide? Yes, it was exactly there, too.
That’s also approximately where the RSI was at last year’s top.
Taking all the above into account clarifies that despite Friday’s and the last few weeks rallies, the medium-term outlook remains very bearish. Of course, that’s just my opinion, and please feel free to do with your capital what you see fit, but I’m keeping my money where my mouth is and I’m keeping my short position in junior mining stocks intact. All of last year’s trades were profitable, and, while I can’t promise any kind of performance, in my opinion the current one will become profitable (very profitable, actually) as well.
Since gold moved up by just $6.50 last week, the entire above quote remains up-to-date, and so do its bearish implications.
There’s also one more very important resistance level that gold reached that you already saw but that I didn’t write about. It’s clearly visible on the chart from the “Upcoming…” section that I’m posting in each Gold Trading Alert.
Namely, gold moved to its rising resistance line based on the initial two bottoms of the rally. The important thing about this line is that it has already worked twice: once as support in early 2022 and then as resistance shortly thereafter. It’s now working as resistance once again.
So, these are two important long-term-based bearish indications, and one of them sheds extra light on gold’s move above the 61.8% Fibonacci retracement, pretty much nullifying its bullishness.
Let’s keep in mind that the bearish (for gold!) implications of the USD Index’s death cross remain in place.
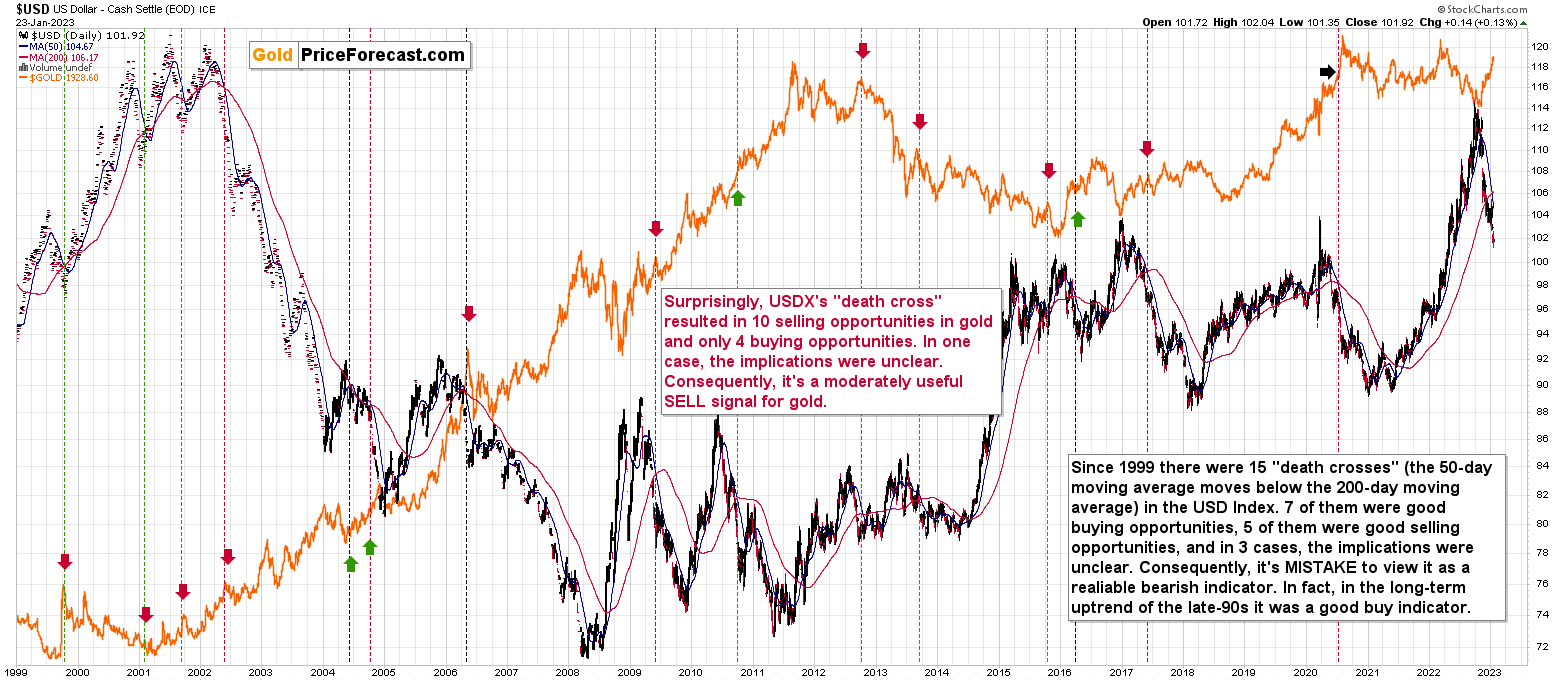
As a reminder, the “death cross” is a technical phenomenon that takes place when the 50-day moving average moves below the 200-day moving average. That happened recently in the case of the USD Index. This is an indication with a scary name that journalists often pick up on. “Journalists” and not “analysts,” and this means that it’s imperative to check if this technique really worked before taking any action based on it.
The above chart proves that over the past 24 years there have been no reliable indications for the USD Index based on the “death cross.”
The red vertical dashed lines mean that a given “death cross” was a good selling opportunity.
The green vertical dashed lines mean that a given “death cross” was a good buying opportunity.
The black vertical dashed lines mean that a given “death cross” isn’t a particularly useful indication.
7 of the “scary death crosses” were actually good buying opportunities; 5 were selling opportunities, and 3 had no major implications. Consequently, this is not a reliable signal for the USDX at all. If forced to choose a side, it would have slightly more bullish implications than bearish ones.
Always, always, always check if something works before applying it to practice, especially when it has a fancy name.
Interestingly. The implications for the gold market were much more reliable, and I marked them with arrows.
The red arrows mark good selling opportunities in gold in the case of the USD Index’s “death cross.”
The green arrows mark good selling opportunities in gold in the case of the USD Index’s “death cross.”
The black arrows mark unclear situations in gold in the case of the USD Index’s “death cross.”
In this case, we had 10 selling opportunities and just 4 buying opportunities. It’s far from 100% efficiency, but it’s decently bearish for gold, to say the least.
All in all, the current outlook remains bearish for gold and the rest of the precious metal sector for the following weeks and months.
Before moving to the fundamental part of today’s analysis, I’d like to interject a personal note, just in case you missed it yesterday (no worries, I won’t keep repeating it after today).
Personal Note
On a personal note, I would like to apologize for not being more active in the comments feed below articles lately. The reply to all questions that effectively mean “do you still think that junior miners are going to decline significantly?” is “ yes, I continue to think so, and you’re reading daily updates on that in the Gold Trading Alerts – I will say exactly the same thing in the analysis, in the comment feed, over the phone, in the video, and in person :).”
The transition from Sunshine Profits to Golden Meadow is underway, and since the shift is much bigger than what you saw so far, it requires quite a substantial amount of planning and leadership. Since about 1/3 of the plans are still mostly inside my head, I’m still required to participate personally, even though my brilliant directors take care of most things.
I’m also relocating to a different apartment, and it takes quite a lot of time to review them and pick something great (you don’t want echo in my videos, while I’m recording from my home office, right?).
I’m also engaged in a public speaking course, which ends in late March. On top of that, on Friday, I started… studying at Stanford University. You will find more about the Applied Compassion Training that I just joined over here: https://www.appliedcompassionacademy.com (scroll down that page for a familiar face). I’m the first person with the Chartered Financial Analyst designation to ever join the program. For my Capstone Project, which I’ll be realizing throughout the year, I plan to create a special course for Golden Meadow that helps to facilitate connections (authors-investors and investors-investors) and conversations and make them even more based on common goals, growth, and compassion than is the case right now. So, yes, I really do want to transform the way investment newsletters and investment education work.
Is There Trouble Ahead for Gold?
While a short squeeze dominated the stock market on Jan. 23, gold, silver and mining stocks underperformed. Moreover, with their momentum sputtering at a time when hawkish winds blow stronger, swift declines should materialize in the months ahead. To explain, we wrote on Jan. 23:
The Cleveland Fed expects the headline and core Consumer Price Indexes (CPIs) to increase by 0.53% and 0.46% month-over-month (MoM) in January, which annualize to 6.5% and 5.7% year-over-year (YoY), respectively.
Now, analyzing MoM inflation will be useful going forward, as monthly changes allow for annual estimates of where YoY inflation will go if the current trends persist. Therefore, with these MoM figures well beyond what’s needed for the Fed to reach its 2% mandate, the implications are profoundly hawkish.
To put it in context, 2% annual inflation requires MoM prints of less than 0.17%. So, with the current data tracking well above that, a pivot contrasts fundamental logic.
Likewise, with inflation poised to remain more persistent than the consensus expects, the U.S. federal funds rate (FFR) should have plenty of room to run.
Please see below:
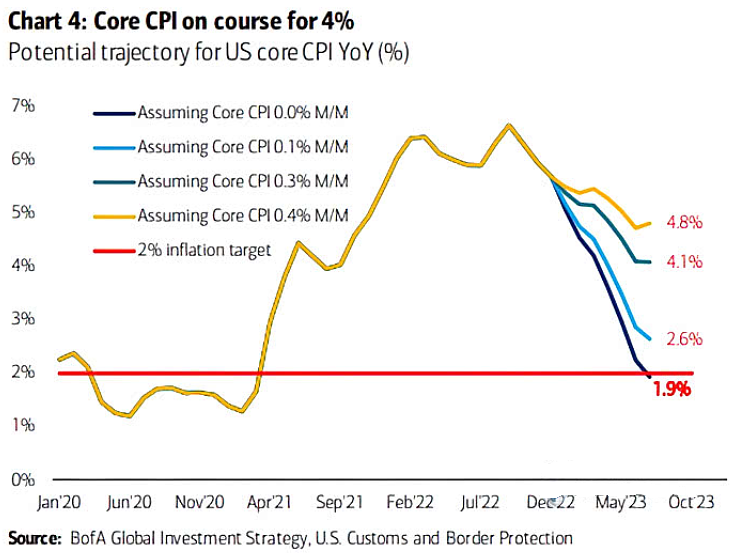 To explain, the colored lines above estimate the different YoY values for the core CPI near the fall of 2023 assuming various MoM prints. If you analyze the gold and dark blue lines above, you can see that continuous MoM prints of 0.40% and 0.30% will result in YoY core CPIs of 4.8% and 4.1%, respectively.
As a result, with the Cleveland Fed projecting 0.46% MoM in January, the bulls’ optimism continues to loosen financial conditions and spur more inflation; and with a continuation poised to keep the core CPI 2x to 2.5x the Fed’s 2% target, the data supports higher interest rates over the medium term.
In addition, we warned that China’s reopening would help stimulate commodity demand, and the backdrop is bullish for inflation. In the process, the FFR, real yields and the USD Index should benefit from the hawkish ramifications. Jeff Currie, Global Head of Commodities Research at Goldman Sachs, said on Jan. 11:
“What is the best [China] reopening play? It is oil. What is idled? Planes, trains and automobiles. You turn them all back on, that’s going to be a big pop in oil demand.”
Please see below:
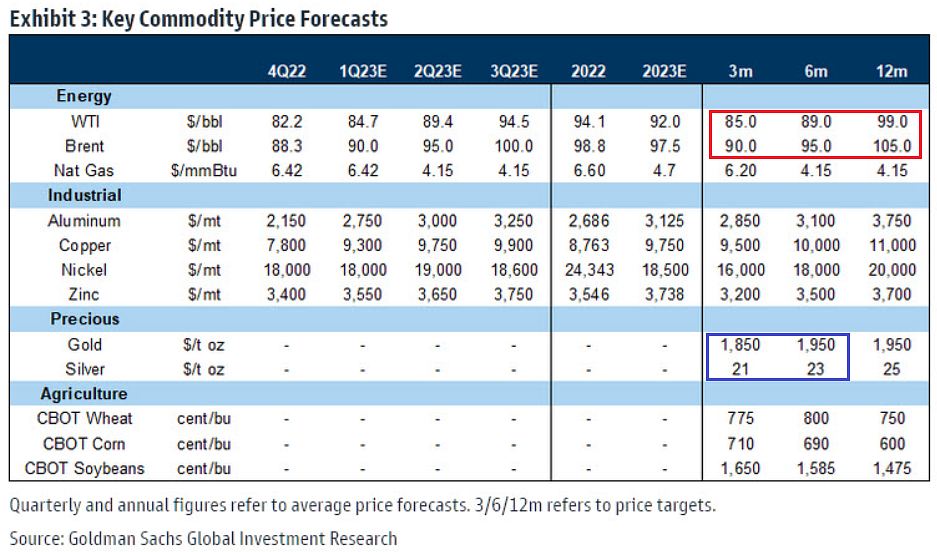 To explain, the red rectangle above shows that Goldman Sachs expects the WTI and Brent oil prices to range between $85 and $99, and $90 and $105, over the next three to 12 months. Thus, while the crowd has celebrated the decline in the headline CPI – even though the Sticky CPIs have hit new YoY highs for 17 straight months – Chinese oil demand could flip the script in the months ahead.
Remember, China is the world’s largest oil importer, and the country had been in a strict lockdown for months, which weighed on oil prices. But, with that headwind no longer present, the inflationary impact is material.
Also noteworthy, the blue rectangle above shows that Goldman Sachs expects gold and silver to range between $1,850 and $1.950, and $21 and $23 over the next three to six months. Therefore, even though Goldman Sachs is a commodities bull, the investment bank sees more downside than upside for gold, and material downside for silver versus the Jan. 23 closing prices.
So, while it may ‘feel’ like the PMs have substantial upside, the optimists are preaching caution over the next three months. As such, we share that caution, and expect even larger drawdowns as the liquidity drain continues.
Speaking of which, while the crowd underestimates the peak FFR, they’re also dismissing the other elephant in the room.
Please see below:
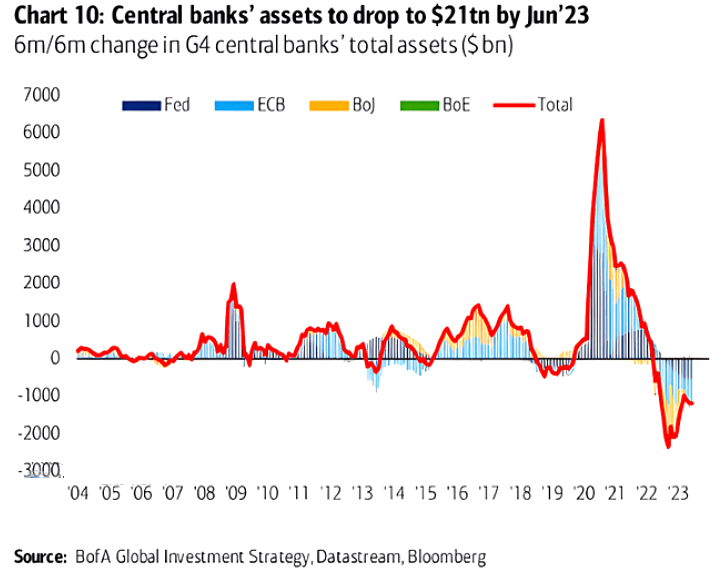 To explain, the red line above tracks the six-month change in assets held by the four major central banks. If you analyze the right side of the chart, you can see that quantitative tightening (QT) is in full swing, and the magnitude is like nothing we’ve seen in nearly 20 years.
Consequently, while the bulls continue to follow the post-GFC playbook, we’ve warned numerous times that those rules no longer apply. With inflation highly problematic, central banks can’t run to the rescue like they did in recent years. As it stands, QE is history, and the bulls should learn this lesson the hard way over the medium term.
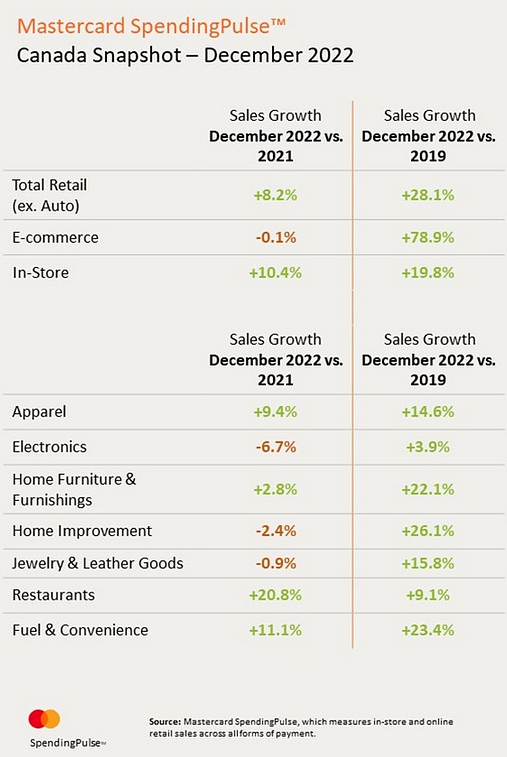
Furthermore, with demand still highly resilient, and North American central banks in a similar bind, the global tightening cycle should continue. For example, Mastercard released its Canadian retail sales report on Jan. 19. An excerpt read:
“Canadian retail sales, excluding automotive, increased +8.2% YoY in December,” and “In-store sales were up +10.4% YoY,” while “E-commerce sales were down marginally -0.1%.”
Michelle Meyer, Chief Economist for North America at the Mastercard Economics Institute, said:
“Without the pandemic restrictions of past holiday seasons, Canadians returned to in-store spending and celebrated the holiday season with family, friends and colleagues as seen by solid YoY spend increases in sectors such as restaurants, fuel and apparel.”
As a result, consumer demand was resilient versus the December 2021 figures (the left column) and robust versus the December 2019 figures (the right column), and the strength is bullish for short-term interest rates.
Please see below:
Overall, the economic data continues to move in a hawkish direction at a time when the PMs’ bullish momentum has started to dissipate. Despite the stock market’s enthusiasm, the gold price was flat and the GDXJ ETF declined; and with the PMs overvalued and the USD Index undervalued, we expect a reversal of fortunes in the months ahead.
Where do oil prices go in the next three to 12 months? Should the crowd be nervous about the inflationary impact? Why are the PMs not mirroring the S&P 500’s enthusiasm?
Silver’s Volatility Is Highly Bearish
Despite little economic news, the silver futures price traded within a nearly 6% range on Jan. 23; and while the white metal was saved by its 50-day moving average, its unprompted volatility should concern the bulls.
In addition, with silver seemingly forming a peak, while the USD Index attempts to form a bottom, a sharp shift should unfold sooner rather than later.
Please see below:
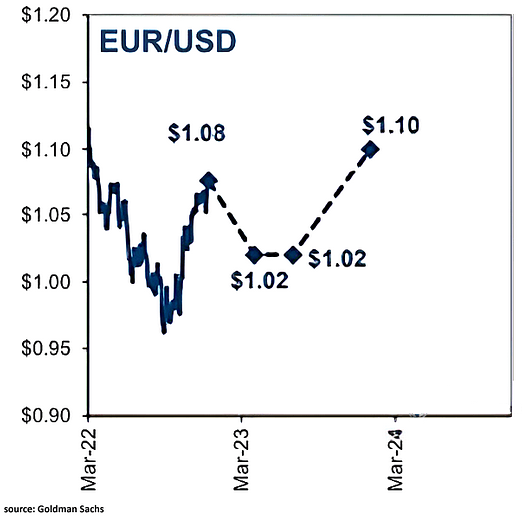 To explain, while the euro is immensely popular, the fundamentals do not support the bulls’ optimism. Moreover, Goldman Sachs expects the EUR/USD to sink to 1.02 in the months ahead, and a realization is profoundly bullish for the USD Index.
Remember, the EUR/USD accounts for nearly 58% of the dollar basket’s movement, so its behavior is material; and while the crowd thinks otherwise, the Fed should still out-hawk the ECB over the medium term.
Analysts at Danske Bank wrote on Jan. 17:
“We still pencil in Fed hiking policy rates above 5.0% in Q1 and think the inversion embedded into the U.S. curve for H2 2023 is overdone. Markets still price in c. 150bp more of ECB rate hikes, which is more than our base case, although we acknowledge the risk of ECB delivering more. In our view, continued tightening must ensure a re-tightening of financial conditions.
“EUR/USD remains overvalued on a 1-3Y horizon and unless we see global growth persistently accelerate, risks are eventually skewed towards a setback. We lift our profile but still pencil in a lower cross on 3-12M, forecasting the cross at 1.03 in 12M.”
Thus, while bearish bets on the EUR/USD are out-of-consensus once again, we were in the same position in 2021 when the crowd assumed the EUR/USD would hit 1.30; and with a similar setup present now, it’s likely only a matter of time before reality re-emerges.
Please see below:
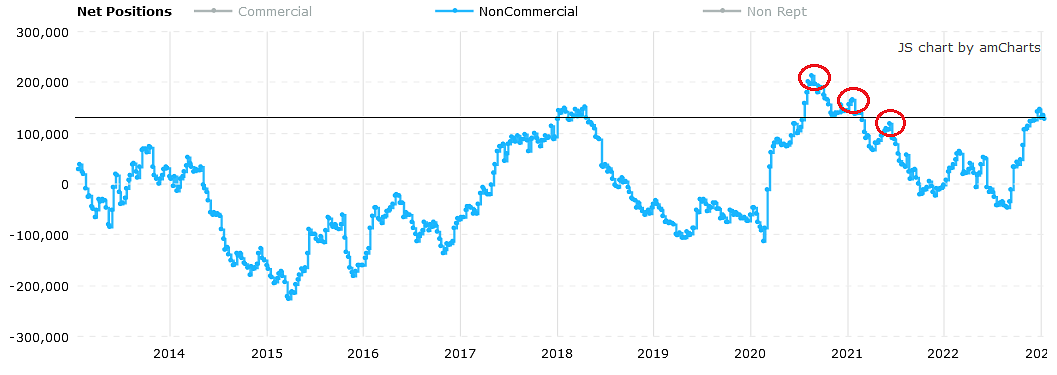 To explain, the blue line above tracks the net EUR/USD positioning of non-commercial (speculative) futures traders. If you analyze the horizontal black line, you can see that the crowd is extremely bullish on the currency pair, as their net-long positions are near the top of the ~10-year range.
However, if you focus your attention on the red circles, you can see that crowded positioning made lower highs in 2020/2021 before the EUR/USD collapsed. Likewise, you can also see how the crowd turned prematurely bullish in early 2022 when they assumed the Fed would pivot.
Therefore, please remember that positioning is contrarian, and outcomes rarely align with consensus expectations; and with the consensus overwhelmingly bullish on the EUR/USD, we expect another positioning unwind to help propel the USD Index to new highs later in 2023.
On top of that, while the physical silver market has rewarded the bulls in recent years, the futures market trades much differently; and with silver’s drawdowns often occurring alongside S&P 500 sell-offs, a deep dive by the latter could sink the former.
For example, the silver price made its 2022 lows with the S&P 500 in September and October; and with Morgan Stanley’s Chief U.S. Equity Strategist Mike Wilson sounding the bearish alarm on Jan. 22, he “welcome[s] the sentiment and positioning [shift] over the past few weeks.” He wrote:
“The final stages of the bear market are always the trickiest, and we have been on high alert for such head fakes…. Suffice it to say, we're not biting on this recent rally because our work and process are so convincingly bearish on earnings.”
He noted that the difference between his and Wall Street’s 2023 S&P 500 earnings expectation is “as wide as it’s ever been,” and “The last two times our model was this far below consensus, the S&P 500 fell by 34% and 49%.”
Please see below:
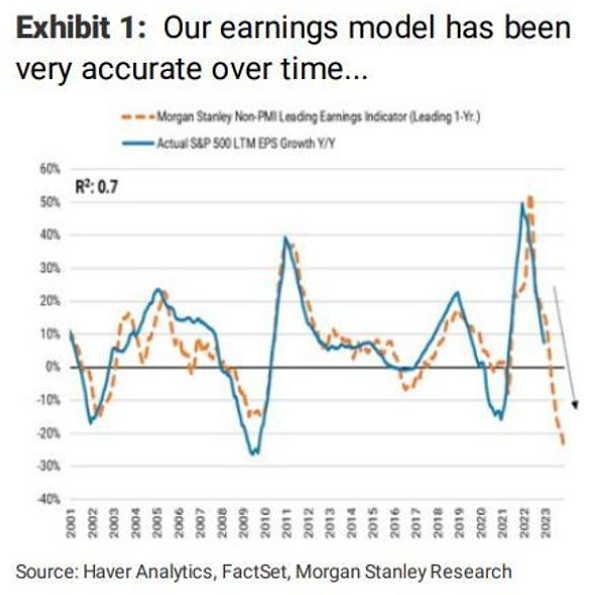 To explain, the blue line above tracks the YoY percentage change in 12-month realized S&P 500 earnings per share (EPS), while the brown dashed line above tracks the 12-month forward YoY EPS change implied by Morgan Stanley’s model.
If you analyze the relationship, you can see that the pair have largely followed in each other’s footsteps. More importantly, the large gap on the right side of the chart shows that Wilson expects a YoY earnings decline (> 20%) that rivals the GFC (the lowest point of the blue line). As a result, if his prediction proves prescient, the silver price should suffer mightily as the drama unfolds.
Overall, $24 has been silver’s kryptonite, and the white meal briefly fell below $23 on Jan. 23; and while the debt ceiling drama could create more volatility, silver’ recent behavior is an ominous sign for the precious metals market. Consequently, we remain sellers at these inflated levels.
How will the euro fare over the next few months? Will an S&P 500 sell-off help propel the USD Index higher, or is Wilson wrong? Why is silver so reluctant to hold $24?
The Bottom Line
The PMs are flashing warning signs, and silver’s behavior highlights the pivot uncertainty that’s slowly creeping into the financial markets. Conversely, with the USD Index finding support and euro bulls overplaying their hand, a profound shift should occur sooner rather than later. Furthermore, if (when) another bout of panic crushes the S&P 500, a Cboe Volatility Index (VIX) spike could accelerate the dollar basket’s resurgence. To explain, we wrote on Jan. 20:
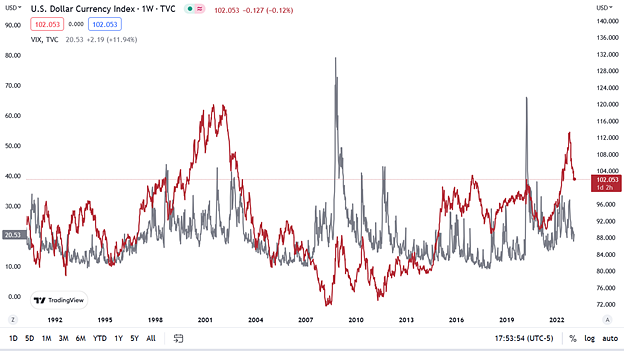 The red line above tracks the weekly movement of the USD Index, while the gray line above tracks the weekly movement of the VIX. As you can see, when the VIX rises, the USD Index is often a major beneficiary. Moreover, whether the USD Index is at high or low levels and panic strikes, the dollar basket often rallies hard, regardless of the starting position.
In conclusion, the PMs were mixed on Jan. 23, as gold ended the day slightly positive. However, silver’s behavior was highly ominous, and the white metal can be the canary in the coal mine for bearish reversals. Therefore, we still expect gold, silver and mining stocks to hit new lows before this bear market ends.
Overview of the Upcoming Part of the Decline
- It seems to me that the corrective upswing is over (or about to be over) and that the next big move lower is already underway (or that it’s about to start).
- If we see a situation where miners slide in a meaningful and volatile way while silver doesn’t (it just declines moderately), I plan to – once again – switch from short positions in miners to short positions in silver. At this time, it’s too early to say at what price levels this could take place and if we get this kind of opportunity at all – perhaps with gold prices close to $1,500 - $1,550.
- I plan to switch from the short positions in junior mining stocks or silver (whichever I’ll have at that moment) to long positions in junior mining stocks when gold / mining stocks move to their 2020 lows (approximately). While I’m probably not going to write about it at this stage yet, this is when some investors might consider getting back in with their long-term investing capital (or perhaps 1/3 or 1/2 thereof).
- I plan to return to short positions in junior mining stocks after a rebound – and the rebound could take gold from about $1,450 to about $1,550, and it could take the GDXJ from about $20 to about $24. In other words, I’m currently planning to go long when GDXJ is close to $20 (which might take place when gold is close to $1,450), and I’m planning to exit this long position and re-enter the short position once we see a corrective rally to $24 in the GDXJ (which might take place when gold is close to $1,550).
- I plan to exit all remaining short positions once gold shows substantial strength relative to the USD Index while the latter is still rallying. This may be the case with gold prices close to $1,400 and GDXJ close to $15 . This moment (when gold performs very strongly against the rallying USD and miners are strong relative to gold after its substantial decline) is likely to be the best entry point for long-term investments, in my view. This can also happen with gold close to $1,400, but at the moment it’s too early to say with certainty.
- The above is based on the information available today, and it might change in the following days/weeks.
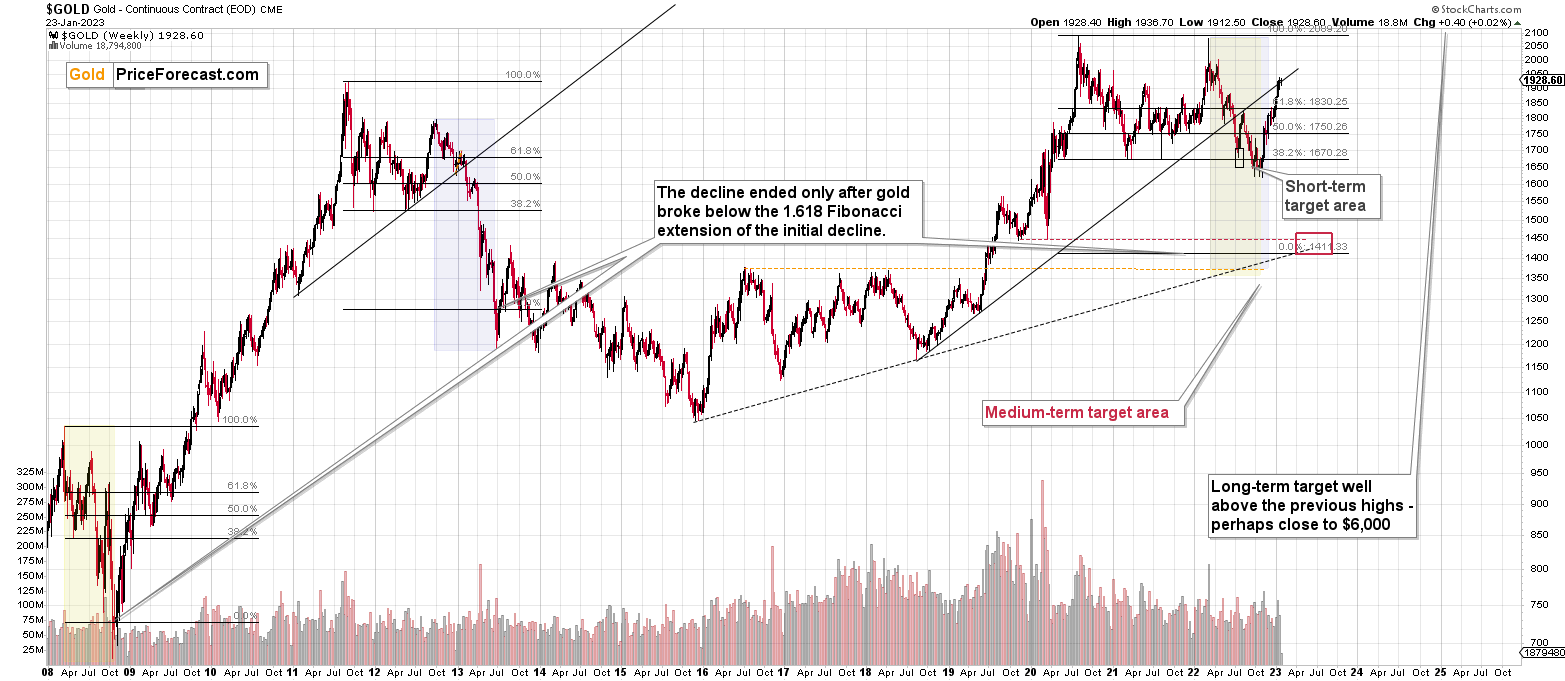
You will find my general overview of the outlook for gold on the chart below:
Please note that the above timing details are relatively broad and “for general overview only” – so that you know more or less what I think and how volatile I think the moves are likely to be – on an approximate basis. These time targets are not binding nor clear enough for me to think that they should be used for purchasing options, warrants, or similar instruments.
Letters to the Editor
We received a few messages over e-mail, but as we are moving to our new platform, we will be transferring them below the articles as comments – and that’s where we’ll be replying to them.
Asking your questions below the articles or in the spaces called “Ask the Community” or “Position Sizes” directly will help us deliver a reply sooner. In some cases, someone from the community might reply and help even before we do.
Please remember about the Pillars of our Community, especially about the Kindness of Speech Pillar.
Also, if there’s anything that you’re unhappy with, it’s best to send us a message at [email protected].
Please note that this section is going to go away within the next 1-8 weeks, as you can add comments/questions below the article on Golden Meadow – the platform that we’re using to provide our analyses. Your notification e-mails include an invitation link that allows you to access the “Gold Trading Alerts” space.
Also, if you haven’t had the chance to see the video, in which I’m talking about the new platform and why we essentially moved from Sunshine Profits to Golden Meadow, I strongly encourage you to do so:
Summary
Summing up, it seems that the major bottom in the USD Index is in (or at hand), while the correction in stocks, gold, silver, and mining stocks is over – or very close to being over.
Gold and silver correct about 61.8% of their 2022 decline, while junior miners corrected a bit more than 50% of the decline. The breakouts above those levels were invalidated recently, and we see another attempt to move higher. Given miners’ weakness relative to gold, gold’s very long-term resistance (the 2011 high!), and the situation in the USD Index, it seems that the next big move lower in the precious metals sector is about to start.
Now, as more investors realize that interest rates will have to rise sooner than expected, the prices of precious metals and mining stocks (as well as other stocks) are likely to fall. In my opinion, the current trading position is going to become profitable in the following weeks, and quite possibly in the following days. And while I can’t promise any kind of performance, I fully expect it to become very profitable before it’s over and to prolong our 2022 winning streak.
After the final sell-off (that takes gold to about $1,350-$1,500), I expect the precious metals to rally significantly. The final part of the decline might take as little as 1-5 weeks, so it's important to stay alert to any changes.
As always, we'll keep you – our subscribers – informed.
To summarize:
Trading capital (supplementary part of the portfolio; our opinion): Full speculative short positions (300% of the full position) in junior mining stocks are justified from the risk to reward point of view with the following binding exit profit-take price levels:
Mining stocks (price levels for the GDXJ ETF): binding profit-take exit price: $20.32; stop-loss: none (the volatility is too big to justify a stop-loss order in case of this particular trade)
Alternatively, if one seeks leverage, we’re providing the binding profit-take levels for the JDST (2x leveraged). The binding profit-take level for the JDST: $22.87; stop-loss for the JDST: none (the volatility is too big to justify a SL order in case of this particular trade).
For-your-information targets (our opinion; we continue to think that mining stocks are the preferred way of taking advantage of the upcoming price move, but if for whatever reason one wants / has to use silver or gold for this trade, we are providing the details anyway.):
Silver futures downside profit-take exit price: $14.32
SLV profit-take exit price: $13.42
ZSL profit-take exit price: $48.87
Gold futures downside profit-take exit price: $1,504
HGD.TO – alternative (Canadian) 2x inverse leveraged gold stocks ETF – the upside profit-take exit price: $16.47
HZD.TO – alternative (Canadian) 2x inverse leveraged silver ETF – the upside profit-take exit price: $36.87
Long-term capital (core part of the portfolio; our opinion): No positions (in other words: cash)
Insurance capital (core part of the portfolio; our opinion): Full position
Whether you’ve already subscribed or not, we encourage you to find out how to make the most of our alerts and read our replies to the most common alert-and-gold-trading-related-questions.
Please note that we describe the situation for the day that the alert is posted in the trading section. In other words, if we are writing about a speculative position, it means that it is up-to-date on the day it was posted. We are also featuring the initial target prices to decide whether keeping a position on a given day is in tune with your approach (some moves are too small for medium-term traders, and some might appear too big for day-traders).
Additionally, you might want to read why our stop-loss orders are usually relatively far from the current price.
Please note that a full position doesn't mean using all of the capital for a given trade. You will find details on our thoughts on gold portfolio structuring in the Key Insights section on our website.
As a reminder - "initial target price" means exactly that - an "initial" one. It's not a price level at which we suggest closing positions. If this becomes the case (as it did in the previous trade), we will refer to these levels as levels of exit orders (exactly as we've done previously). Stop-loss levels, however, are naturally not "initial", but something that, in our opinion, might be entered as an order.
Since it is impossible to synchronize target prices and stop-loss levels for all the ETFs and ETNs with the main markets that we provide these levels for (gold, silver and mining stocks - the GDX ETF), the stop-loss levels and target prices for other ETNs and ETF (among other: UGL, GLL, AGQ, ZSL, NUGT, DUST, JNUG, JDST) are provided as supplementary, and not as "final". This means that if a stop-loss or a target level is reached for any of the "additional instruments" (GLL for instance), but not for the "main instrument" (gold in this case), we will view positions in both gold and GLL as still open and the stop-loss for GLL would have to be moved lower. On the other hand, if gold moves to a stop-loss level but GLL doesn't, then we will view both positions (in gold and GLL) as closed. In other words, since it's not possible to be 100% certain that each related instrument moves to a given level when the underlying instrument does, we can't provide levels that would be binding. The levels that we do provide are our best estimate of the levels that will correspond to the levels in the underlying assets, but it will be the underlying assets that one will need to focus on regarding the signs pointing to closing a given position or keeping it open. We might adjust the levels in the "additional instruments" without adjusting the levels in the "main instruments", which will simply mean that we have improved our estimation of these levels, not that we changed our outlook on the markets. We are already working on a tool that would update these levels daily for the most popular ETFs, ETNs and individual mining stocks.
Our preferred ways to invest in and to trade gold along with the reasoning can be found in the how to buy gold section. Furthermore, our preferred ETFs and ETNs can be found in our Gold & Silver ETF Ranking.
As a reminder, Gold & Silver Trading Alerts are posted before or on each trading day (we usually post them before the opening bell, but we don't promise doing that each day). If there's anything urgent, we will send you an additional small alert before posting the main one.
Thank you.
Przemyslaw K. Radomski, CFA
Founder, Editor-in-chief


