Briefly: in our opinion, full (300% of the regular position size) speculative short positions in mining stocks are justified from the risk/reward point of view at the moment of publishing this Alert.
The situation on the precious metals and currency markets is developing in tune with my previous expectations, so the technical part of today’s analysis will have quite a few quotations from the previous days – it simply remains up-to-date.
Let’s start with the USD Index.
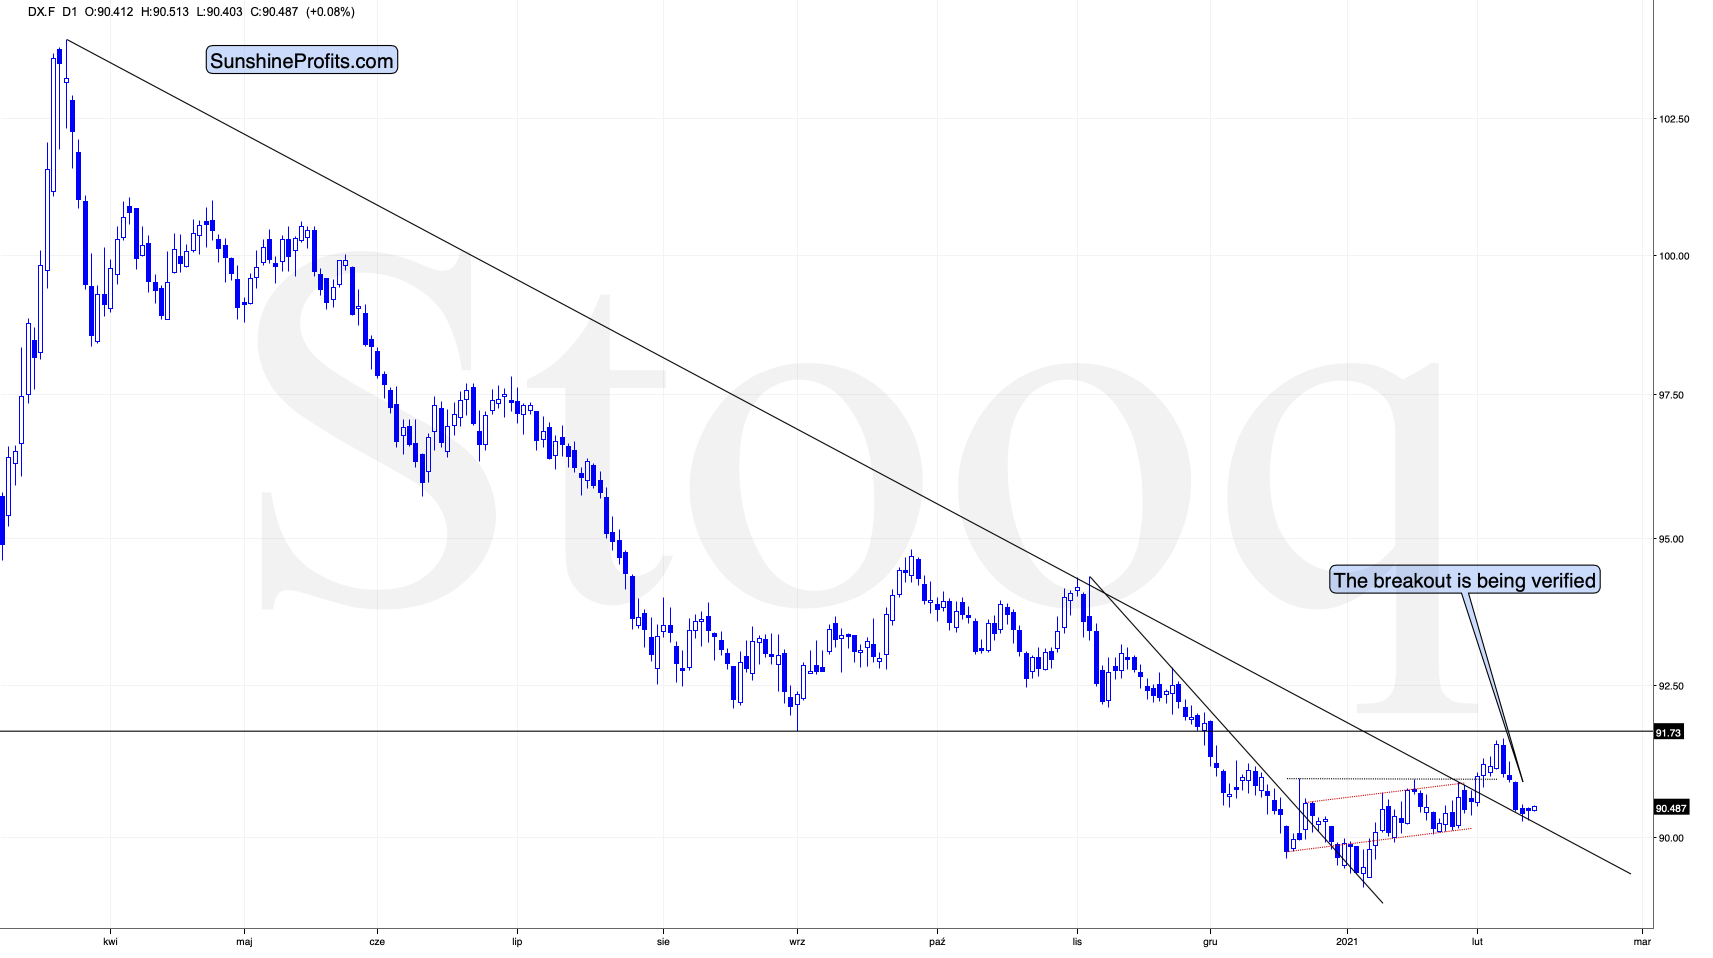
Figure 1 - USD Index
I previously wrote that because assets don’t move in a straight line, it’s plausible that the USD Index retests its declining resistance line, while gold retests its rising support line. If this occurs, the USDX is likely to decline to the 90.6 range, while gold will receive a short-term boost. I emphasized that the outcome does not change their medium-term trends and the above confirmations signal that the USDX is heading north and gold is heading south.
The part that I put in bold is exactly what is being realized right now. The USDX is correcting after the breakout, likely verifying the previous resistance as support.
Unless the USDX breaks back below the declining medium-term support line in a meaningful way, the bullish implications for the following weeks will remain intact. At the moment of writing these words, the USD Index is very close to the support line, above it, and after two intraday attempts to move lower – attempts that failed. This means that it’s quite likely to reverse and start to rally shortly.
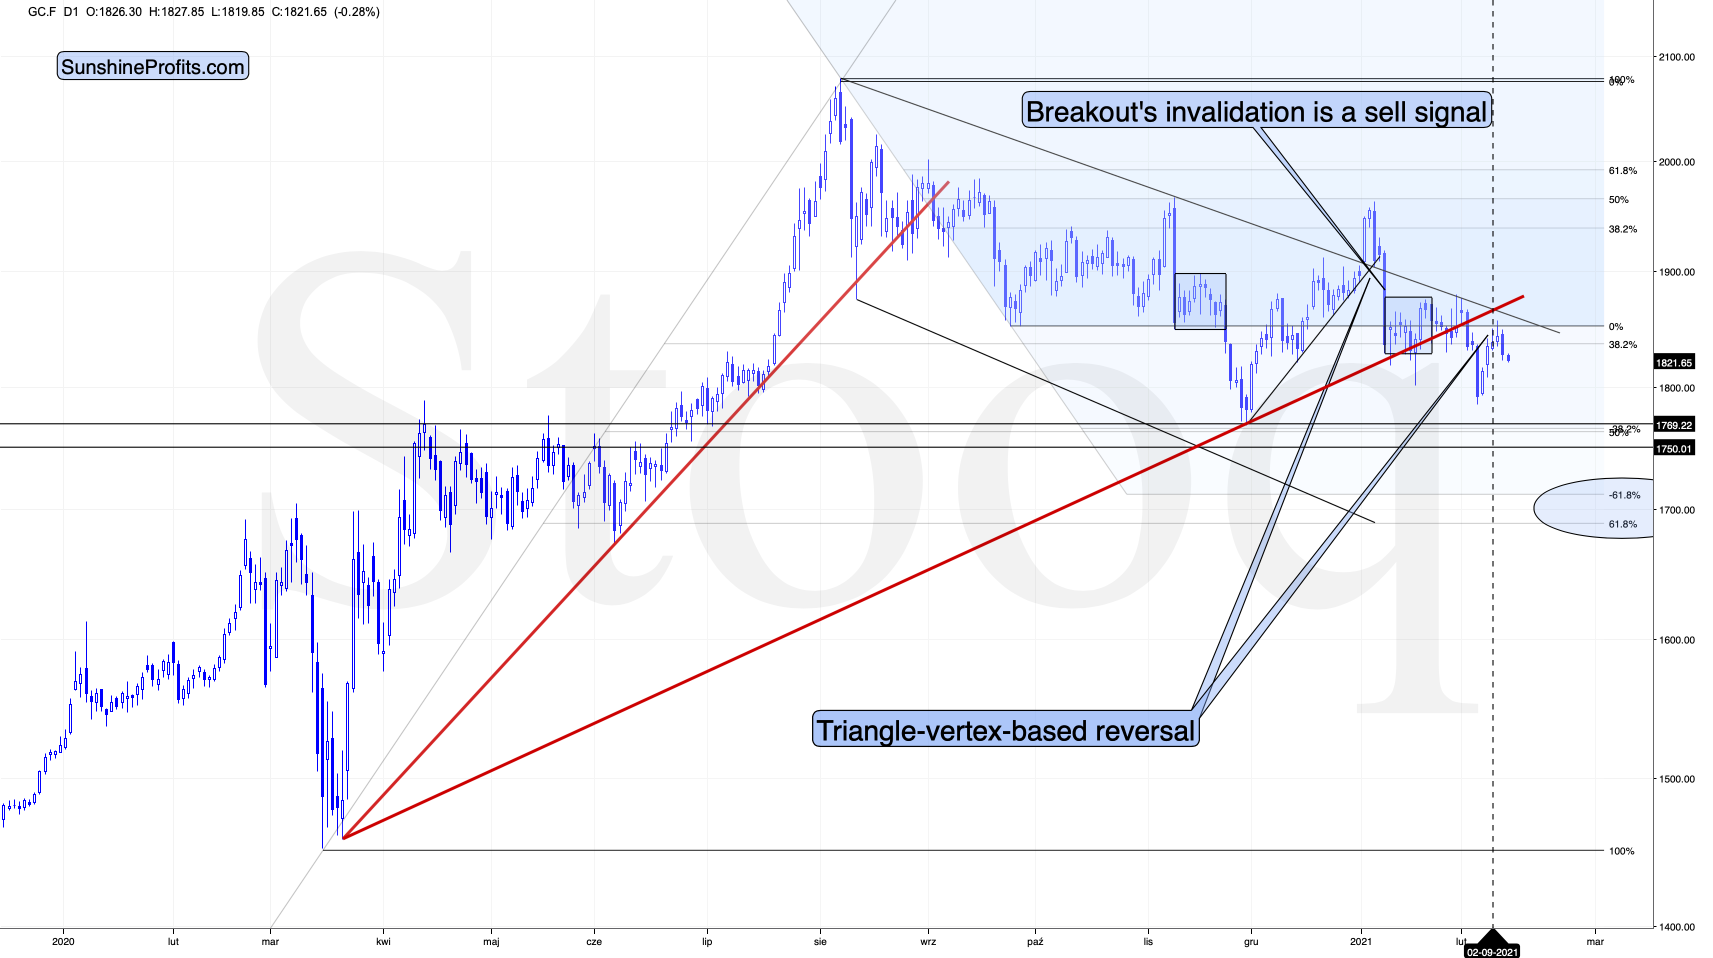
Figure 2 - COMEX Gold Futures
The particularly bearish clue from the last few days is that gold didn’t even wait for the USD Index to start to rally back up, in order to decline itself.
No wonder – it was after a short-term rally, and it had a quite clear triangle-vertex-based reversal point, so it was very likely to reverse. That’s exactly what gold did. Now, as the USD Index rallies once again, it’s likely to trigger another downswing in the yellow metal, likely a substantial one.
What about silver – did the white metal change anything?
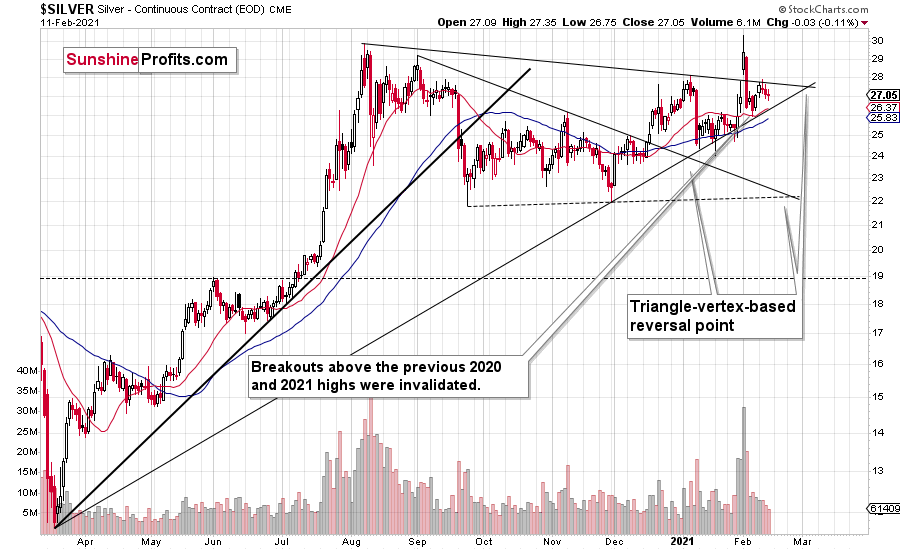
Figure 3 - COMEX Silver Futures
Not really. Just like gold, silver is taking a breather after the increased volatility. This is normal.
And the miners?
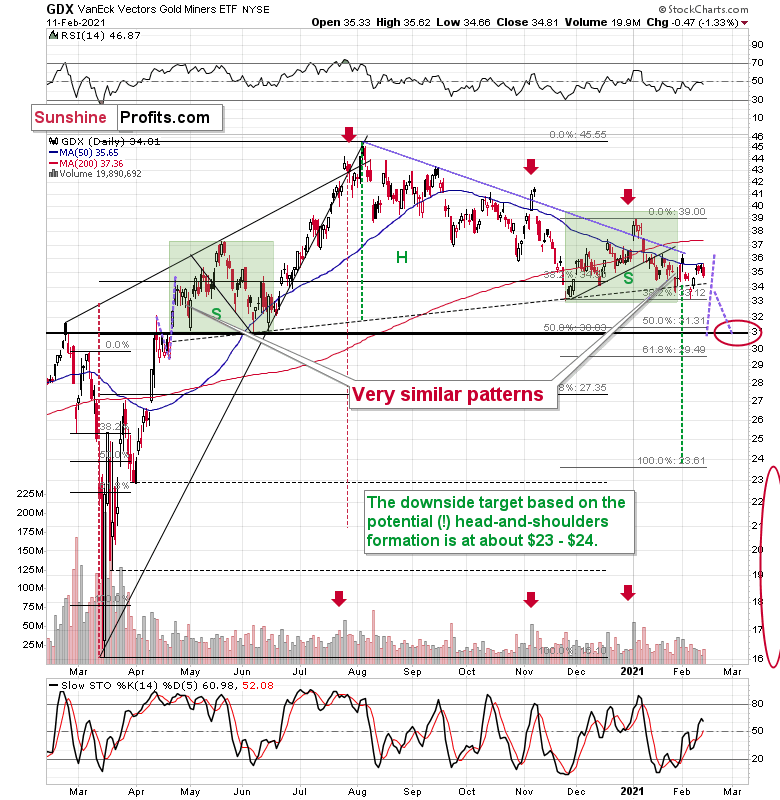
Figure 4 - VanEck Vectors Gold Miners ETF (GDX)
Just like gold, mining stocks declined yesterday (Feb. 11). This move is not yet substantial, but it seems to be the start of something bigger. My previous comments on the above chart remain up-to-date:
Mining stocks are not doing anything right now – they are moving back and forth in a calm manner – just like what they did at the beginning of the year. Back then this was a top that was being formed, and given what I wrote earlier today and – more importantly – what I’ve been writing about in the previous days and weeks (Monday’s flagship Gold & Silver Trading Alert features myriads of details), this could be the start of another bigger move lower. The next downside target is at about $31 in case of the GDX ETF, after which I expect to see a rebound to the $33 - $34 area.
Ever since the mid-September breakdown below the 50-day moving average, the GDX ETF was unable to trigger a substantial and lasting move above this MA. The times when the GDX was able to move above it were also the times when the biggest short-term declines started.
(…)
The most recent move higher only made the similarity of this shoulder portion of the bearish head-and-shoulders patternto the left shoulder (figure 2 - both marked with green) bigger. This means that when the GDX breaks below the neck level of the pattern in a decisive way, the implications are likely to be extremely bearish for the next several weeks or months.
Due to the uncanny similarity between the two green rectangles, I decided to check what happens if this mirror-similarity continues. I used purple, dashed lines for that. There were two important short-term price swings in April 2020 – one shows the size of the correction and one is a near-vertical move higher.
Copying these price moves (purple lines) to the current situation, we get a scenario in which GDX (mining stocks) moves to about $31 and then comes back up to about $34. This would be in perfect tune with what I wrote previously. After breaking below the head-and-shoulders pattern, gold miners would then be likely to verify this breakdown by moving back up to the neck level of the pattern. Then, we would likely see another powerful slide – perhaps to at least $24.
This is especially the case, since silver and mining stocks tend to decline particularly strongly if the stock market is declining as well. And while the exact timing of the market’s slide is not 100% clear, the day of reckoning for stocks is coming. And it might be very, very close.
As I explained yesterday (in the Letters to the Editor section) it could be the case that the precious metals sector declines for about 3 months after the general stock market tops. And it seems that we won’t have to wait long for the latter.
Having said that, let’s take a look at the market from a more fundamental angle.
Running from Reality
As U.S. equity investors deliberate the next flimsy upside catalyst, trouble is brewing beneath the surface.
Nearing the precipice of historical precedent, the S&P 500 is approaching a cliff that marked material reversals in 1982 and 2009.
Please see below:
Figure 5 - Source: thedailyshot.com
If you follow the vertical red line near the middle of the chart above, you can see that ~216 trading days after forming a bottom, it marked significant turning points for the S&P 500 in 1982 and 2009. En route to the milestones, today’s S&P 500 rally has been nearly identical. If you focus on the first blue line (top left of the vertical red line), you can see that 2020’s story has yet to be written. However, if history is any indication, the plot could get interesting in the not-so-distant future.
But if a drawdown does occur, U.S. equities’ safety net has been absolutely obliterated. On Feb. 10, I warned that the cash positions of fund managers were at an all-time low, while S&P 500 short-interest was at its lowest level since the dot-com bubble peak.
I wrote:
Figure 6
Fund managers’ cash positions and short sellers are akin to airbags in your car. In the event of a crash, airbags serve their purpose by cushioning the blow. Similarly, when the market crashes, short sellers cover their positions (by purchasing the underlying asset), helping to alleviate the downward impact. Similarly, when fund managers’ cash positions are high, they have more ‘dry powder’ at their disposal to hit the bid and support prices. As a result, with both variables being excommunicated, nearly every investor is now driving with their pedal to the metal.
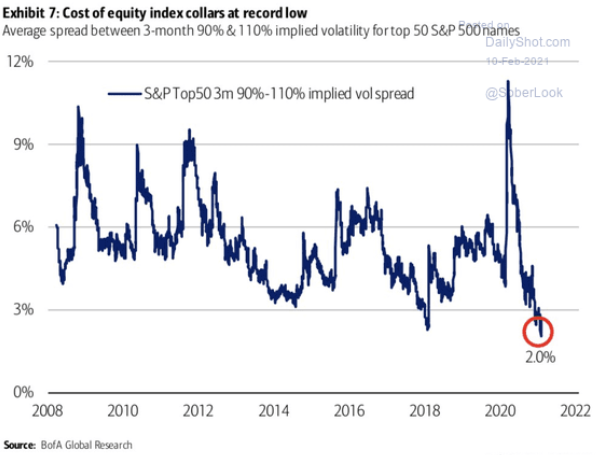
And continuing to floor it, the cost of put options relative to call options just hit its lowest level in 20 years. For context, call options profit when an asset’s price rises, while put options profit when an asset’s price falls. As a result, hedging activity has completely collapsed.
Please see below:
Figure 7
To explain, option prices are primarily determined by implied volatility (IV). When IV is high, it increases the likelihood that the underlying asset will rise above or fall below the option’s strike price. As it relates to the chart above, because the blue line has made a sharp mover lower, it means that IV for puts is lagging substantially behind calls. The key takeaway? Despite the S&P 500 trading near its all-time high, investors still believe that there is little downside risk.
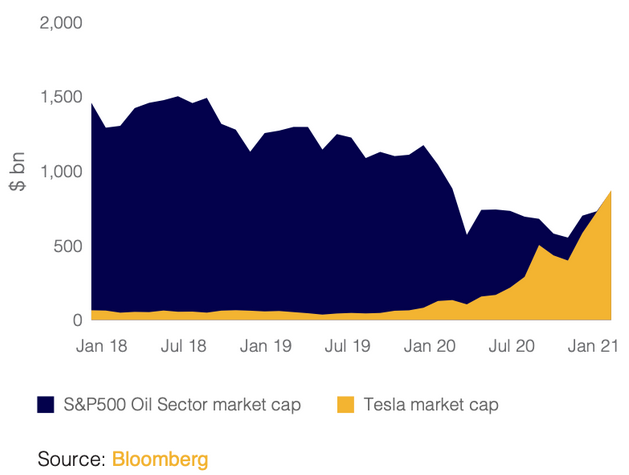
Encapsulating the meteoric rise, Tesla’s market cap is now greater than the combined market cap of every oil company within the S&P 500.
Please see below:
Figure 8
To explain, the blue area represents the oil sector’s market cap, while the gold area represents Tesla’s market cap. From 2018 until the pandemic struck, notice how the oil companies’ combined market cap dwarfed the electric automaker? In contrast, once the pandemic-induced frenzy unfolded, the “this time is different” crowd suddenly had different views on valuation.
Adding to the excess, special purpose acquisition companies (SPACs) are raising money faster than they can spend it. For context, on Feb. 4, I wrote:
SPACs are essentially publicly traded hedge funds. SPAC managers raise money and IPO the company with the intent of purchasing private and/or public companies. However, the key word is ‘intent.’ Investors that purchase SPAC shares have no idea when an acquisition will be made. Furthermore, because the majority of SPAC managers target early-stage technology companies, investors end up buying unprofitable companies at multiples akin to the dot-com bubble.
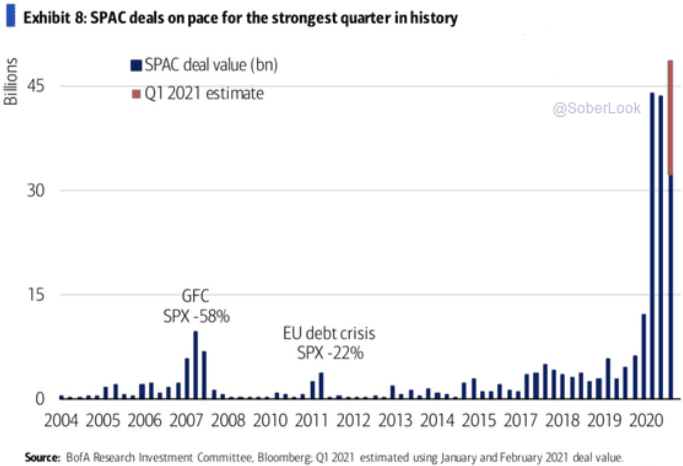
And aiming for another record in the first-quarter of 2021, SPAC offerings have gone absolutely parabolic.
Please see below:
Figure 9
If you analyze the right side of the chart, you can see that the blue bars (the Q1 estimate has red at the top) tower over every other period in history. More importantly though, notice how the 2007 spike in SPAC offerings preceded the Global Financial Crisis (a 58% drop in the S&P 500)? It’s no secret that SPACs raise cash at the height of investor speculation. As such, this coincides with peak retail and the belief that a new paradigm has emerged. However, as history has shown, the behavior is nothing new and the end result likely won’t be either.
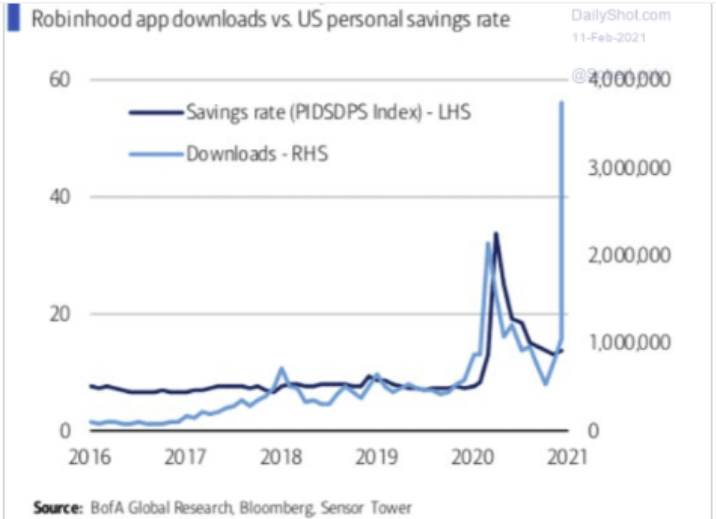
Supporting retail’s rapid influence, downloads of Robinhood’s investing app have surged. Housing the GameStop, AMC and silver short squeeze crowd, Robinhood’s army has ballooned in 2021.
Please see below:
Figure 10
But while the newbie traders cut their teeth in one of the most treacherous equity markets of all-time, their accounts remain funded by the U.S. taxpayer. Unlike ‘normal’ times, when people couldn’t trade on their phones all day, stimulus checks and unemployment benefits are flooding into equity markets.
However, the dynamic is a double-edged sword:
- With more time to trade than ever, the least sophisticated investors are further decoupling asset prices from fundamentals
- The longer that they stay unemployed, the more damage it inflicts on the U.S. economy
As evidence, theU.S. Department of Labor (DOL) revealed on Feb. 11 that initial jobless claims totaled 793,000 last week – well ahead of the consensus estimate of 760,000. Even more telling, Pandemic Unemployment Assistance claims rose by nearly 1.5 million week-over-week, while Pandemic Emergency claims rose by nearly 1.2 million (the blue boxes below).
Figure 11 - Source: U.S. Department of Labor (DOL)
Just as important, notice how ~18 million more people are collecting unemployment benefits now compared to the same period last year (the red boxes)? And emphasizing the magnitude of what’s happening, there are actually ~71,000 more people collecting unemployment benefits today than there were on Dec. 23 (the date of the release below).
Figure 12 - Source: U.S. Department of Labor (DOL)
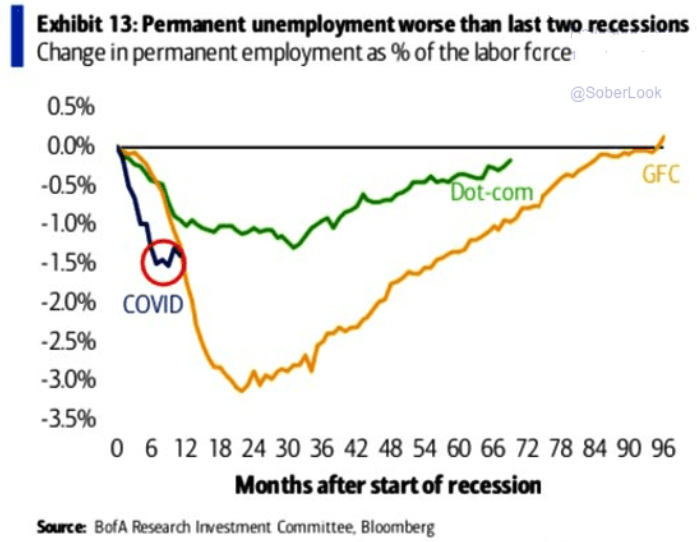
If that wasn’t enough, permanent job losses have skyrocketed.
Figure 13
To explain the chart above, the three lines track the change in permanent employment as a percentage of the labor force. If you analyze the blue line (COVID), you can see that permanent job losses hit the – 1.5% level more quickly than during the Global Financial Crisis (GFC). Moreover, after an initial snapback, the blue line has continued to move lower once again.
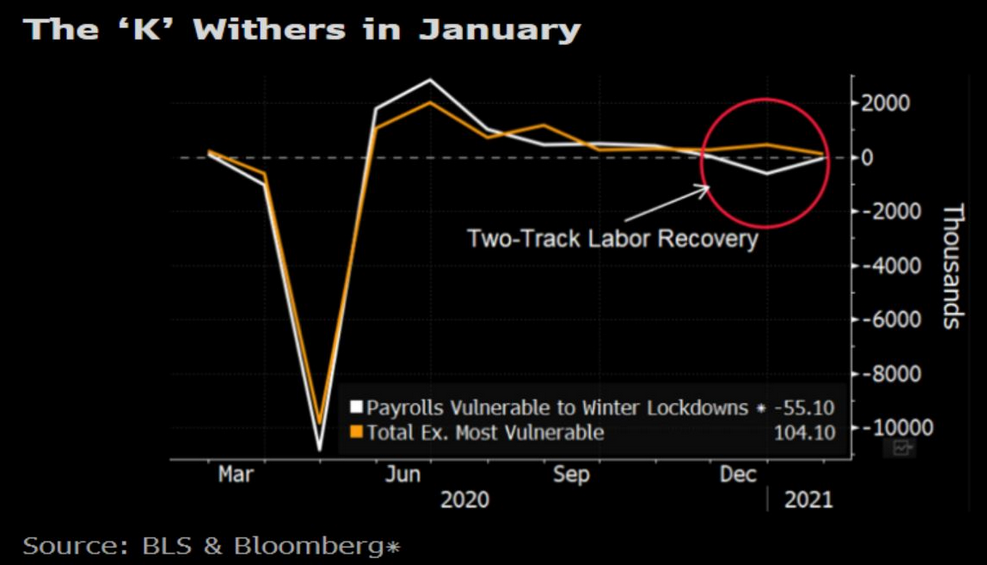
What’s more, the so-called ‘K-Shaped’ recovery is also beginning to crumble.
Initially, pandemic-induced job losses were confined to vulnerable industries like entertainment, travel and hospitality. However, if you analyze the chart below, you can see that white-collar workers are also starting to feel the pain.
Figure 14
To explain, the white line above depicts the workers most-affected by COVID-19. Conversely, the orange line tracks the least vulnerable. And after initially diverging in December, the orange line is moving lower once again.
In conclusion, the U.S. economic recovery remains tepid at best, but U.S. equities are unconscious to this reality. And as rampant speculation adds another wedge to the epic divergence, a Minsky Moment could be on the horizon. More importantly though, given the precious metals’ tendency to suffer from equity market stress, a drawdown of the former could inflict plenty of pain on the latter. However, once the storm passes, clear skies will guide the PMs once again.
Letters to the Editor
Q: I'm incredibly impressed with your work and am following it closely as well as applying it to my investments. Please take a look at the attached report. The challenge arrives when
I see a report like this from another gentleman whose work I respect and have witnessed the shortages and incredible premiums on physical silver. I'm hoping the spot price will move lower as you are predicting, and premiums and miners will follow. But the statistics
that Steve is providing are a concern. Please let us know your thoughts on this.
A: I’m very happy to see that you enjoy my work. The attached reports made several points, but the key one (in my opinion) could be summarized in the following way:
Big purchases of SLV mean that that the ETF has to take the physical silver bars from COMEX. Since there is a huge controversy regarding whether JP Morgan really holds all the silver it claims in its inventories as the custodian for the SLV ETF, at some point the market could demand the real silver to be delivered and this demand could not be met. At that point the silver price would likely explode (similarly to what happened to palladium in the last 90s and in 2000, but to an even greater extent).
IF there is a massive manipulation in silver, then physical market taking over the paper silver market (futures and other derivatives that are essentially not real, tangible silver bars or coins) could mean the end of it.
This is a big IF, because ever since this theory began circulating on the internet over 20 years ago, the silver price increased over 10-fold, which would have not likely have happened if the price was truly manipulated. Then again, silver might be manipulated after all, and the above-mentioned rally might have taken place due to some reasons the manipulators know.
There is a one HUGE point that I would like to make that people seem to miss with regard to this situation and the above-mentioned possibility of the silver market being manipulated.
Let’s ASSUME that – for many years – silver has been manipulated by huge financial institutions that have lots to lose on this – including jail time.
The above means three things:
- These “manipulators” are extremely well informed about what happens in the silver market (supply, supply’s availability) and how it’s all connected with other markets, “third parties”, legislative details and so on. They likely have this kind of insight with regard to more than just the U.S. legal system. After all, who said that silver has to be traded in the U.S. only, and that all positions have to be reported? Taking a global perspective allows one to realize just how many things individual investors might NOT know about all this, but that the “manipulators” would already have long-term expertise in.
- These “manipulators” are highly motivated to get out of this situation without facing consequences. These individuals have high personal motivations in addition to having professional ones. Nobody wants to serve prison time, right? They have everything to lose, so they will definitely use point #1 to make sure that they come out ahead or at least without taking the blame.
- These “manipulators” could be very unethical psycho/sociopaths ready to do anything to achieve their goals without having a second thought.
IF you were in this position, and you see that the physical market might run you over – what do you do (realistically)? You utilize all your insight to get out of it and try to avoid the blame.
How can they do this? By triggering another decline in the silver prices and then buying the physical silver as it declines or when its kept at low prices for longer.
When prices drop far enough, individual investors will be selling – at least many of them will, thus allowing the previous manipulators to obtain physical silver at relatively good prices.
And what about all the futures contracts? “Oh, that was just for hedging – we have some positions offsetting those in a different country” – and the exchange might cancel the contracts in one way or another. Or perhaps a special investment vehicle would be created to hold all these “toxic” contracts. This company – the special investment vehicle – would take all the blame for every wrongdoing on the silver market ever conducted. Too bad the only person in the company responsible for anything would “get suicided” shortly after it’s all discovered.
The bottom line is this: IF the silver market is being manipulated by powerful financial entities, I would expect to see a huge decline before seeing silver skyrocketing. Which is exactly what I’m expecting to see even IF the above theory is not real.
And given that the markets (at least in the “Western” world) are entering the Kondratiev Winter, the supposed manipulators would have the powerful cycle on their side, which puts them in a very comfortable position. They could just sit and relax, waiting for the silver market to collapse on its own, perhaps helping it to only a limited extent in order to limit the attention they would be getting or something that they could easily get away with.
There is a silver lining (pun indented) to this story, though. While silver is not likely to skyrocket shortly, it could be the case that after the upcoming decline (which would be likely to end this year), the powers that be already manage to get enough physical silver to cover the contracts that they would not be able to sell. This means that when the next upswing starts, they might not take the short positions on anymore. And that’s where the real silver fireworks would start.
My approach is as it was previously – make the key purchases close to the very bottom, but hold some physical precious metals as insurance at all times, just in case I’m wrong about all this and the precious metals market soars overnight due to some epic black-swan event.
Summary
To summarize, the PMs short-term downswing has likely just begun, as miners broke below the neck level of their almost-yearly head-and-shoulders formation. We saw a small invalidation, but we don’t trust its bullish implications – we just saw something similar that failed to ignite a lasting rally and the USD’s decline seems to be a normal, post-breakout pullback.
In addition, because we’re likely entering the “winter” part of the Kondratiev cycle, the outlook for the precious metals’ sector remains particularly bearishduring the very first part of the cycle, when cash is king.
Silver’s strength seems bullish at first sight, but taking a closer look at this move, and comparing it with previous cases (when silver got so much attention) and with miners’ weakness, provides us with bearish implications for the medium term.
The confirmed breakout in the USD Index is yet another confirmation of the bearish outlook for the precious metals market.
Naturally, everyone's trading is their responsibility. But in our opinion, if there ever was a time to either enter a short position in the miners or increase its size if it was not already sizable, it's now. We made money on the March decline, and on the March rebound, with another massive slide already underway.
After the sell-off (that takes gold to about $1,500), we expect the precious metals to rally significantly. The final part of the decline might take as little as 1-5 weeks, so it's important to stay alert to any changes.
Most importantly, please stay healthy and safe. We made a lot of money on the March decline and the subsequent rebound (its initial part) price moves (and we'll likely earn much more in the following weeks and months), but you have to be healthy to enjoy the results.
As always, we'll keep you - our subscribers - informed.
To summarize:
Trading capital (supplementary part of the portfolio; our opinion): Full speculative short positions (300% of the full position) in mining stocks is justified from the risk to reward point of view with the following binding exit profit-take price levels:
Senior mining stocks (price levels for the GDX ETF): binding profit-take exit price: $32.02; stop-loss: none (the volatility is too big to justify a SL order in case of this particular trade); binding profit-take level for the DUST ETF: $23.89; stop-loss for the DUST ETF: none (the volatility is too big to justify a SL order in case of this particular trade)
Junior mining stocks (price levels for the GDXJ ETF): binding profit-take exit price: $42.72; stop-loss: none (the volatility is too big to justify a SL order in case of this particular trade); binding profit-take level for the JDST ETF: $14.19; stop-loss for the JDST ETF: none (the volatility is too big to justify a SL order in case of this particular trade)
For-your-information targets (our opinion; we continue to think that mining stocks are the preferred way of taking advantage of the upcoming price move, but if for whatever reason one wants / has to use silver or gold for this trade, we are providing the details anyway. In our view, silver has greater potential than gold does):
Silver futures downside profit-take exit price: unclear at this time - initially, it might be a good idea to exit, when gold moves to $1,703.
Gold futures downside profit-take exit price: $1,703
Long-term capital (core part of the portfolio; our opinion): No positions (in other words: cash
Insurance capital (core part of the portfolio; our opinion): Full position
Whether you already subscribed or not, we encourage you to find out how to make the most of our alerts and read our replies to the most common alert-and-gold-trading-related-questions.
Please note that we describe the situation for the day that the alert is posted in the trading section. In other words, if we are writing about a speculative position, it means that it is up-to-date on the day it was posted. We are also featuring the initial target prices to decide whether keeping a position on a given day is in tune with your approach (some moves are too small for medium-term traders, and some might appear too big for day-traders).
Additionally, you might want to read why our stop-loss orders are usually relatively far from the current price.
Please note that a full position doesn't mean using all of the capital for a given trade. You will find details on our thoughts on gold portfolio structuring in the Key Insights section on our website.
As a reminder - "initial target price" means exactly that - an "initial" one. It's not a price level at which we suggest closing positions. If this becomes the case (like it did in the previous trade), we will refer to these levels as levels of exit orders (exactly as we've done previously). Stop-loss levels, however, are naturally not "initial", but something that, in our opinion, might be entered as an order.
Since it is impossible to synchronize target prices and stop-loss levels for all the ETFs and ETNs with the main markets that we provide these levels for (gold, silver and mining stocks - the GDX ETF), the stop-loss levels and target prices for other ETNs and ETF (among other: UGL, GLL, AGQ, ZSL, NUGT, DUST, JNUG, JDST) are provided as supplementary, and not as "final". This means that if a stop-loss or a target level is reached for any of the "additional instruments" (GLL for instance), but not for the "main instrument" (gold in this case), we will view positions in both gold and GLL as still open and the stop-loss for GLL would have to be moved lower. On the other hand, if gold moves to a stop-loss level but GLL doesn't, then we will view both positions (in gold and GLL) as closed. In other words, since it's not possible to be 100% certain that each related instrument moves to a given level when the underlying instrument does, we can't provide levels that would be binding. The levels that we do provide are our best estimate of the levels that will correspond to the levels in the underlying assets, but it will be the underlying assets that one will need to focus on regarding the signs pointing to closing a given position or keeping it open. We might adjust the levels in the "additional instruments" without adjusting the levels in the "main instruments", which will simply mean that we have improved our estimation of these levels, not that we changed our outlook on the markets. We are already working on a tool that would update these levels daily for the most popular ETFs, ETNs and individual mining stocks.
Our preferred ways to invest in and to trade gold along with the reasoning can be found in the how to buy gold section. Furthermore, our preferred ETFs and ETNs can be found in our Gold & Silver ETF Ranking.
As a reminder, Gold & Silver Trading Alerts are posted before or on each trading day (we usually post them before the opening bell, but we don't promise doing that each day). If there's anything urgent, we will send you an additional small alert before posting the main one.
Thank you.
Przemyslaw Radomski, CFAFounder, Editor-in-chief


