Briefly: In our opinion, full (150% of the regular full position) speculative short positions in gold, silver and mining stocks are justified from the risk/reward perspective at the moment of publishing this alert.
It’s no secret that weekly moves and signals based on them are more important than the daily ones. After all, if we saw one sign for the next day or two, but knew that the week was going to end with the price moving in the opposite direction, we would know that following the daily move would be very risky. Instead, we would aim to take advantage of the initial move to take a position for the upcoming big move… Which brings us to the current situation – the week is over and we have quite a few signals of significant importance. Let’s take advantage of them and jump right into charts (chart courtesy of http://stockcharts.com).
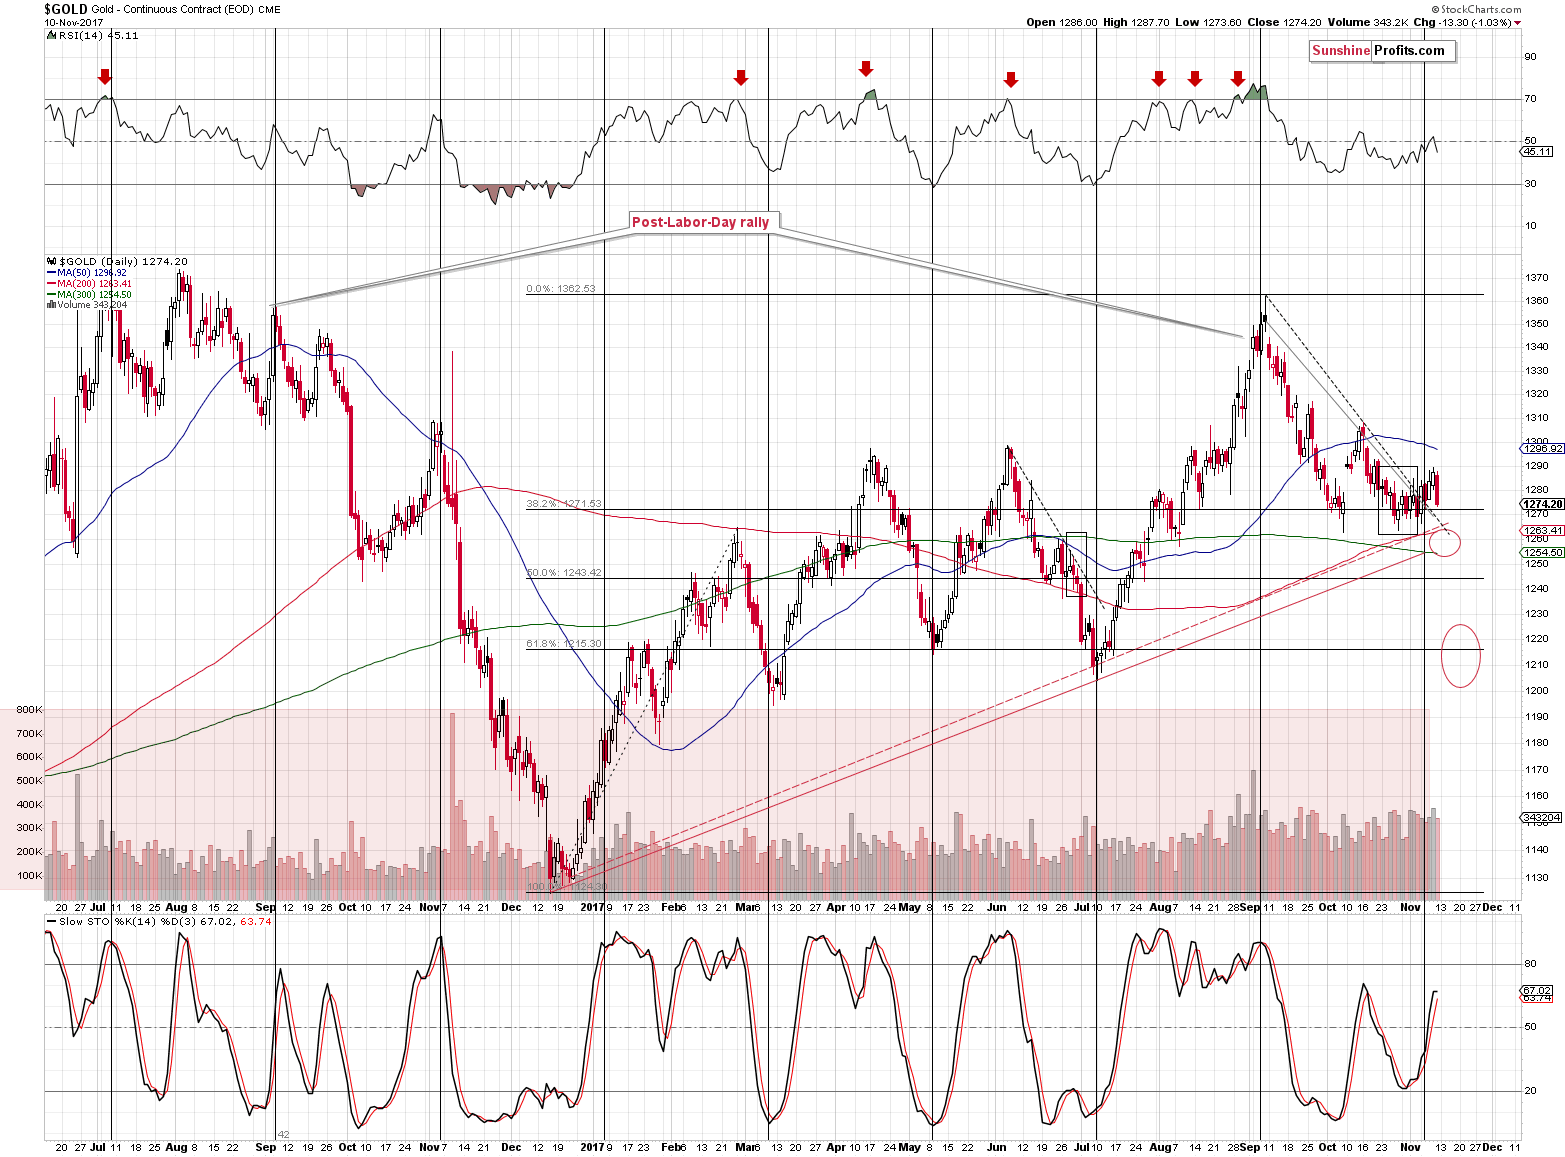
Gold was up last week, but only $5, which is next to nothing. Without help from other factors (like the USD Index, which was and still is likely to rally, but that hasn’t done so yet) the cyclical turning point in gold worked anyway, but the follow-up rally was very small.
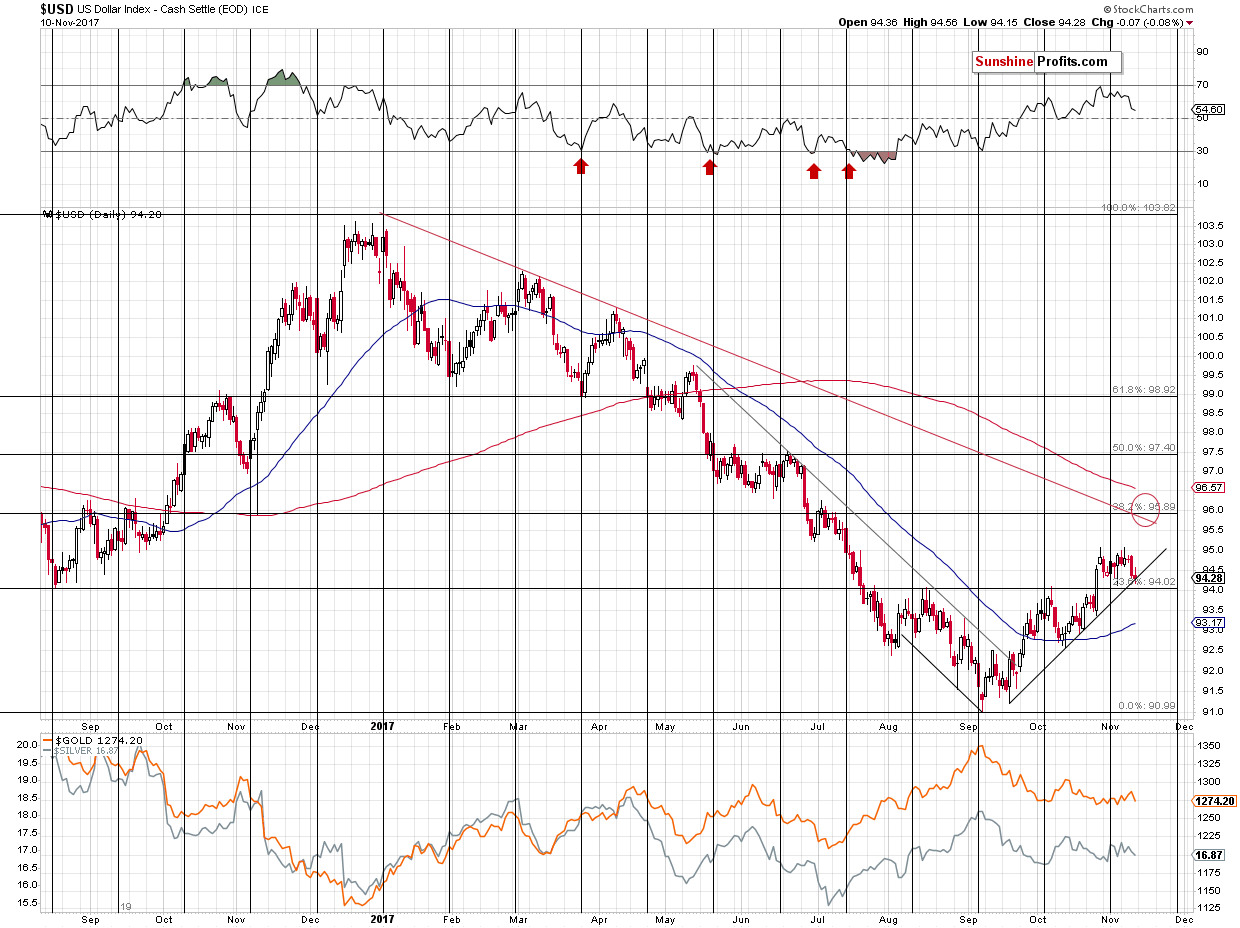
The insignificance of gold’s rally is rather striking given the USD’s move last week. The last time when we saw a similar move in the USD was in early October (weekly decline by 0.70, while it declined 0.58 last week), gold rallied about $30. While the moves in the USD were quite similar, we can’t say the same thing about gold’s reaction, which was six times smaller this time.
Naturally, this major decline in the willingness to follow the USD’s bullish (for gold that is) signs is a very bearish indication for the following weeks.
While we’re at the USD chart, please note that it moved to the rising short-term support line without breaking below it. Consequently, it’s likely to bounce and continue its rally. The 95.89 still serves as the most likely short-term target.
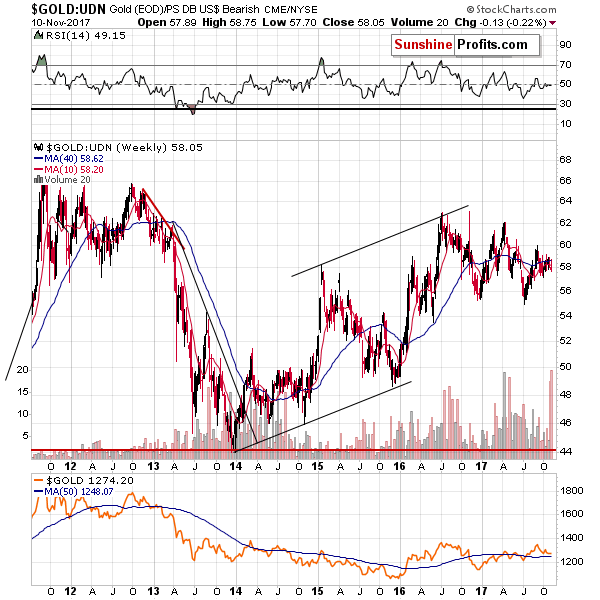
Moving back to the gold market, something important is happening in the gold to UDN ETF ratio. This ratio means that gold’s USD price that we usually analyze is multiplied by various currency exchange rates (i.a. the EUR/USD) and then these prices are averaged with weights just as in the USD Index.
The thing that’s happening on the above chart is the spike in volume (ratio of volumes). While it may sound esoteric and odd that we’re analyzing the ratio between the volume of gold and one of some ETF, please note that it has significant predictive value.
The 2016 and 2017 tops (at least the first major one) were indicated by a huge spike in the volume. Yes, there were also cases when the ratio spiked during a bottom, but that only serves as a confirmation of its usefulness as a reversal detector. The previous move in the gold:UDN ratio was up, so the implications are bearish – also for gold in terms of the USD.
At this point you may ask about silver’s non-USD price.
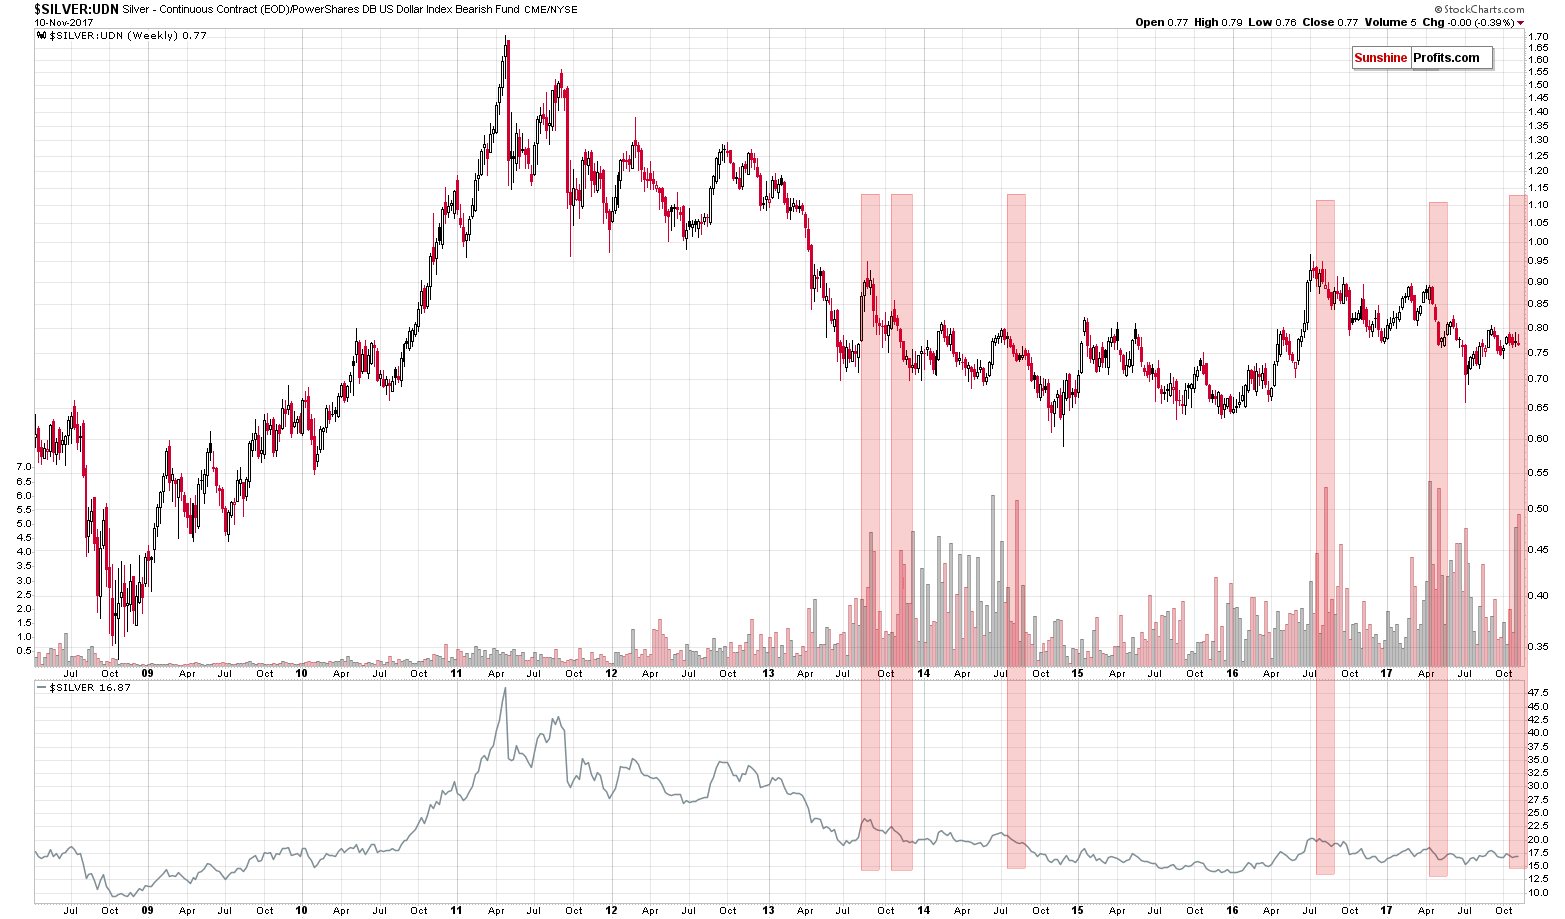
Well, it’s suggesting the same thing based on the same technique, so it seems that the above analysis of gold:UDN ratio is confirmed. The huge volume readings preceded major declines (we marked those situations with red rectangles) and since we just saw this signal once again, the implications are bearish. On a side note, when we previously commented on the ratio of volumes between silver and UDN, we called it silver’s hidden signal as that’s something that many investors and professional analysts are not aware of.
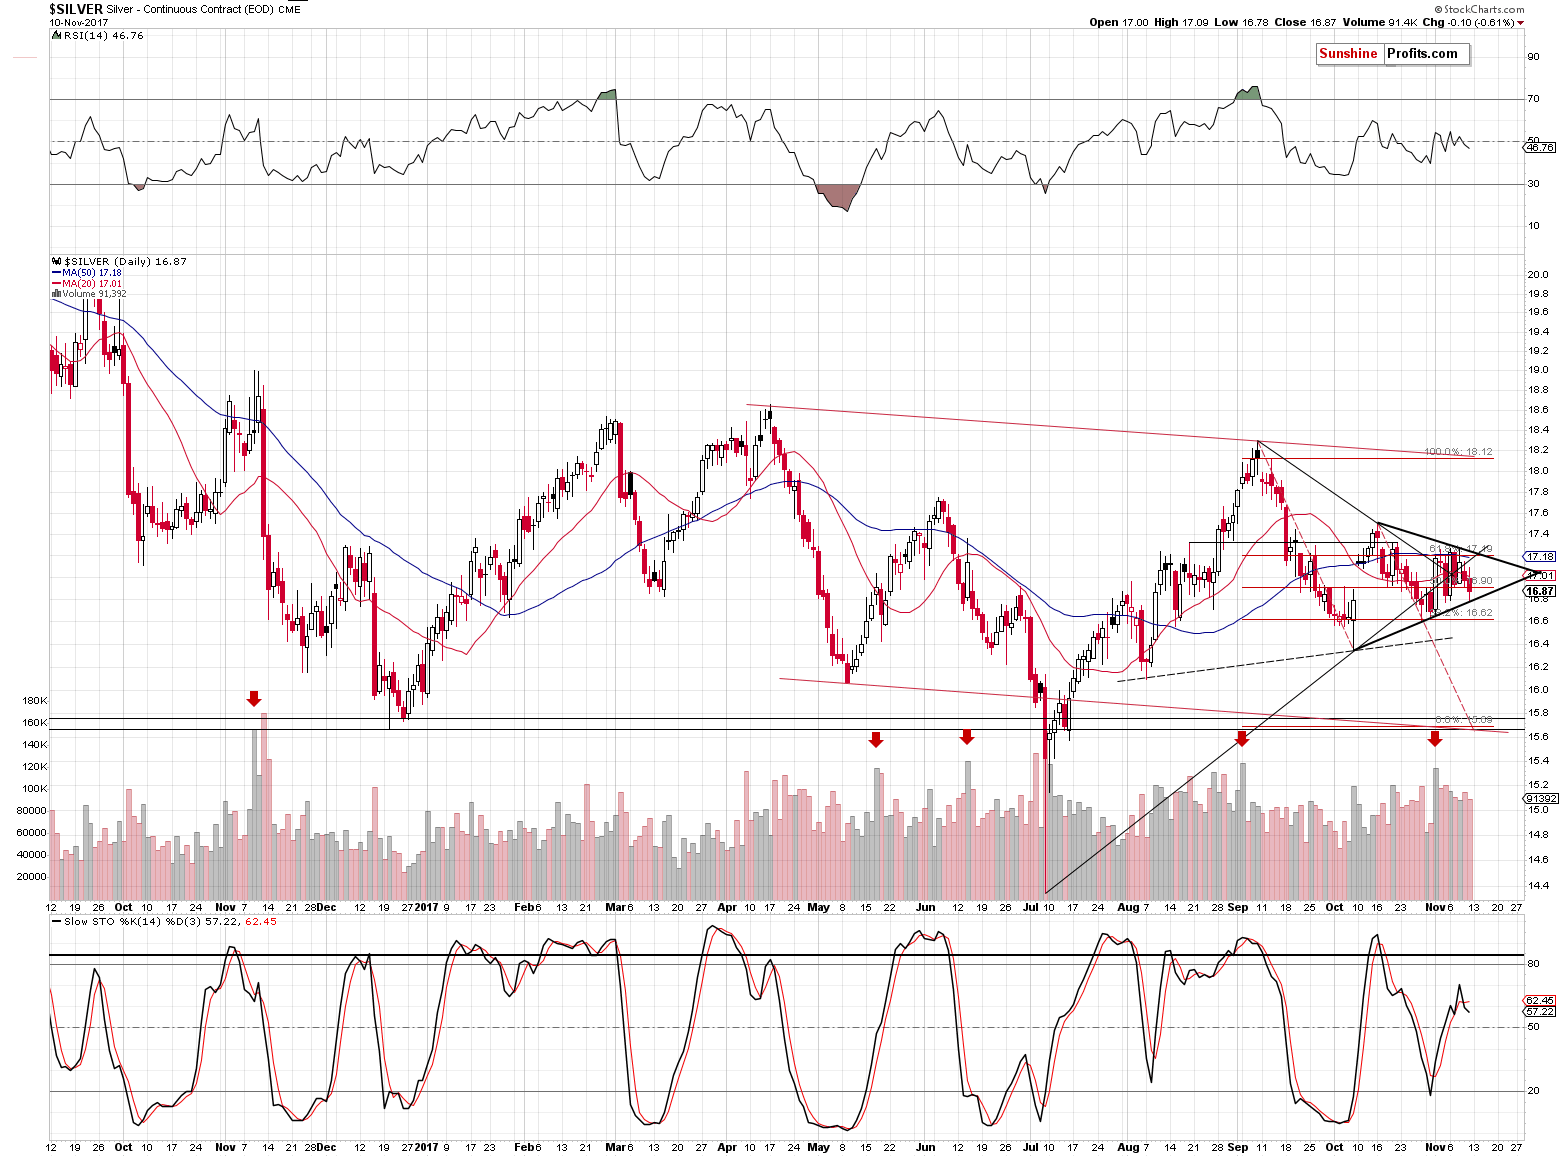
Let’s stay with silver for a while. In Friday’s alert, we wrote the following:
Silver and mining stocks declined. The Stochastic indicator based on the price of the white metal flashed a sell signal and while mining stocks didn’t fully invalidate the move above the rising support/resistance lines, their underperformance relative to gold is a strong bearish sign anyway.
Speaking of silver, please note that it seems to have reversed according to the apex technique that we described about a month ago:
Let’s move back to the HUI Index chart once again as it features a new technique that we’ve been validating for the precious metals market and it finally seems that it’s justified to include it in our set of tools. The technique is the triangle apex reversal. The technique is quite straightforward and even though it may appear somewhat random (it mixes both price and time), it works surprisingly well.
Moving to the point, the triangles are usually drawn in order to create support and resistance levels, check whether a breakout or breakdown is more likely and estimate the likely size of the move that follows the breakout or breakdown. However, if one continues to draw the triangle borders until they cross, they will get a quite precise time target. You can see the above in action on the HUI Index chart. The triangle’s apex is a bit below 185, in early September. The former is irrelevant, but the time wasn’t. The HUI Index indeed topped in early September.
We noticed that the more visible the triangle is and the greater number of extremes confirm its existence, the more reliable the prediction for the turning point becomes.
In silver’s case, the technique pointed to a reversal on November 6th and that was indeed when we saw the high in terms of the daily closing prices.
There are two reasons for quoting the above:
- The sell signal from the Stochastic indicator is even clearer based on Friday’s move lower, so the implications are bearish. In fact, there were only three other cases visible on the above chart when the Stochastic flashed visible sell signals (moving below its red signal line) while not being above the 80 level, but below it. They all were followed by very sharp declines: the late September 2016 signal was followed by a sharp slide in early October, the mid-November 2016 signal and declines are clearly visible and the same goes for the late-June 2017 decline that temporarily took silver below $15. Naturally, the implications are bearish.
- We created another triangle on the above chart based on the recent extremes (marked with thick, black lines) and its apex points to a reversal in early December – that’s something definitely worth keeping in mind.
Having said the above, let’s discuss the situation in mining stocks.
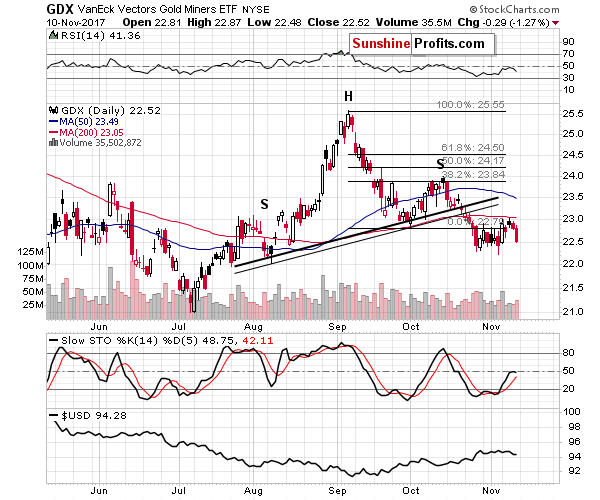
In short, they declined on Friday and they’ve done so on volume that was higher than what we saw in the previous days. The implications are quite straightforward and bearish. The breakdown below the September low seems to have been verified.
On Friday, we wrote the following:
Yesterday’s move lower in the general stock market could be partially responsible for it [miners’ decline despite gold’s rally], but given the size of the USD’s daily decline miners should still have moved higher but they didn’t.
It seems that we were correct not to attribute the miners’ decline to the main stock indices’ weakness – Friday’s decline took place without the general stock markets’ help, which confirms that there was most likely something else that was responsible for the miners’ decline on Thursday – the unwillingness of traders to continue to bet on higher miners’ prices, which was a negative short-term sign.
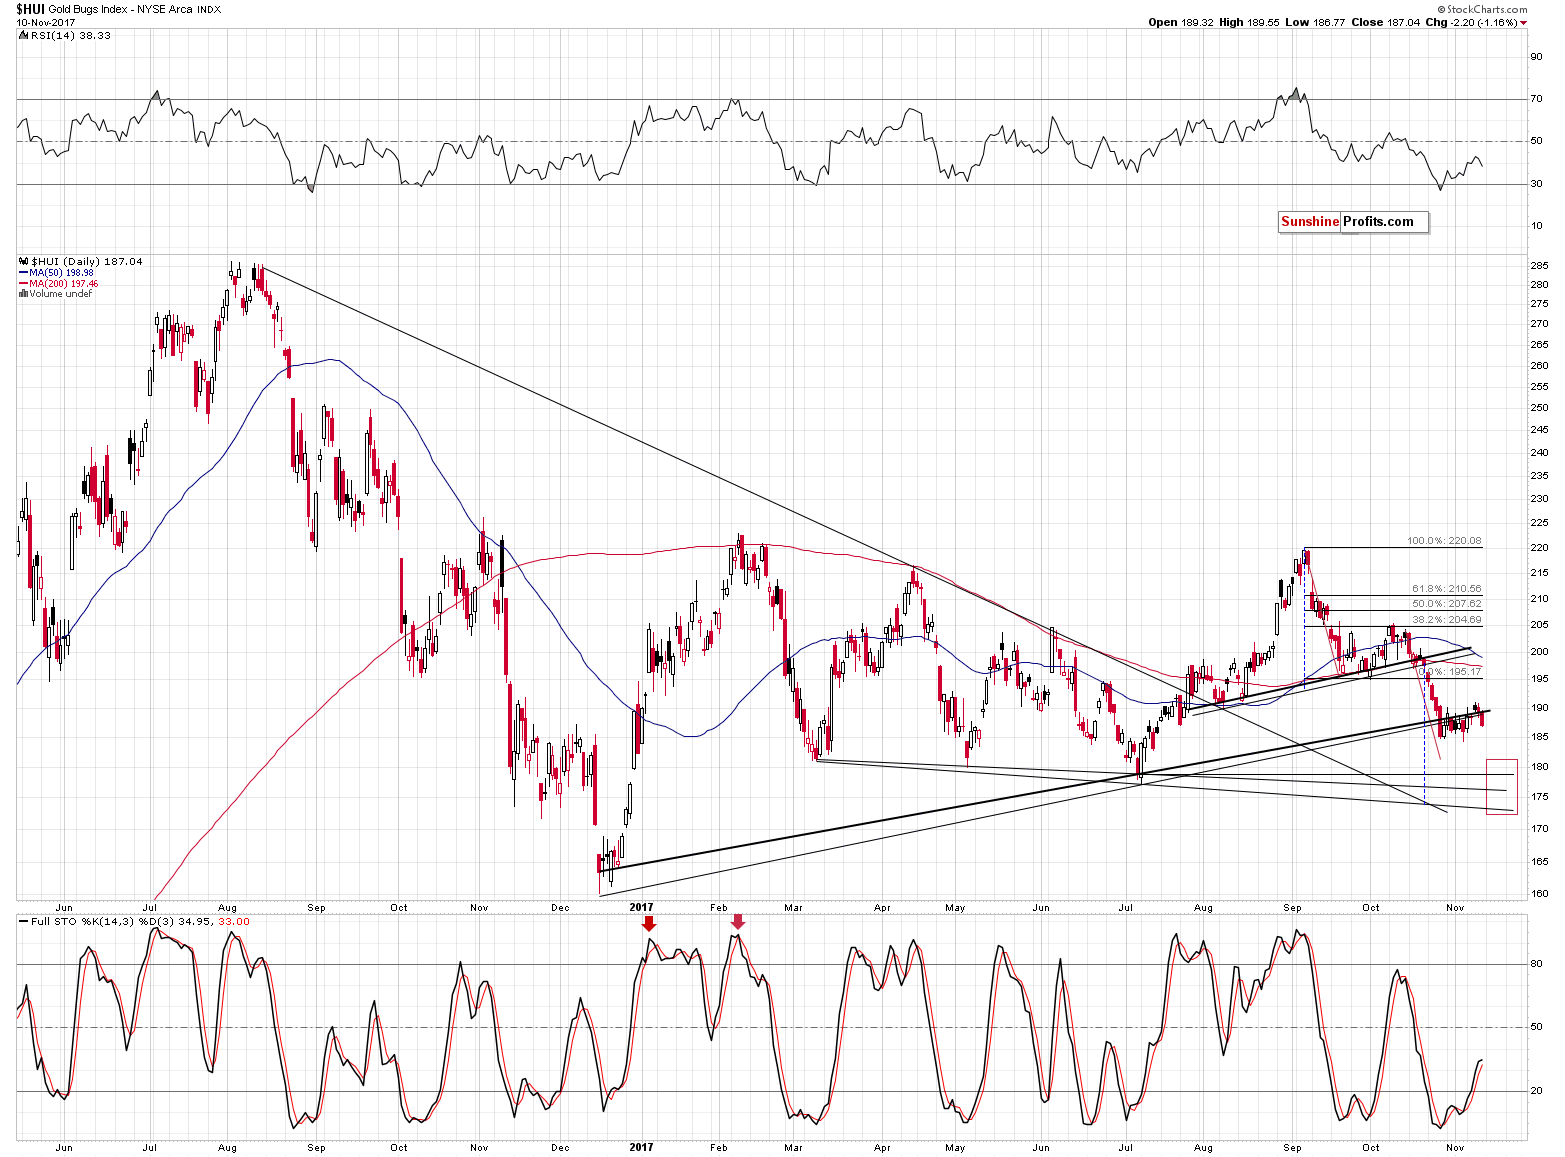
The situation in the HUI Index is also bearish. In Thursday’s alert, we wrote the following:
Gold stocks finally moved and closed the session above the rising support/resistance lines. The breakout is not confirmed, so little changed – already saw a breakout above these lines several days ago. Just as the late-October daily breakout was invalidated, yesterday’s one could be invalidated as well.
The breakout was never confirmed and it was invalidated on Friday when gold miners declined decisively below the rising support/resistance lines. The implications are naturally bearish, especially that the weekly closing price is more meaningful than the daily closes.
On a side note, please note that we recently replied to a question about confirmations and why we wait for three consecutive closes instead of acting on one or two of them. Quoting our reply once again:
Regarding the 3-day confirmation rule - we haven’t published an essay on this particular technique, but the explanation is that this is an experience-based adjustment to the classic 2-day confirmation technique. The general idea is that while 1 session could be manipulated or be highly affected by a more or less random (i.a. geopolitical) event, it’s highly unlikely that 2 subsequent sessions would be manipulated/affected in the same way. While in the former case, a breakout / breakdown could be accidental, if we saw 2 closes above/below a certain level, one could view the move as “real” and “confirmed”. That’s the theory and it may very well work in this way on some markets, but we noticed that even such 2-day confirmations are quite often invalidated and thus we added an additional day to the above requirement. Introducing it increased the accuracy of using breakouts and breakdowns as trading tools.
What happened in the HUI Index serves as an excellent confirmation of the way that we use confirmations – the breakout was invalidated after two daily closes above the support/resistance line. If one had viewed it as confirmed, they could have made incorrect decisions based on this development.
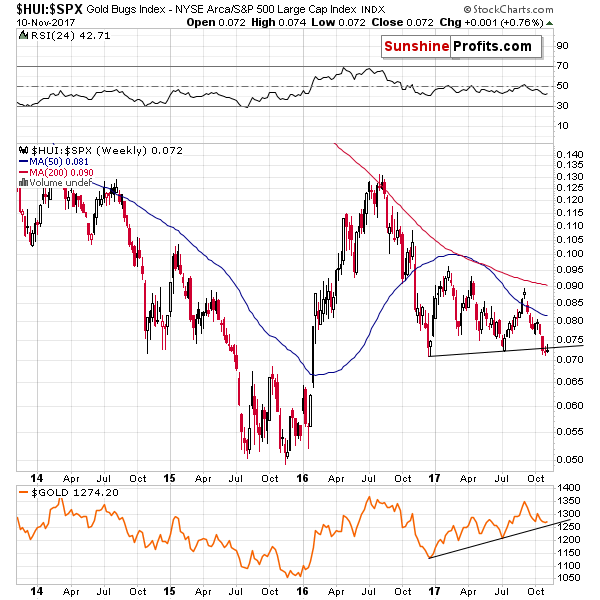
If we compare the golds stocks’ performance to the one of the general stock market, we’ll also see that the breakdown and its bearish implications remain in place.
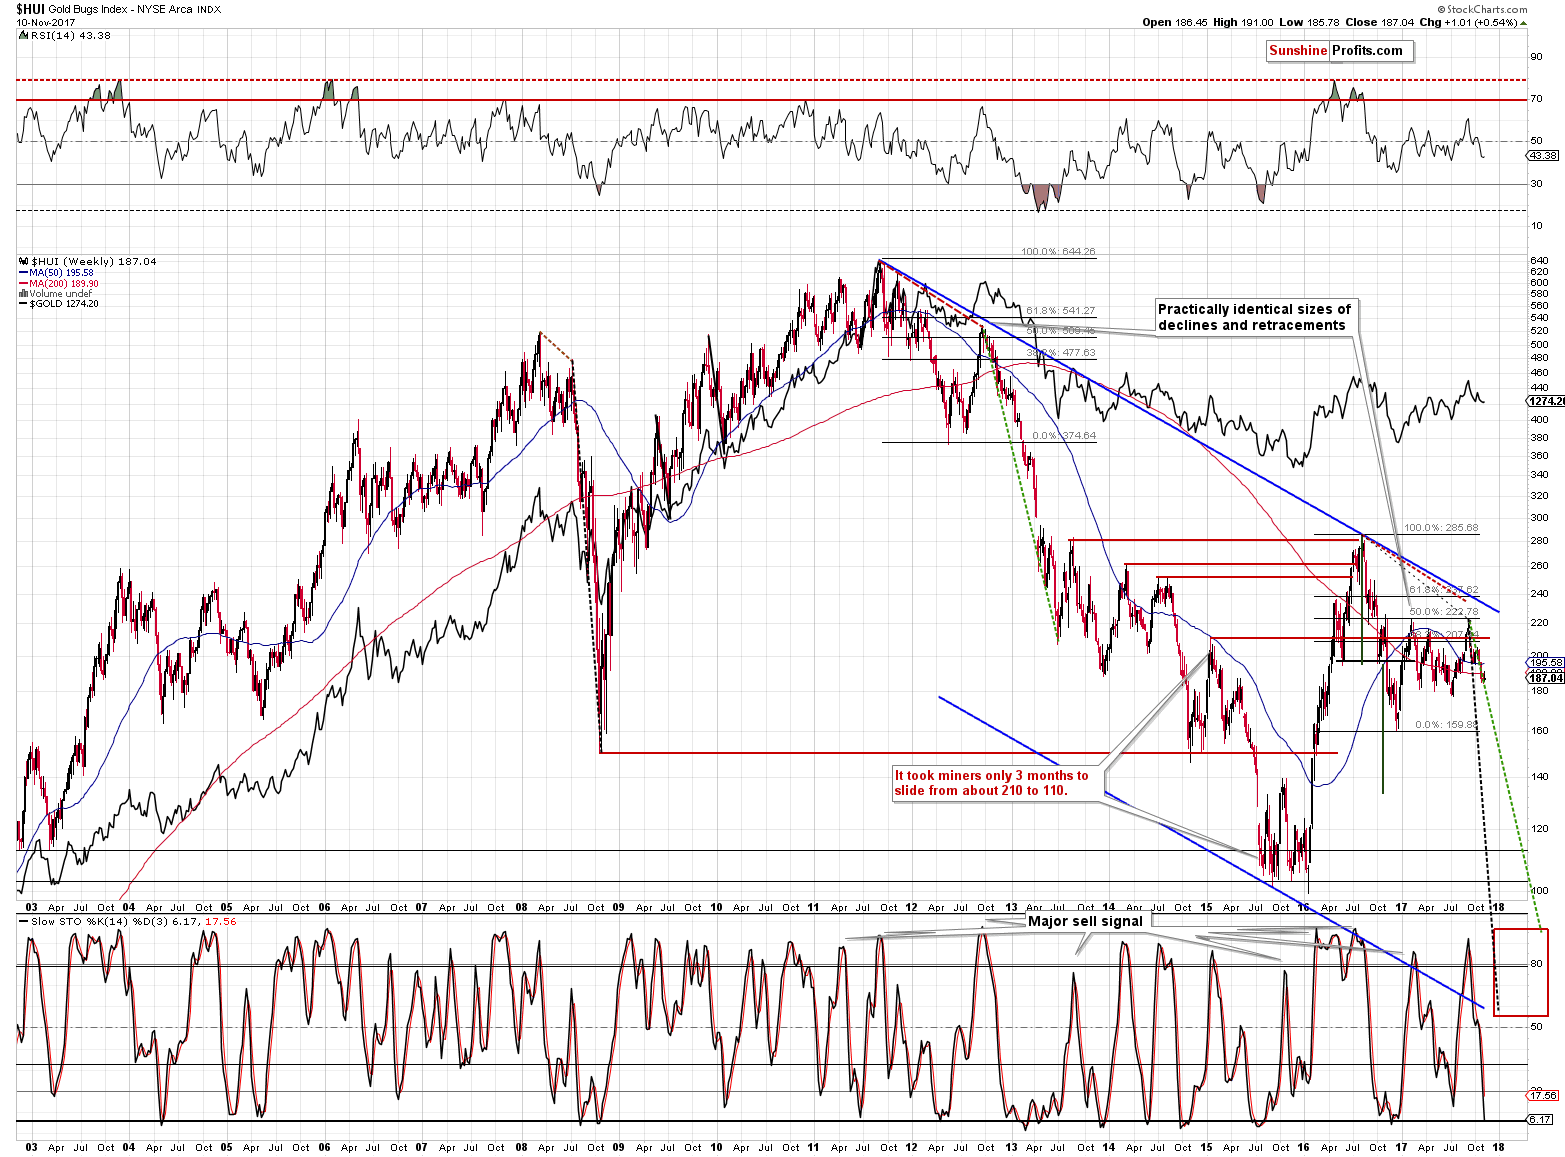
The analysis of the very-long-term HUI Index chart continues to suggest that a huge slide is likely to be seen in the coming months, but also that we are quite likely to see an interim corrective upswing (just like the one that we saw at the end of 2012). As we explained previously, the latter could be caused by a bigger corrective decline in the USD Index that would precede a major rally in the latter.
However, the likely short-term direction is still up for the USD and down for the precious metals market.
Summing up, even though gold’s move higher on Wednesday and Thursday might have appeared bullish and encouraging, the bearish outlook is alive and well. The situation in the USD Index continues to support a short-term rally to approximately 96 and the precious metals’ and mining stocks’ Friday’s decline took place even without the USD’s help – both developments point to lower PM prices in the near future.
The upcoming bottom is likely to be followed by a tradable rally, so we’re monitoring the market for confirmations and reliable signs of strength.
To be clear, the medium-term outlook remains bearish, especially that the analogy to the 2012-2013 decline remains in place and the previously discussed long-term signals remain in place: gold’s huge monthly volume, the analogy in the HUI Index, the analogy between the two most recent series of interest rate hikes, and the RSI signal from gold priced in the Japanese yen. However, it seems to be a good idea to take advantage of the upcoming short-term correction, should we get bullish confirmations from metals or miners.
As always, we will keep you – our subscribers – informed.
To summarize:
Trading capital (supplementary part of the portfolio; our opinion): Short positions (150% of the full position) in gold, silver and mining stocks are justified from the risk/reward perspective with the following stop-loss orders and exit price levels / profit-take orders:
- Gold: exit price: $1,218; stop-loss: $1,366; exit price for the DGLD ETN: $51.98; stop-loss for the DGLD ETN $38.74
- Silver: exit price: $15.82; stop-loss: $19.22; exit price for the DSLV ETN: $28.88; stop-loss for the DSLV ETN $17.93
- Mining stocks (price levels for the GDX ETF): exit price: $21.23; stop-loss: $26.34; exit price for the DUST ETF: $29.97; stop-loss for the DUST ETF $21.37
In case one wants to bet on junior mining stocks' prices (we do not suggest doing so – we think senior mining stocks are more predictable in the case of short-term trades – if one wants to do it anyway, we provide the details), here are the stop-loss details and exit prices:
- GDXJ ETF: exit price: $30.28; stop-loss: $45.31
- JDST ETF: exit price: $66.27; stop-loss: $43.12
Long-term capital (core part of the portfolio; our opinion): No positions (in other words: cash)
Insurance capital (core part of the portfolio; our opinion): Full position
Important Details for New Subscribers
Whether you already subscribed or not, we encourage you to find out how to make the most of our alerts and read our replies to the most common alert-and-gold-trading-related-questions.
Please note that the in the trading section we describe the situation for the day that the alert is posted. In other words, it we are writing about a speculative position, it means that it is up-to-date on the day it was posted. We are also featuring the initial target prices, so that you can decide whether keeping a position on a given day is something that is in tune with your approach (some moves are too small for medium-term traders and some might appear too big for day-traders).
Plus, you might want to read why our stop-loss orders are usually relatively far from the current price.
Please note that a full position doesn’t mean using all of the capital for a given trade. You will find details on our thoughts on gold portfolio structuring in the Key Insights section on our website.
As a reminder – “initial target price” means exactly that – an “initial” one, it’s not a price level at which we suggest closing positions. If this becomes the case (like it did in the previous trade) we will refer to these levels as levels of exit orders (exactly as we’ve done previously). Stop-loss levels, however, are naturally not “initial”, but something that, in our opinion, might be entered as an order.
Since it is impossible to synchronize target prices and stop-loss levels for all the ETFs and ETNs with the main markets that we provide these levels for (gold, silver and mining stocks – the GDX ETF), the stop-loss levels and target prices for other ETNs and ETF (among other: UGLD, DGLD, USLV, DSLV, NUGT, DUST, JNUG, JDST) are provided as supplementary, and not as “final”. This means that if a stop-loss or a target level is reached for any of the “additional instruments” (DGLD for instance), but not for the “main instrument” (gold in this case), we will view positions in both gold and DGLD as still open and the stop-loss for DGLD would have to be moved lower. On the other hand, if gold moves to a stop-loss level but DGLD doesn’t, then we will view both positions (in gold and DGLD) as closed. In other words, since it’s not possible to be 100% certain that each related instrument moves to a given level when the underlying instrument does, we can’t provide levels that would be binding. The levels that we do provide are our best estimate of the levels that will correspond to the levels in the underlying assets, but it will be the underlying assets that one will need to focus on regarding the signs pointing to closing a given position or keeping it open. We might adjust the levels in the “additional instruments” without adjusting the levels in the “main instruments”, which will simply mean that we have improved our estimation of these levels, not that we changed our outlook on the markets. We are already working on a tool that would update these levels on a daily basis for the most popular ETFs, ETNs and individual mining stocks.
Our preferred ways to invest in and to trade gold along with the reasoning can be found in the how to buy gold section. Additionally, our preferred ETFs and ETNs can be found in our Gold & Silver ETF Ranking.
As a reminder, Gold & Silver Trading Alerts are posted before or on each trading day (we usually post them before the opening bell, but we don't promise doing that each day). If there's anything urgent, we will send you an additional small alert before posting the main one.
=====
Latest Free Trading Alerts:
Last week, the World Gold Council published a new edition of its quarterly report on gold demand. What does Gold Demand Trends Q2 2017 say about the demand for gold in the third quarter of 2017?
S&P 500 index lost 0.1% on Friday, as investors hesitated following recent fluctuations. Is this a topping pattern before some medium-term downward reversal or just pause before another leg up?
Short-Term Uncertainty Following Recent Rally, Will Stocks Continue Higher?
=====
Hand-picked precious-metals-related links:
PRECIOUS-Gold prices trade in range, but U.S. rate hike view weighs
Mysterious Gold Trades of 4 Million Ounces Spur Price Plunge
BNP Paribas Sees Mid-2018 Rally In Gold, Then Price Retreat
‘Neutral’ On Gold In 2018 — UBS Strategist
Freeport Indonesia shuts main supply route to mine after shooting
Osisko's hybrid model could be the future of gold streaming
=====
In other news:
World stocks lower on U.S. tax reform uncertainty, May's woes rattle sterling
These Unruly GOP Tax Factions Will Put Senate's Plan in Question
The U.S. Yield Curve Is Flattening and Here's Why It Matters
Pound Slides as Pressure on May's Leadership Adds to Brexit Woes
Euro Economy Is Heading Towards a Golden Period
OPEC Head Says Oil Cuts ‘Only Viable Option’ to Stabilize Market
Bitcoin Tumble Erases as Much as $38 Billion While Rivals Gain
$25 billion in 24 hours: World's biggest shopping day sets new record
=====
Thank you.
Sincerely,
Przemyslaw Radomski, CFA
Founder, Editor-in-chief, Gold & Silver Fund Manager
Gold & Silver Trading Alerts
Forex Trading Alerts
Oil Investment Updates
Oil Trading Alerts


