Briefly: in our opinion, full (300% of the regular position size) speculative short positions in junior mining stocks are justified from the risk/reward point of view at the moment of publishing this Alert.
What a near-perfect rhyme in history! It didn’t take long for the panic-based rally to burn itself out – just like in 2008.
The follow-up action is also very similar. This is great because it further confirms multiple points that I’ve been making in the previous days and weeks, in particular those about the link between now and the previous crises in 2008 and 2020.
Let’s start with the remarkable self-similarity in terms of hourly candlesticks in gold stocks. Here’s how I described the situation yesterday:
Still, do you know the saying that time is more important than price – when the time is up, the price will reverse?
The “weekly move” analogy was surprisingly accurate – gold’s final pre-slide rally took about a week. And that’s how much time the current rally took. This means that it’s likely to end today or shortly, anyway.
In fact, we see it even more clearly in the case of the HUI Index and its hourly chart.
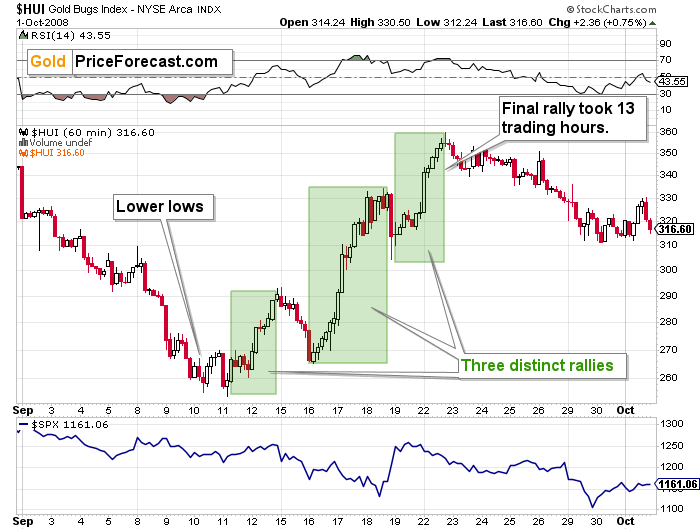
Here’s what the HUI Index (a proxy for gold stocks) did back in 2008 before sliding.
The decline ended with lower lows, and there were three distinct rallies. The final one took about 13 trading hours.
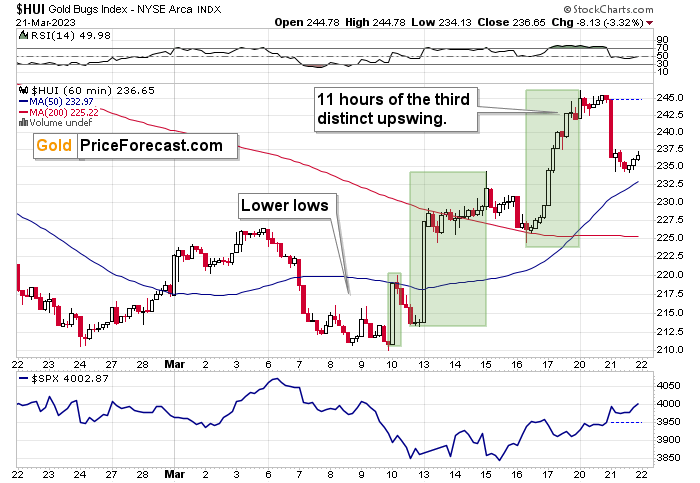
Here’s the current situation.
The decline ended with lower lows, and there were three distinct rallies. The final one took about 11 trading hours (…).
That’s definitely “close enough” for the top to be in at this very moment. However, let’s keep in mind that history might not repeat itself to the letter but rather rhyme, so it could be the case that gold stocks move higher for several more hours before topping. Of course, I can’t rule out a situation in which miners move even higher even for several additional days, but this seems rather unlikely at this point.
Based on the historical analogies to two major crises, it seems that we are very close to the top in mining stocks, or we have already seen it.
The really interesting thing about yesterday’s [Mar. 20] session is that the HUI Index didn’t move to new highs, which means that the analogy in terms of the length of the third upswings is very much intact.
Moreover, after the final top, the HUI Index moved lower in a measured way initially, and we see the same thing right now.
Also, if we count the length of the entire rally, it took 53 hours in 2008. Right now, we are 49 hours after the bottom. So, it still seems that the top is in or at hand – also from this perspective.
The thing that I’d like to add today is that back in 2008, the very first part of the decline took the HUI Index back to the previous lows, then it moved sideways for a short while, and then the decline continued.
This time, it took just a single session for the HUI Index to slide to its previous local high. So, if we now see a pause or even a small corrective upswing, it will be something normal – and not bullish.
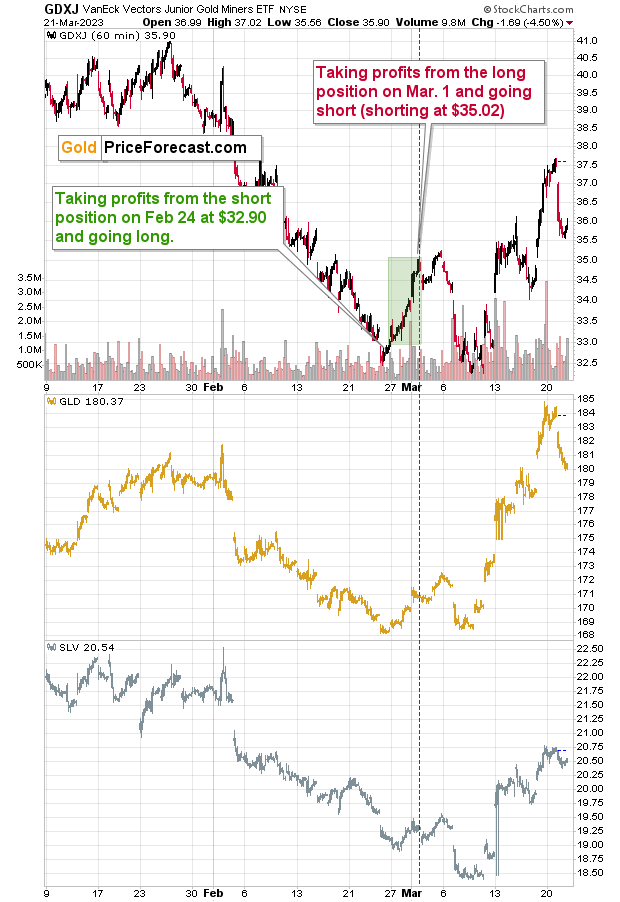
Let’s see how junior miners, gold, and silver performed.
In short, they all declined yesterday, but their relative strength is what provides the most information here.
Junior miners plunged, gold declined, and silver was down just a bit.
This is exactly how they are all supposed to (tend to) act in the early part of the decline. Miners start, silver lags. Then, close to the end of the move, miners tend to lag while silver catches up. There are exceptions, and I described one of them yesterday, but overall, that’s what we tend to see over and over again.
Based on the recent upswings, it might no longer be clear whether juniors are still weak relative to gold or not.
I marked the entry point of our short positions in the junior miners with a red, vertical line. As you can see, right now, the GDXJ is just a little above this level (less than a dollar, so less than the GDXJ declined just yesterday), while gold is substantially higher.
Gold is close to its February high, while the GDXJ is several dollars below it.
A sizable part of the value that I provide in my Gold Trading Alerts comes from selecting the part of the precious metals sector with the optimal risk-to-reward ratio. In the recent trades, it was the junior mining stock sector that provided the best ratio (and the recent super-boost of profits from a quick FCX trade was an extra add-on), and indeed, when things went according to the position, it magnified the moves, and in case something moved differently, juniors were least affected (except for very local moves, that is).
Trading Idea for Future Similar Situations
This also provides an additional trade idea for similar situations in the future – when there is a sizable risk that the panic will trigger safe-haven buying but the trend is still down for the precious metals sector in general, it might be a good idea to enter a specific spread – or simply hedge short positions in mining stocks.
How? By going long gold while keeping short positions in the miners intact. This would limit miners’ gains somewhat but serve as a great protection against real-world-based turmoil.
Gold used to serve as a safe haven for millennia, but gold stocks didn’t. And we can still see it in the charts today. Gold stocks follow gold, but they are not as strong as miners are.
To clarify: I am discussing the potential way in which I might approach situations similar to what we saw recently – in the future. I am not saying that it’s a good idea to buy gold now (unless you don’t have any physical gold as insurance capital). I think that gold’s rally has already run its course. Well, there might be some sideways trading, like there was in 2008 before the slide, but there also might be none (like in 2020).
Profit Opportunities
Right now, the GDXJ continues to provide a superb trading opportunity – even better than what we had in mid-Feb. when it was trading at similar price levels. That’s due to the fact that we had already seen a decent corrective upswing recently. This opens the door to a truly breathtaking move… which would be in perfect tune with how things developed in both 2020 and 2008.
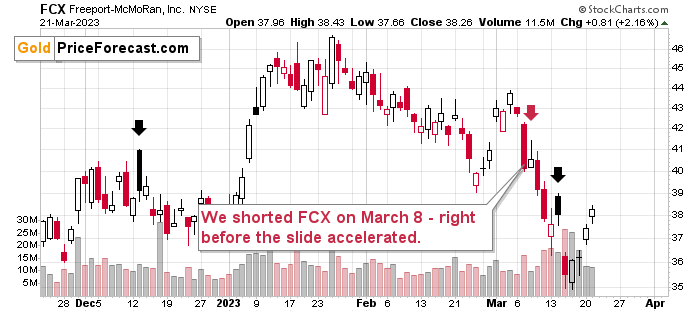
One additional word (ok, more than one) on the FCX before we continue.
The comment is that FCX rallied well over 5% after we took profits from the short positions that we had entered on March 8. So, if you followed that trade, you not only entered very early in the fastest drop in months, but you also exited very close to the local bottom – congratulations once again! That was our sixth profitable trade in a row (taking unleveraged instruments into account). And given yesterday’s slide in the GDXJ and the link to 2008, it seems (no promises, of course, but that’s my honest opinion) that we’ll see spectacular growth in profitability in the following weeks.
In yesterday’s analysis, I discussed a specific detail of the gold stocks – gold link, and I’d like to quote the entire analysis thereof also today, as I want to be sure everyone has a chance to see it. Especially, that it seems to have worked one more time (given yesterday’s slide in the miners):
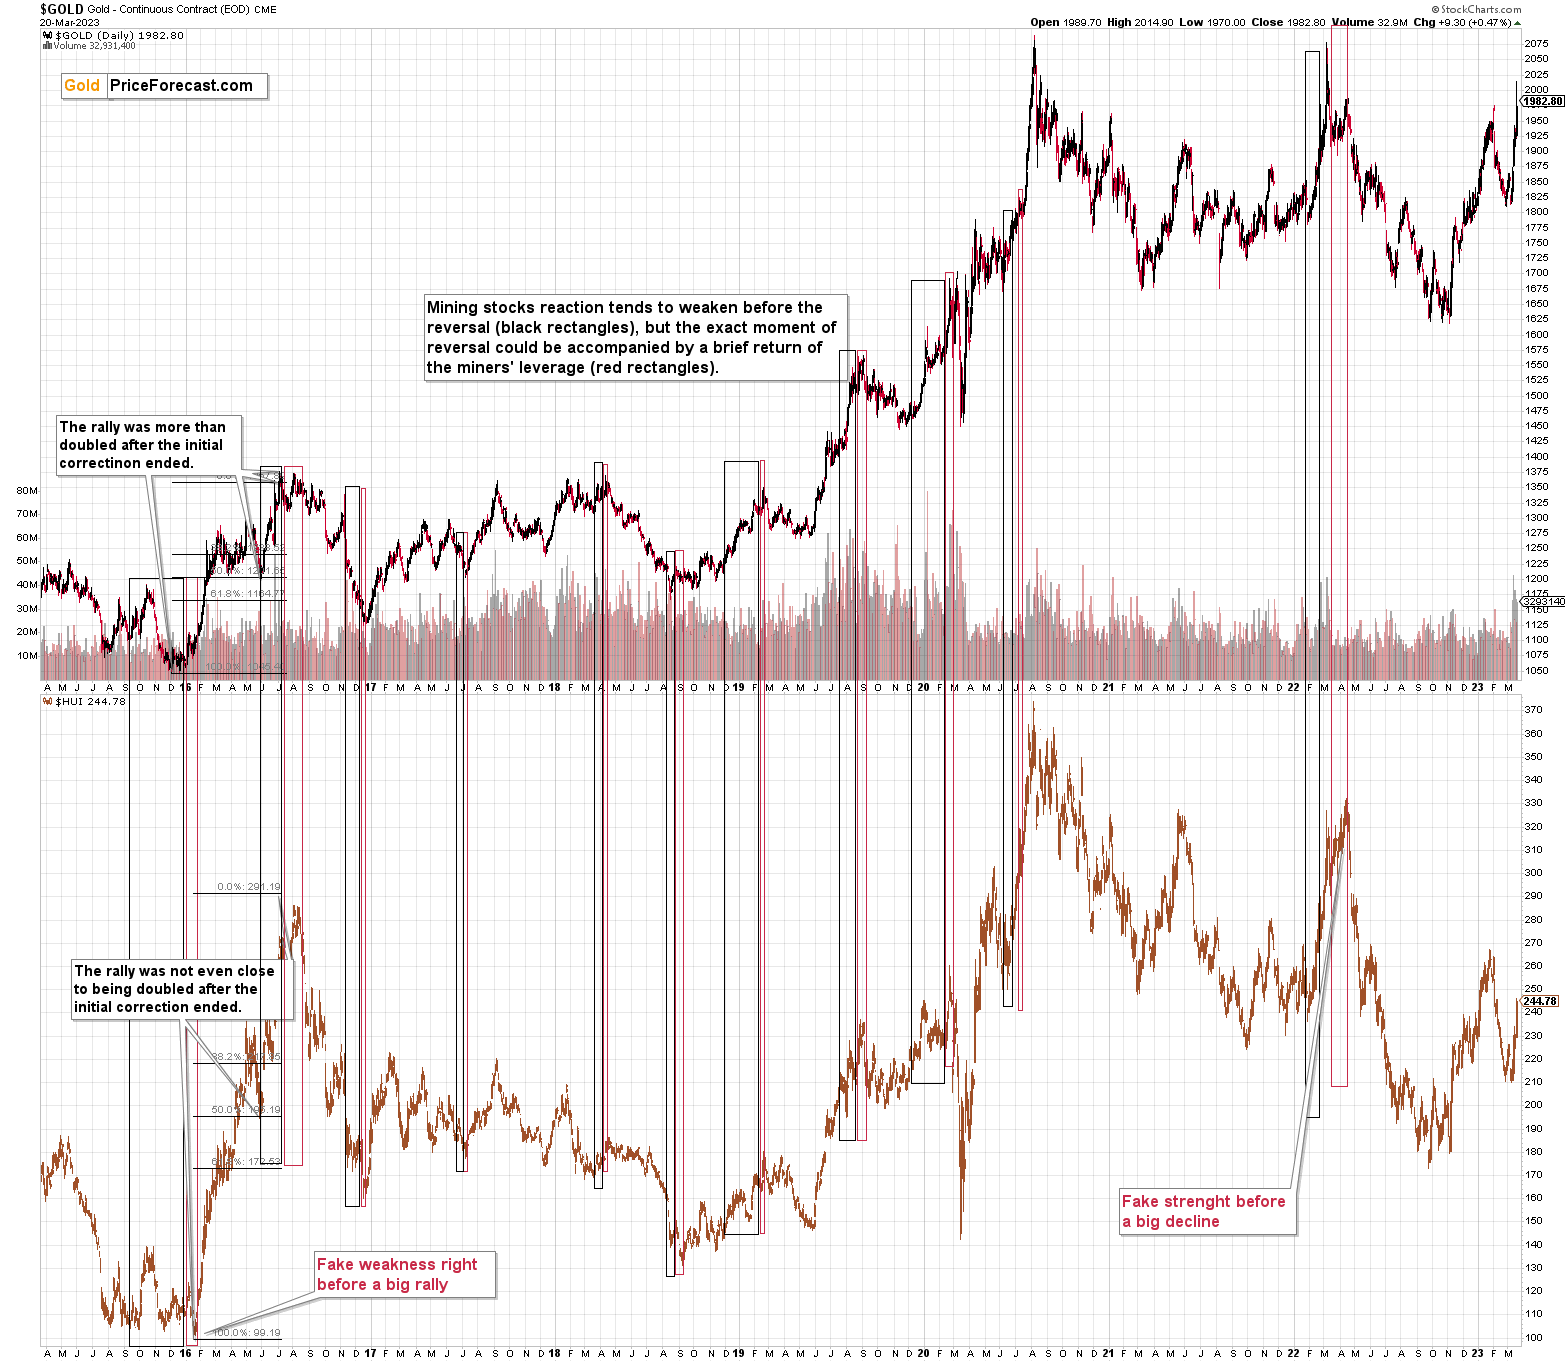
Having said that, let’s dig into the long-term chart featuring the HUI Index (proxy for gold stocks) and gold.
The black rectangles on the above chart show periods when gold stocks are weak relative to gold – they have low leverage to it. This suggests that the trend is about to change.
However – and this is the key exception that I want to emphasize today – this relationship can be turned upside down at the very end of a given move, especially bigger moves.
This is most likely (that’s very sector-specific; there’s no other research on that topic that I know of besides my own analysis) one of the ways in which the specific Wall-Street rule is seen in the precious metals sector.
The rule is that at the end of a given upswing, the worst performers (and, in general, companies with the poorest fundamentals) rally strongly. Why would this be the case? The tops are formed when the investment public enters the market. Those investors are rather uninformed and simply follow the herd. They buy those cheap assets without stopping to reflect and ask if there’s a reason for them to be cheap in the first place.
Are the current times highly emotional? Of course!
Does this support herd-following mechanisms? You bet!
So, is there a good chance that the “buy the cheap, regardless of… whatever!” mechanism was triggered as well? Yes!
The above chart shows that this is quite often the case in the case of bigger rallies: after a period of weakness, the rally actually ends with a brief return of leverage. It’s a sector-specific bull trap.
It can also work the other way. In fact, this very mechanism started the 2016 rally – there was a fake decline and a fake breakdown, despite the fact that we hadn’t seen similar moves in gold at that time.
What followed then? A sharp rally.
What’s likely to follow now, given that everything is opposite?
A sharp decline.
All in all, while in most cases gold stocks’ strength relative to gold would be bullish, this time it seems that the implications are precisely opposite.
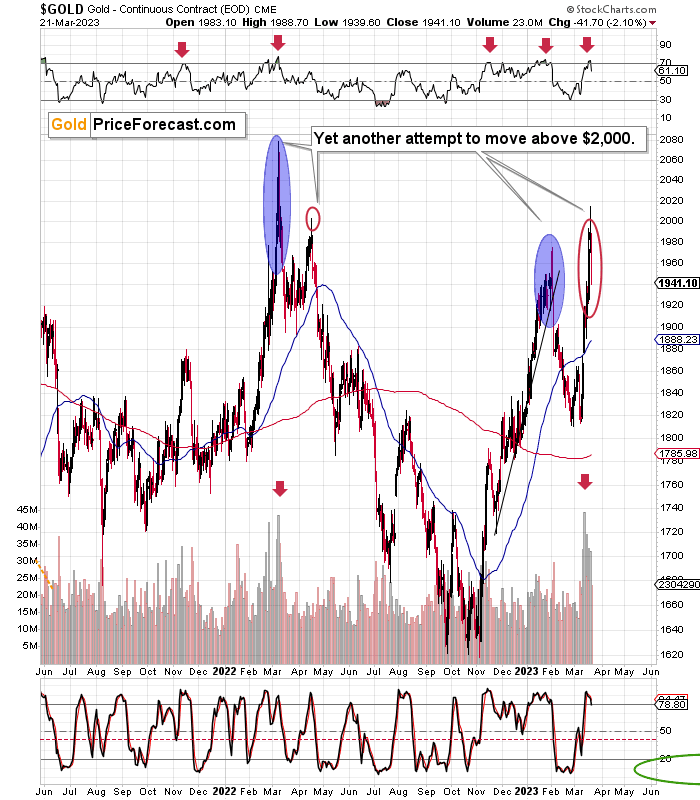
Let’s turn to gold.
The yellow precious metal moved sharply lower.
This is yet another time when gold declined substantially after the RSI moved above 70.
This is yet another time when gold declined sharply after a rally that took place on strong volume. Practically each time that happens, many investors get excited (actually, it’s the other way around, people get excited and make transactions, which in turn creates big volume readings) and they buy… at the top. How many times have you read or heard that the emotions peak at tops? That’s exactly what we just witnessed in practice.
Finally, this is yet another time when gold tried to move above the $2,000 level but failed to hold above this level. In each previous attempt, gold declined profoundly.
Given the similarity not only between 2020 and 2008 but also with how gold performed in 2022 (double-top close to $2,000), it seems that it’s ready to slide in a big way.
Finally, since the interest rate decision and the following conference are today, the markets might be:
- Volatile in intraday terms (so one might as well ignore those moves)
- Ready to move in a meaningful manner only after the announcement and after the dust settles (the initial reaction might not count).
Consequently, instead of trying to guess what Powell is going to do or say, I think it’s best to wait until the dust settles and then see how the trends resume – and the trend in junior mining stocks is clearly to the downside, and the downside potential in it remains enormous.
What’s going to happen to the rates, in my opinion? I think we’re going to see a 0.25% hike. At the moment of writing these words, about 89% of market participants agree with this expectation. Some assume that there will be no hike. So, if there is one, it will be a bearish surprise to the latter – and something bearish for stocks, gold, and – most importantly – junior mining stocks.
Again, the enormous potential for the current short position in junior mining stocks remains fully intact. I can’t make any guarantees, but I expect the profits from this trade to be some of the biggest that we have ever achieved.
Overview of the Upcoming Part of the Decline
- It seems that we’re seeing another – and probably final – corrective upswing in gold, which is likely to be less visible in the case of silver and mining stocks.
- If we see a situation where miners slide in a meaningful and volatile way while silver doesn’t (it just declines moderately), I plan to – once again – switch from short positions in miners to short positions in silver. At this time, it’s too early to say at what price levels this could take place and if we get this kind of opportunity at all – perhaps with gold prices close to $1,500 - $1,550.
- I plan to switch from the short positions in junior mining stocks or silver (whichever I’ll have at that moment) to long positions in junior mining stocks when gold / mining stocks move to their 2020 lows (approximately). While I’m probably not going to write about it at this stage yet, this is when some investors might consider getting back in with their long-term investing capital (or perhaps 1/3 or 1/2 thereof).
- I plan to return to short positions in junior mining stocks after a rebound – and the rebound could take gold from about $1,450 to about $1,550, and it could take the GDXJ from about $20 to about $24. In other words, I’m currently planning to go long when GDXJ is close to $20 (which might take place when gold is close to $1,450), and I’m planning to exit this long position and re-enter the short position once we see a corrective rally to $24 in the GDXJ (which might take place when gold is close to $1,550).
- I plan to exit all remaining short positions once gold shows substantial strength relative to the USD Index while the latter is still rallying. This may be the case with gold prices close to $1,400 and GDXJ close to $15 . This moment (when gold performs very strongly against the rallying USD and miners are strong relative to gold after its substantial decline) is likely to be the best entry point for long-term investments, in my view. This can also happen with gold close to $1,400, but at the moment it’s too early to say with certainty.
- The above is based on the information available today, and it might change in the following days/weeks.
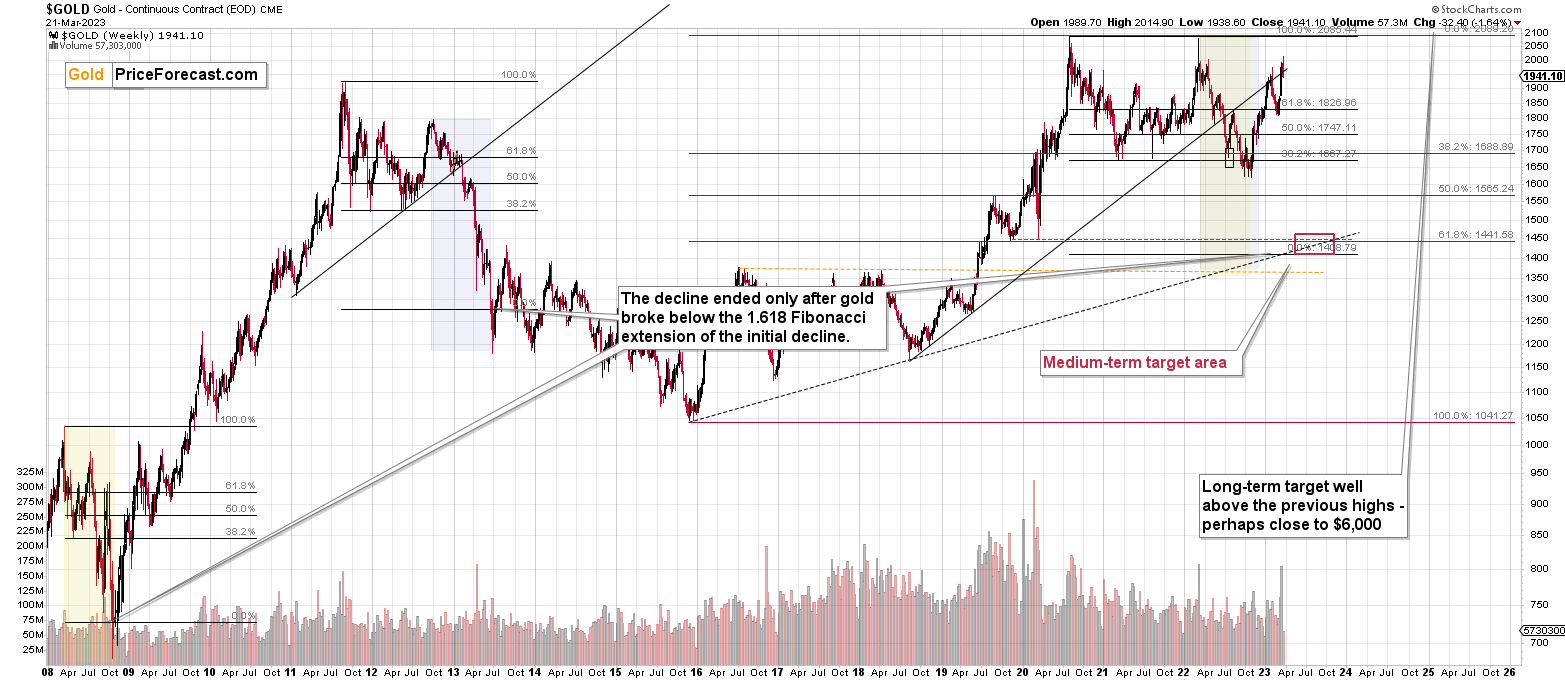
You will find my general overview of the outlook for gold on the chart below:
Please note that the above timing details are relatively broad and “for general overview only” – so that you know more or less what I think and how volatile I think the moves are likely to be – on an approximate basis. These time targets are not binding nor clear enough for me to think that they should be used for purchasing options, warrants, or similar instruments.
Letters to the Editor
Please post your questions in the comments feed below the articles, if they are about issues raised within the article (or in the recent issues), and if they are about other, more universal matters, I encourage you to use the Ask the Community space (I’m also part of the community, after all), so that more people can contribute to the reply and then enjoy the answer. Of course, let’s keep the target-related discussions in the premium space (where you’re reading this).
Summary
To summarize, we recently took profits from the additional FCX trade (right before the trend reversed!) and the current short position in junior mining stocks is – in my view – poised to become very profitable in the following weeks and perhaps days.
Things might appear chaotic in the precious metals market right now, but based on the analogy to the previous crises (2020 and 2008), it’s clear that gold, miners, and other markets are pretty much doing the same thing all over again.
The implications of this “all over” are extremely bearish for junior mining stocks. Back in 2008, at a similar juncture, GDXJ’s price was about to be cut in half in about a week! In my opinion, while the decline might not be as sharp this time, it’s likely to be enormous anyway and very, very, very profitable.
===
As a reminder, we still have a “promotion” that allows you to extend your subscription for up to three (!) years at the current prices… with a 20% discount! And it would apply to all those years, so the savings could be substantial. Given inflation this high, it’s practically certain that we will be raising our prices, and the above would not only protect you from it (at least on our end), but it would also be a perfect way to re-invest some of the profits that you just made.
The savings can be even bigger if you apply it to our All-inclusive Package (Stock- and Oil- Trading Alerts are also included). Actually, in this case, a 25% discount (even up to three years!) applies, so the savings are huge!
If you’d like to extend your subscription (and perhaps also upgrade your plan while doing so), please contact us – our support staff will be happy to help and make sure that your subscription is set up perfectly. If anything about the above is unclear, but you’d like to proceed – please contact us anyway :).
As always, we'll keep you – our subscribers – informed.
To summarize:
Trading capital (supplementary part of the portfolio; our opinion): Full speculative short positions (300% of the full position) in junior mining stocks are justified from the risk to reward point of view with the following binding exit profit-take price levels:
Mining stocks (price levels for the GDXJ ETF): binding profit-take exit price: $26.13; stop-loss: none.
Alternatively, if one seeks leverage, we’re providing the binding profit-take levels for the JDST (2x leveraged). The binding profit-take level for the JDST: $13.87; stop-loss for the JDST: none.
For-your-information targets (our opinion; we continue to think that mining stocks are the preferred way of taking advantage of the upcoming price move, but if for whatever reason one wants / has to use silver or gold for this trade, we are providing the details anyway.):
Silver futures downside profit-take exit price: $17.83 (stop-loss: none)
SLV profit-take exit price: $16.73 (stop-loss: none)
ZSL profit-take exit price: $32.97 (stop-loss: none)
Gold futures downside profit-take exit price: $1,743 (stop-loss: none)
HGD.TO – alternative (Canadian) 2x inverse leveraged gold stocks ETF – the upside profit-take exit price: $10.97 (stop-loss: none due to vague link in the short term with the U.S.-traded GDXJ)
HZD.TO – alternative (Canadian) 2x inverse leveraged silver ETF – the upside profit-take exit price: $25.47 (stop-loss: none)
Long-term capital (core part of the portfolio; our opinion): No positions (in other words: cash)
Insurance capital (core part of the portfolio; our opinion): Full position
Whether you’ve already subscribed or not, we encourage you to find out how to make the most of our alerts and read our replies to the most common alert-and-gold-trading-related-questions.
Please note that we describe the situation for the day that the alert is posted in the trading section. In other words, if we are writing about a speculative position, it means that it is up-to-date on the day it was posted. We are also featuring the initial target prices to decide whether keeping a position on a given day is in tune with your approach (some moves are too small for medium-term traders, and some might appear too big for day-traders).
Additionally, you might want to read why our stop-loss orders are usually relatively far from the current price.
Please note that a full position doesn't mean using all of the capital for a given trade. You will find details on our thoughts on gold portfolio structuring in the Key Insights section on our website.
As a reminder - "initial target price" means exactly that - an "initial" one. It's not a price level at which we suggest closing positions. If this becomes the case (as it did in the previous trade), we will refer to these levels as levels of exit orders (exactly as we've done previously). Stop-loss levels, however, are naturally not "initial", but something that, in our opinion, might be entered as an order.
Since it is impossible to synchronize target prices and stop-loss levels for all the ETFs and ETNs with the main markets that we provide these levels for (gold, silver and mining stocks - the GDX ETF), the stop-loss levels and target prices for other ETNs and ETF (among other: UGL, GLL, AGQ, ZSL, NUGT, DUST, JNUG, JDST) are provided as supplementary, and not as "final". This means that if a stop-loss or a target level is reached for any of the "additional instruments" (GLL for instance), but not for the "main instrument" (gold in this case), we will view positions in both gold and GLL as still open and the stop-loss for GLL would have to be moved lower. On the other hand, if gold moves to a stop-loss level but GLL doesn't, then we will view both positions (in gold and GLL) as closed. In other words, since it's not possible to be 100% certain that each related instrument moves to a given level when the underlying instrument does, we can't provide levels that would be binding. The levels that we do provide are our best estimate of the levels that will correspond to the levels in the underlying assets, but it will be the underlying assets that one will need to focus on regarding the signs pointing to closing a given position or keeping it open. We might adjust the levels in the "additional instruments" without adjusting the levels in the "main instruments", which will simply mean that we have improved our estimation of these levels, not that we changed our outlook on the markets. We are already working on a tool that would update these levels daily for the most popular ETFs, ETNs and individual mining stocks.
Our preferred ways to invest in and to trade gold along with the reasoning can be found in the how to buy gold section. Furthermore, our preferred ETFs and ETNs can be found in our Gold & Silver ETF Ranking.
As a reminder, Gold & Silver Trading Alerts are posted before or on each trading day (we usually post them before the opening bell, but we don't promise doing that each day). If there's anything urgent, we will send you an additional small alert before posting the main one.
Thank you.
Przemyslaw K. Radomski, CFA
Founder, Editor-in-chief


