Briefly: in our opinion, full (250% of the regular size of the position) speculative short position in gold, silver, and mining stocks is justified from the risk/reward perspective at the moment of publishing this Alert.
Gold rallied about $20 in the last 24 hours and based on this move, it now seems clear what the next price action will be. We previously presented two alternatives for the likely outcome and based on what we just saw, the clear winner is now obvious.
Namely, instead of forming a bottom at the turn of the month, gold is much more likely to form a top. Just like a glass can be half full or half empty, one can look at it as a disappointing delay in the decline, or as blessing in disguise. It gives the decline more time and increases the potential size of the short-term downswing, thus making it easier to trade.
The most successful investors and traders don't become angry at the market if it doesn't do their bidding. They take whatever they get and make the most out of it. One of the ways to do that is to stay as objective as possible and always analyze the market as if one had seen in for the first time - without taking any previous expectations (or hopes) into account. Objectivity is what will make one grow their portfolio. And it's what will help one realize that unless the glass is in outer space or in some odd laboratory environment, it's actually always full - some of it is filled with water and the rest with air.
Let's take a look at gold.
Gold and Silver: What Has Changed and What Has Not
Two days ago, we wrote the following:
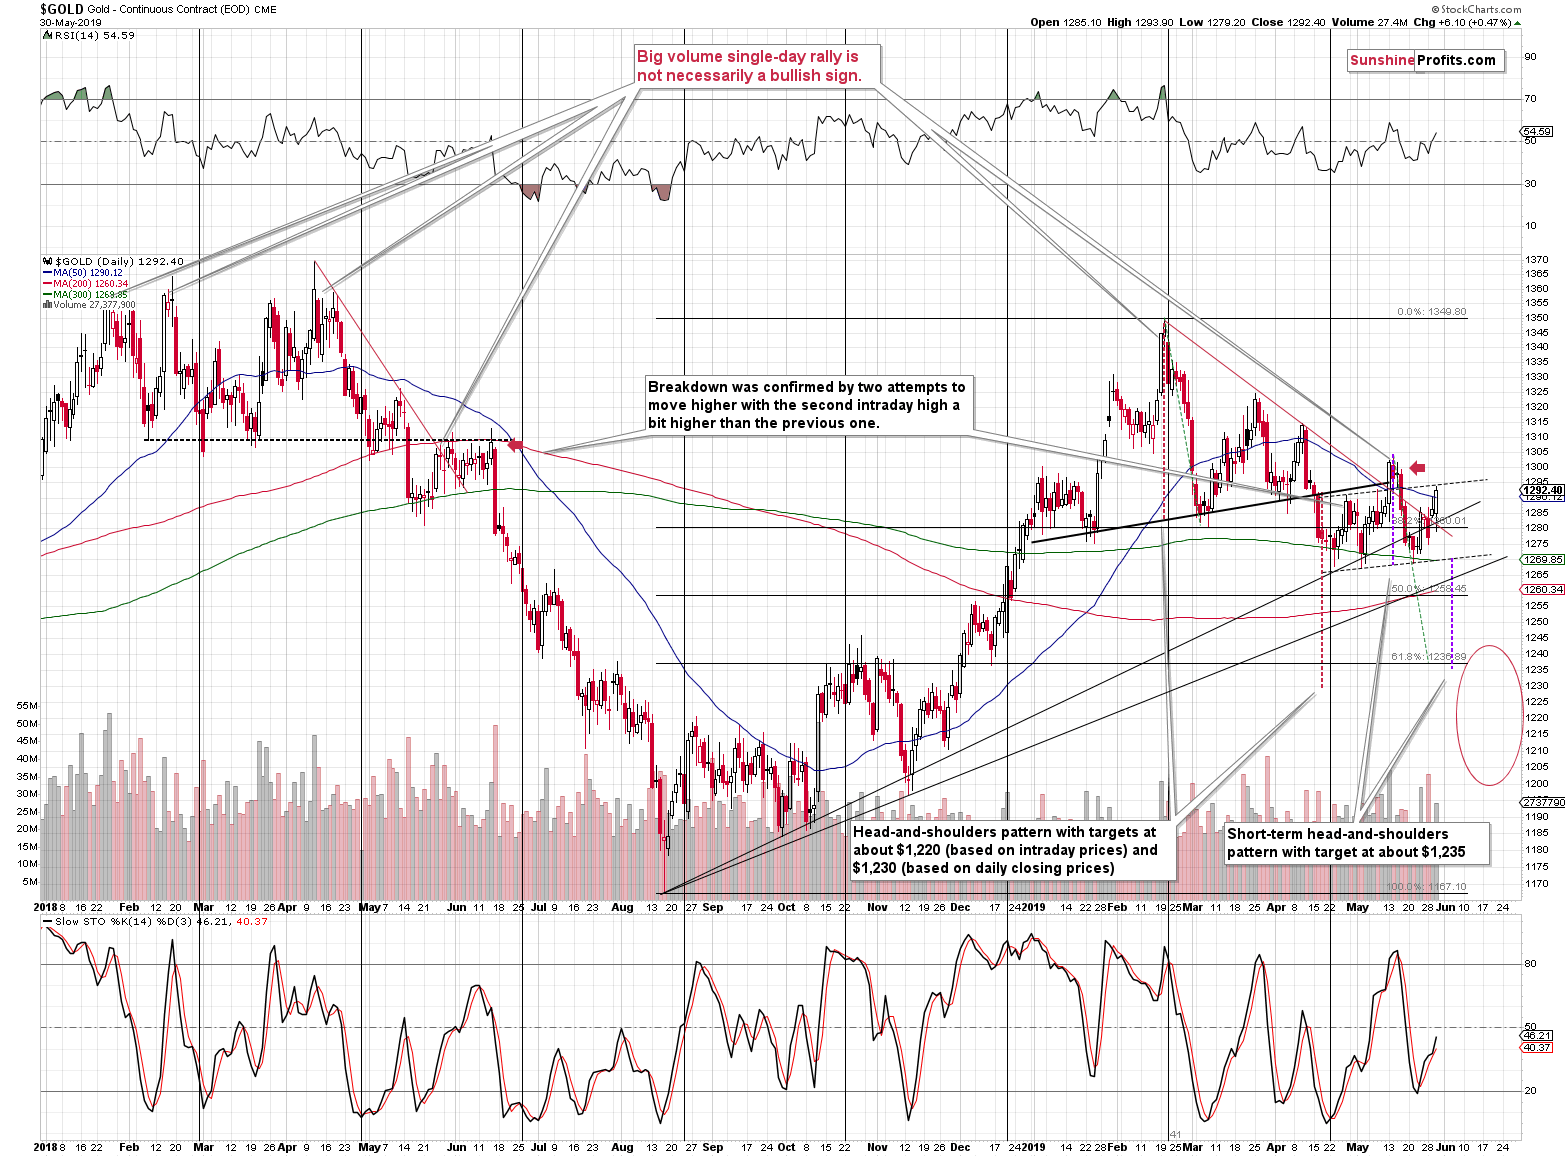
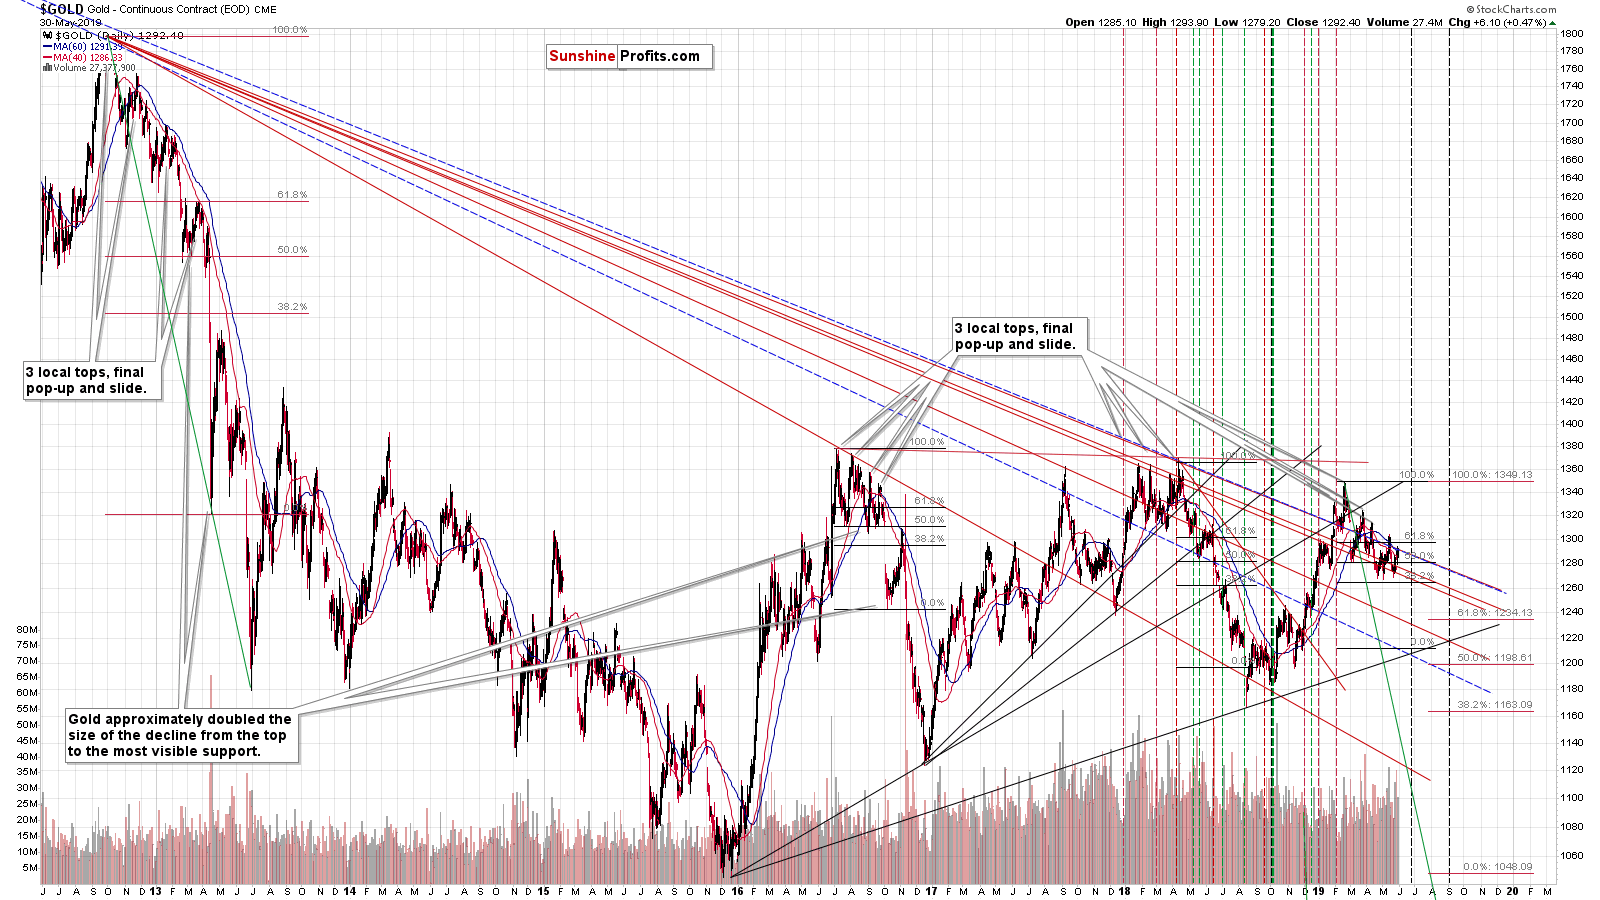
Gold is relatively close to its 2019 lows, but it has yet to break below them. What's quite interesting on the above gold chart is that the consolidation that we see forming below the January - early-April head-and-shoulders formation is by itself taking the form of a smaller head-and-shoulders pattern.
The initial top in late April (left shoulder), then the big top in mid-May (head), and last week's upswing along with this week's decline seems (right shoulder) seem to on the verge of being confirmed as a full pattern once gold breaks below the early-May lows. And we will likely not have to wait long for that to happen. Just look at how silver is paving the way to lower levels.
Yesterday's and today's pre-market move higher fit the above very well. The right shoulder of the smaller head-and-shoulder pattern became more prominent. This means that the formation - once completed - will have even greater chance of resulting in the regular head-and-shoulders follow-up action. We marked this action with a purple dashed line. The decline is likely to be as big as the size of the head and this technique is pointing to the target of about $1,235. That's very close to the 61.8% Fibonacci retracement based on the 2018 - 2019 rally - our primary target.
Gold is a bit above the late-April high - the left shoulder of the small head-and-shoulders pattern - which might make one think that the formation was broken. It wasn't - the late-May higher was higher than the early-May high, which means that the right shoulder could be higher than the left shoulder without invalidating pattern's symmetry.
There's one more thing that we would like to add while we are discussing the above chart - a note about the rising medium-term support line. It's actually not one line, but two lines. We previously created the support line based on the August and November 2018 lows, but there is actually another way to draw it. The other approach would be to use the initial bottom and then the first bottom that creates the line that was then not broken in any meaningful way. In this case, the second bottom would be the late-September 2018 bottom. Neither October 2018 bottom, nor the November 2018 bottom broke this line to any significant degree. This line seems to have worked by stopping gold's decline in early May. And if we take the three-closing-day confirmation rule into account, then it hasn't been broken up to this day.
What implication would the other line have? First, it would explain why gold is having such a hard time declining from the current levels. Second, it would mean that the lower rising support line (the one with the current support at about $1,263) is less meaningful than it seemed initially. This means that the possible support at about $1,265 would not be particularly likely to hold or stop the unfolding decline. This is good news, because it increases the odds of gold's move to our nearby target area ($1,240) without bigger corrections along the way. This in turn means that once this target ($1,240) is reached, gold is even more likely to create a tradable move to the upside. More good risk/reward trades is likely to translate into more profits.
So, is it really that bad that gold moved higher yesterday? Not necessarily.
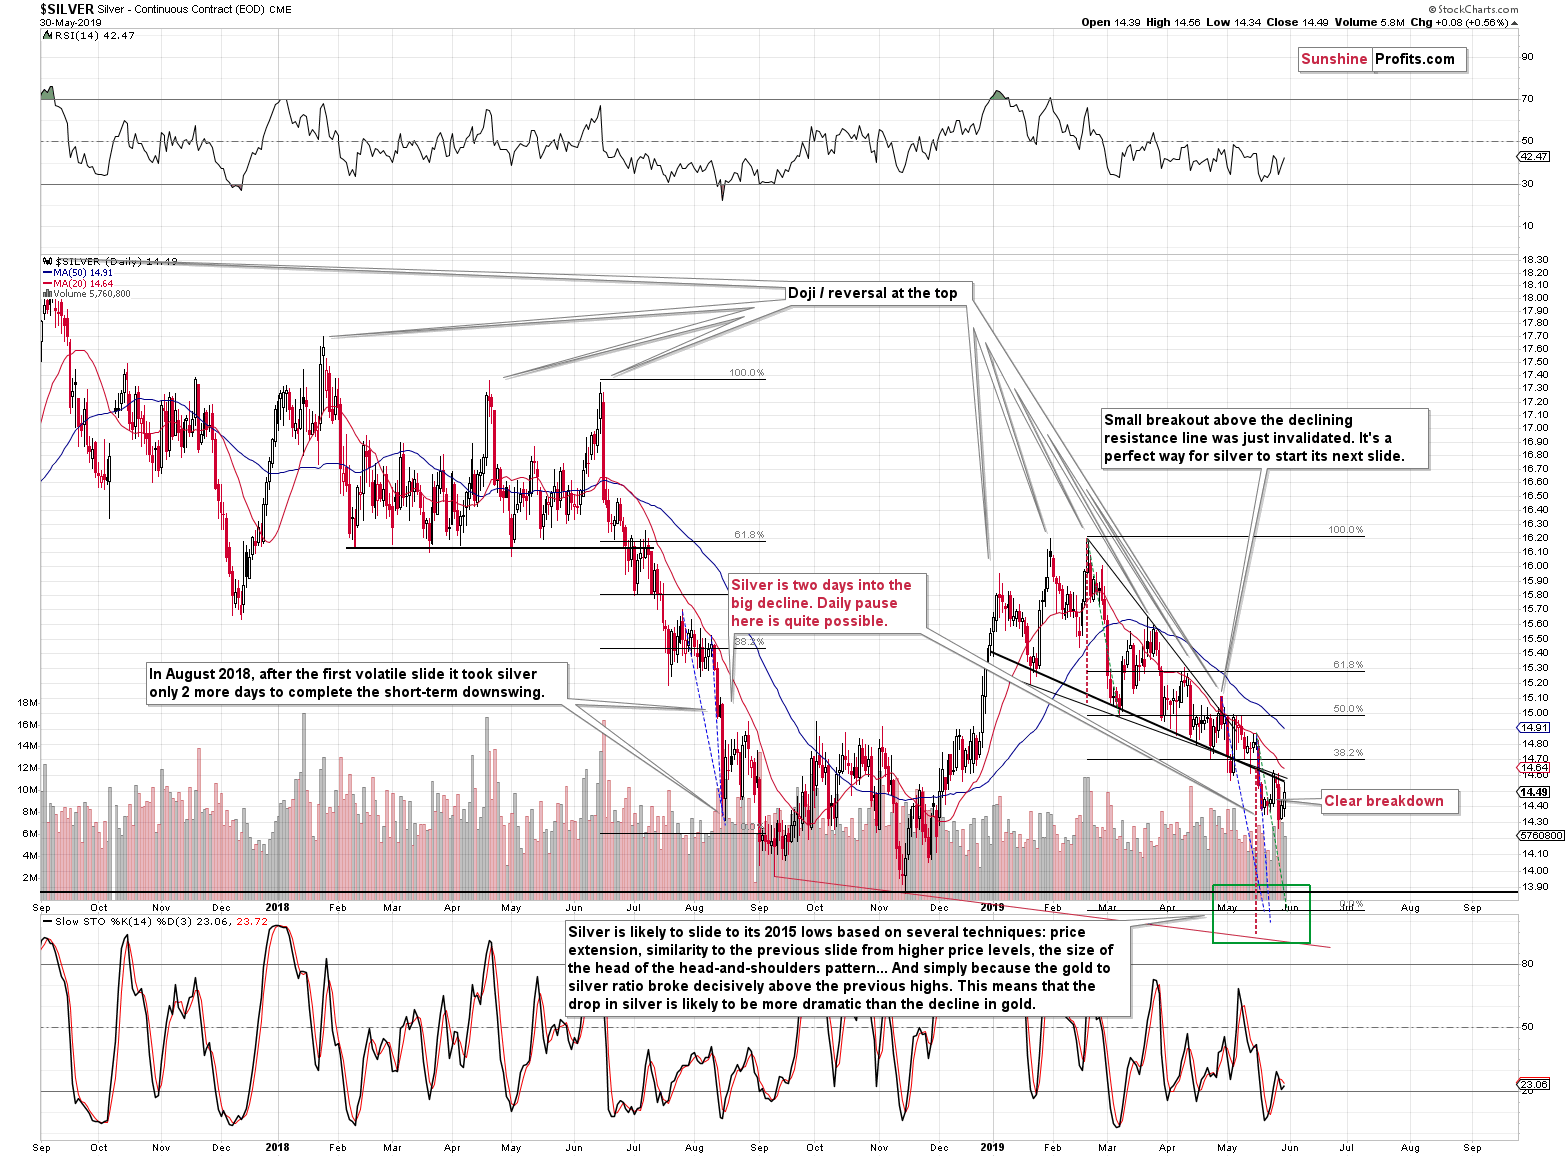
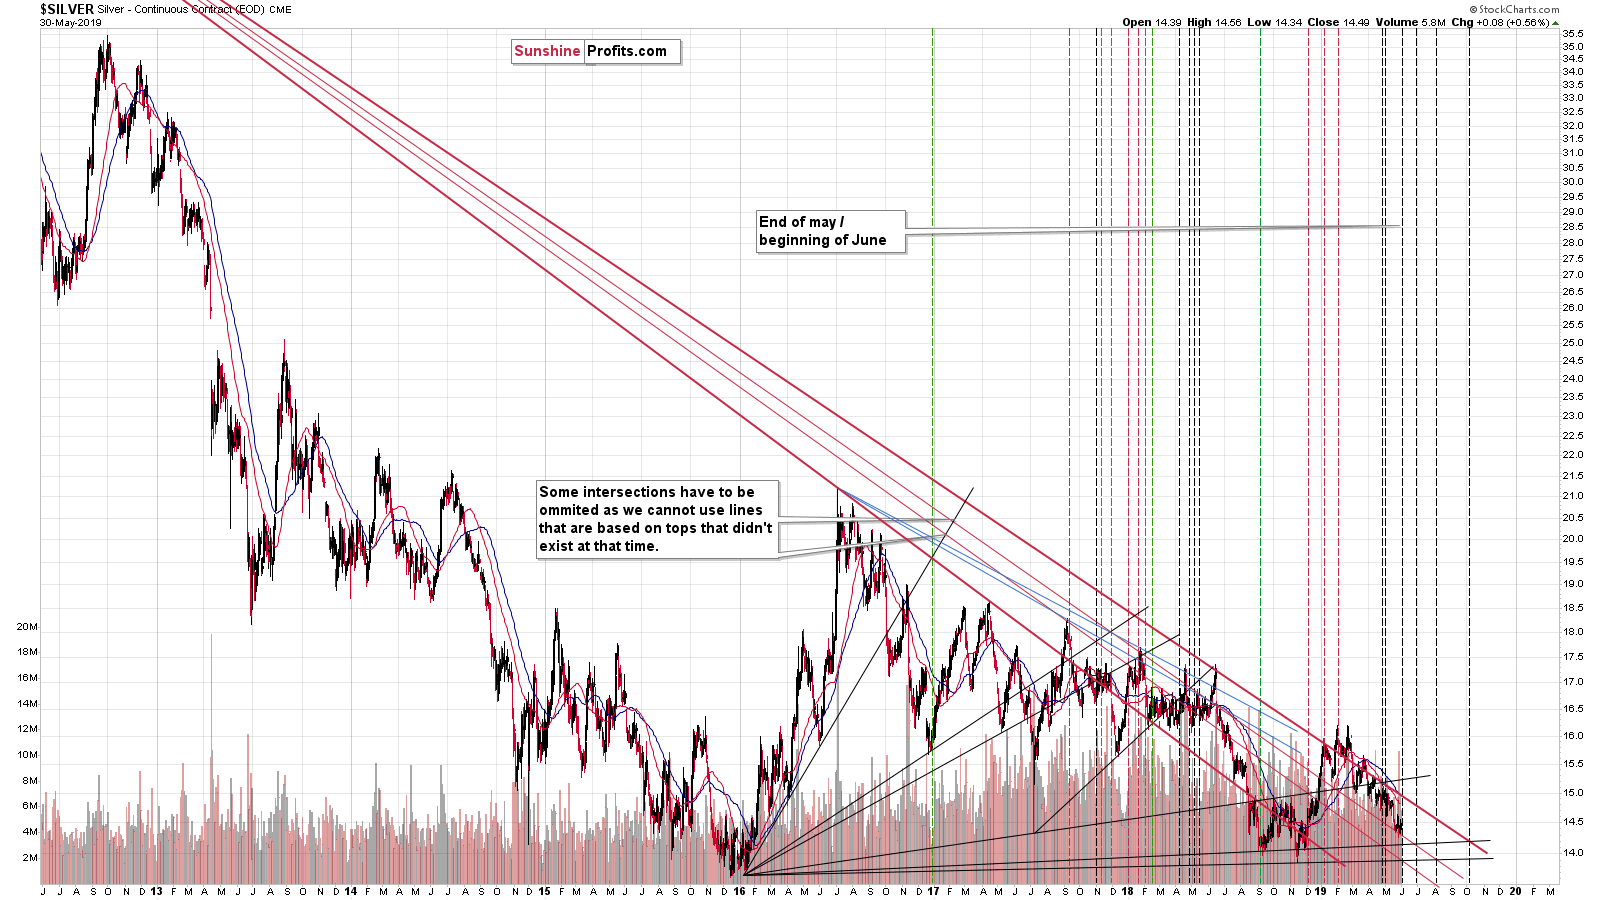
Silver moved higher as well and even a bit above the mid-May lows. However, what is more important, silver didn't move back above the declining resistance line. It simply moved to it once again and then declined, thus once again verifying it as resistance and confirming the May breakdown. The outlook remains bearish.
Turning to the Miners Now
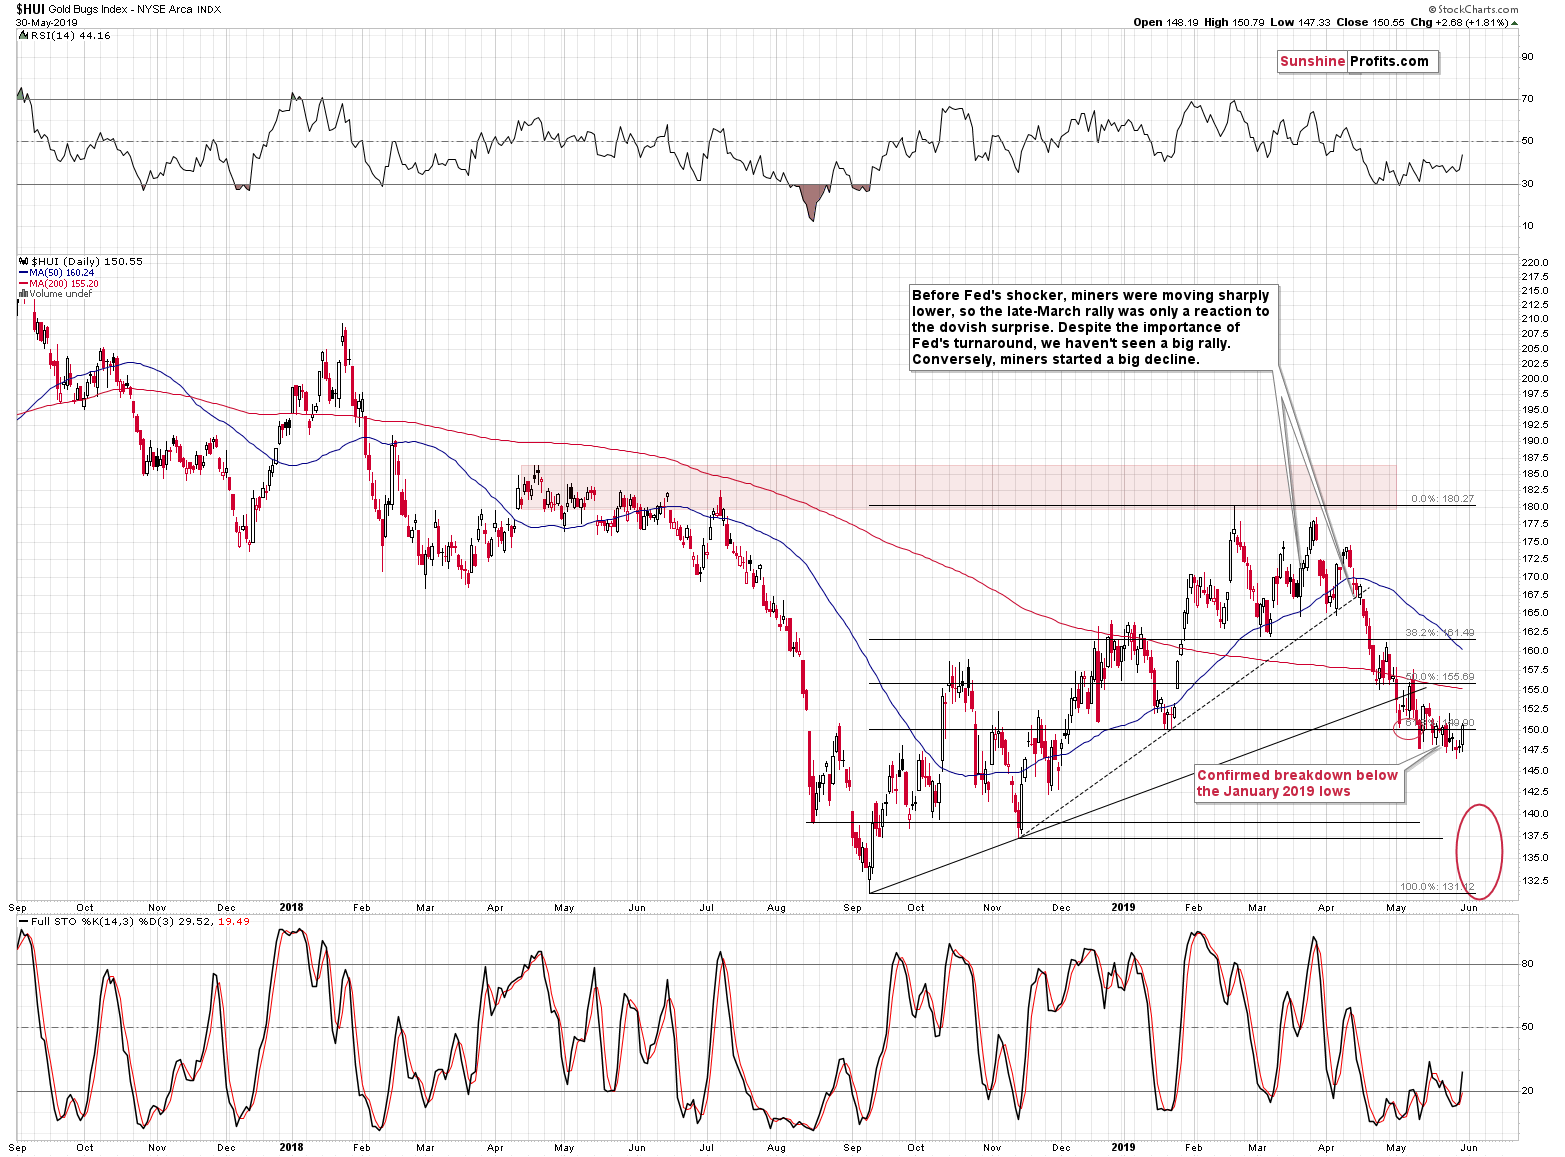
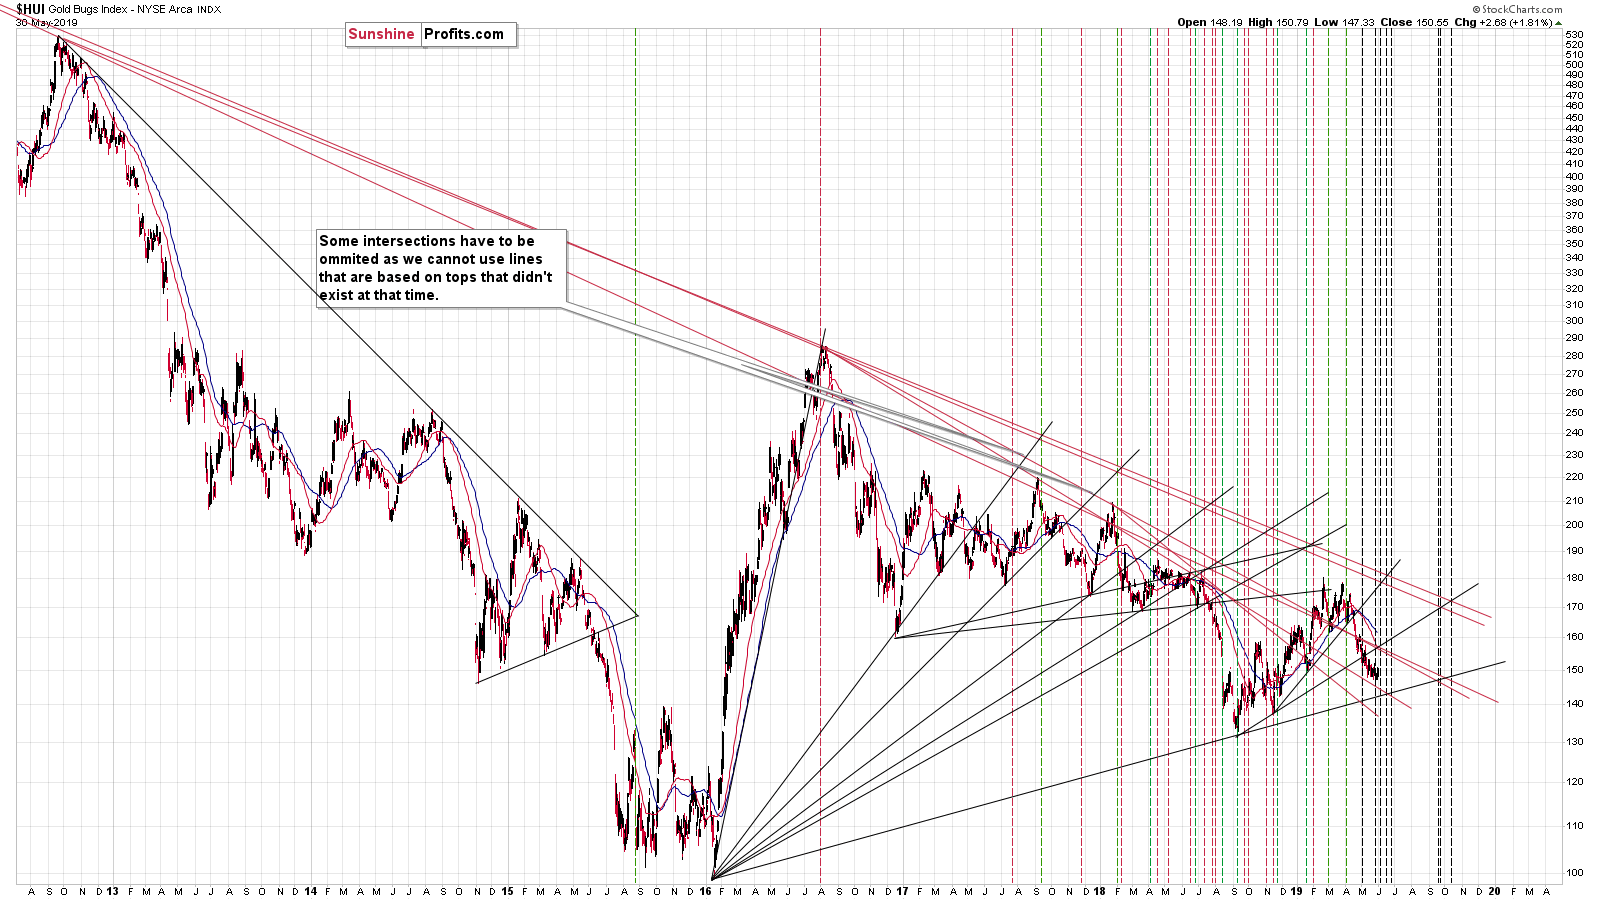
The HUI Index moved higher, but it didn't close above the lowest closing price of January. The breakdown to new 2019 lows was not invalidated, and yesterday's price action seems to be nothing more than a pause before the move lower.
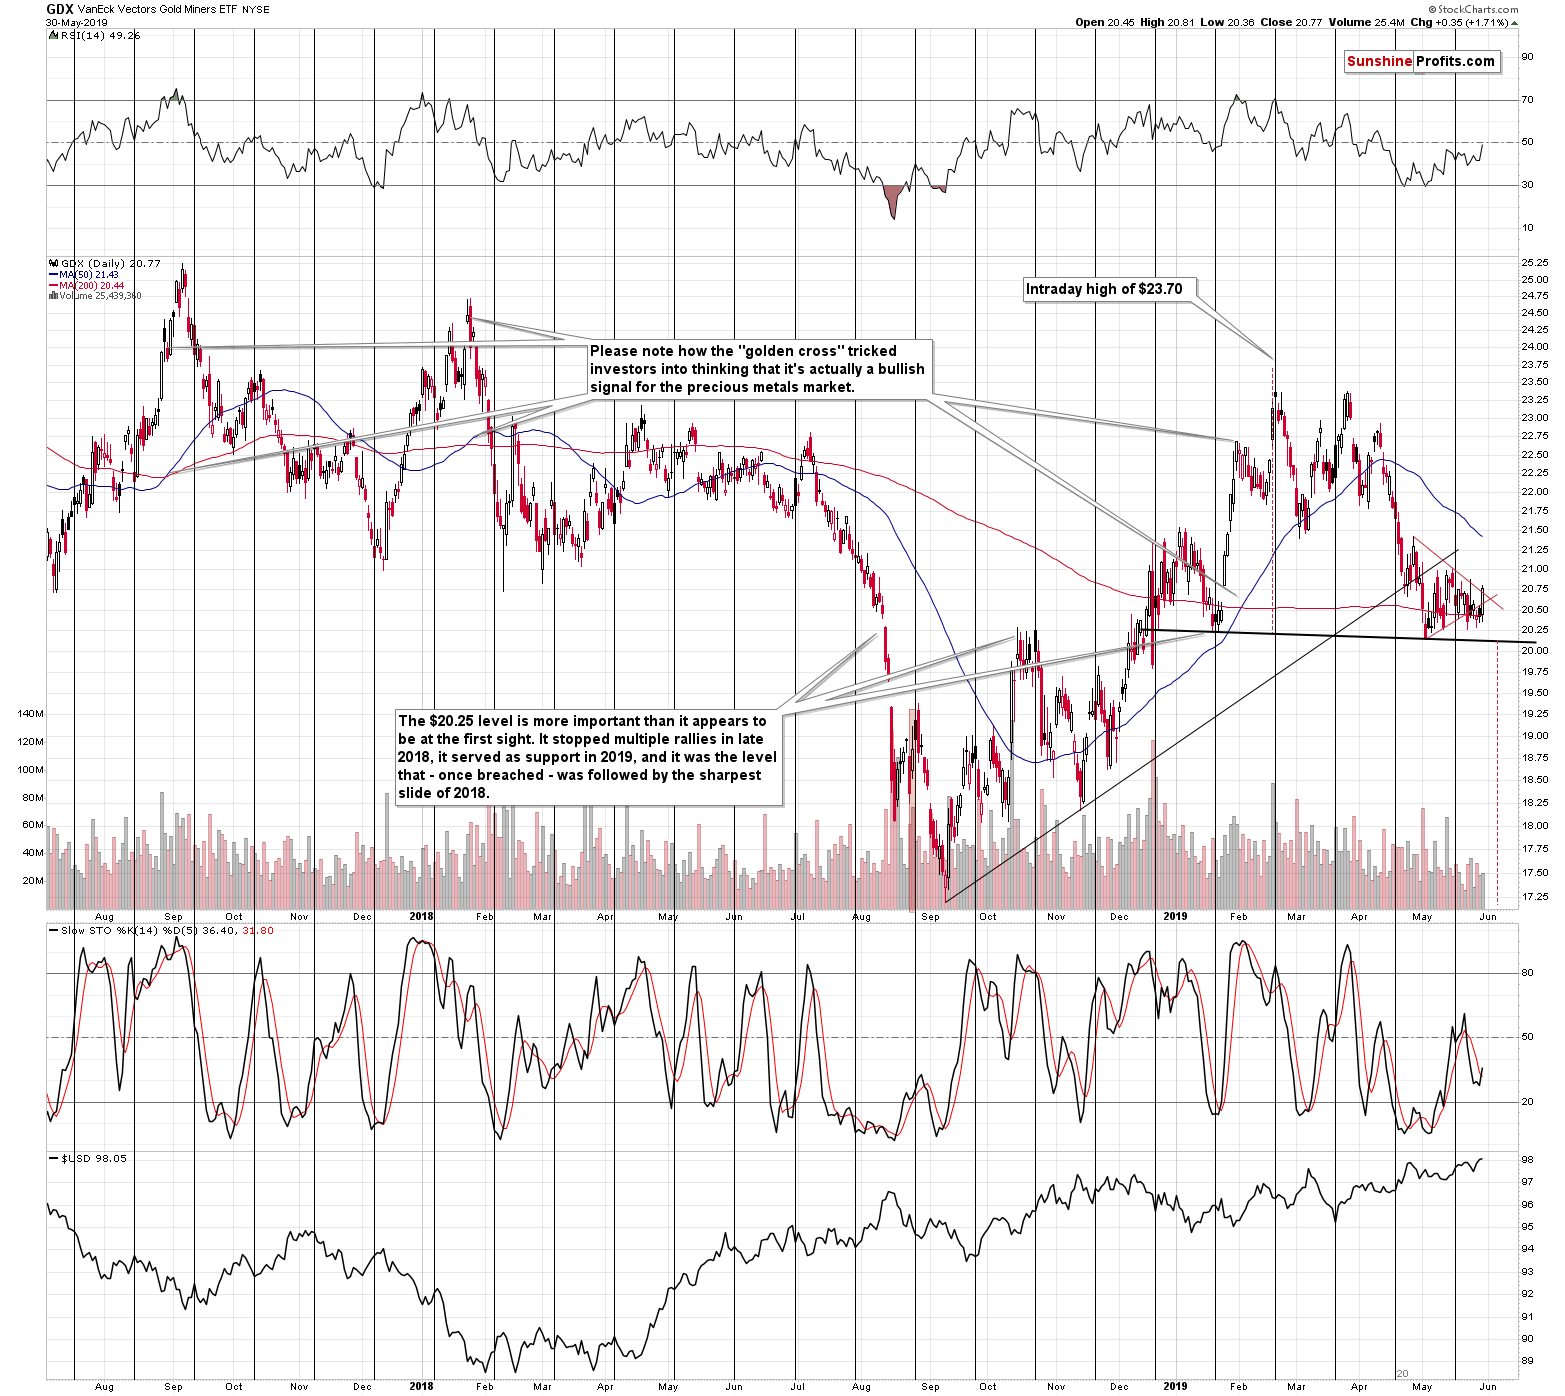
The GDX ETF moved higher on volume that was far from huge, but it did invalidate the previous breakdown below the triangle pattern. What is more, the GDX moved above its upper border. What does it all mean? It means that the triangle pattern is not particularly reliable at this time. The lines are being broken in both directions and its seems that we shouldn't take the implications at their face value. With the very short-term GDX picture rather unclear, the best guidance is provided by: the other proxies for the mining stocks (the HUI outlook remains bearish) and the medium-term outlook.
As far as the medium term is concerned, we continue to see the right shoulder of a sizable head-and-shoulders pattern being formed. Of course, the formation will be complete only after the breakdown below the neck level at about $20, but given what we see in gold, silver, HUI, and USD Index, it seems that we will see this breakdown shortly. This potential formation has a target at the September 2018 low, so we need to be ready for a big move.
What Could Trigger Such a Move?
Speaking of the USD Index, let's start analyzing it by quoting what we wrote previously:
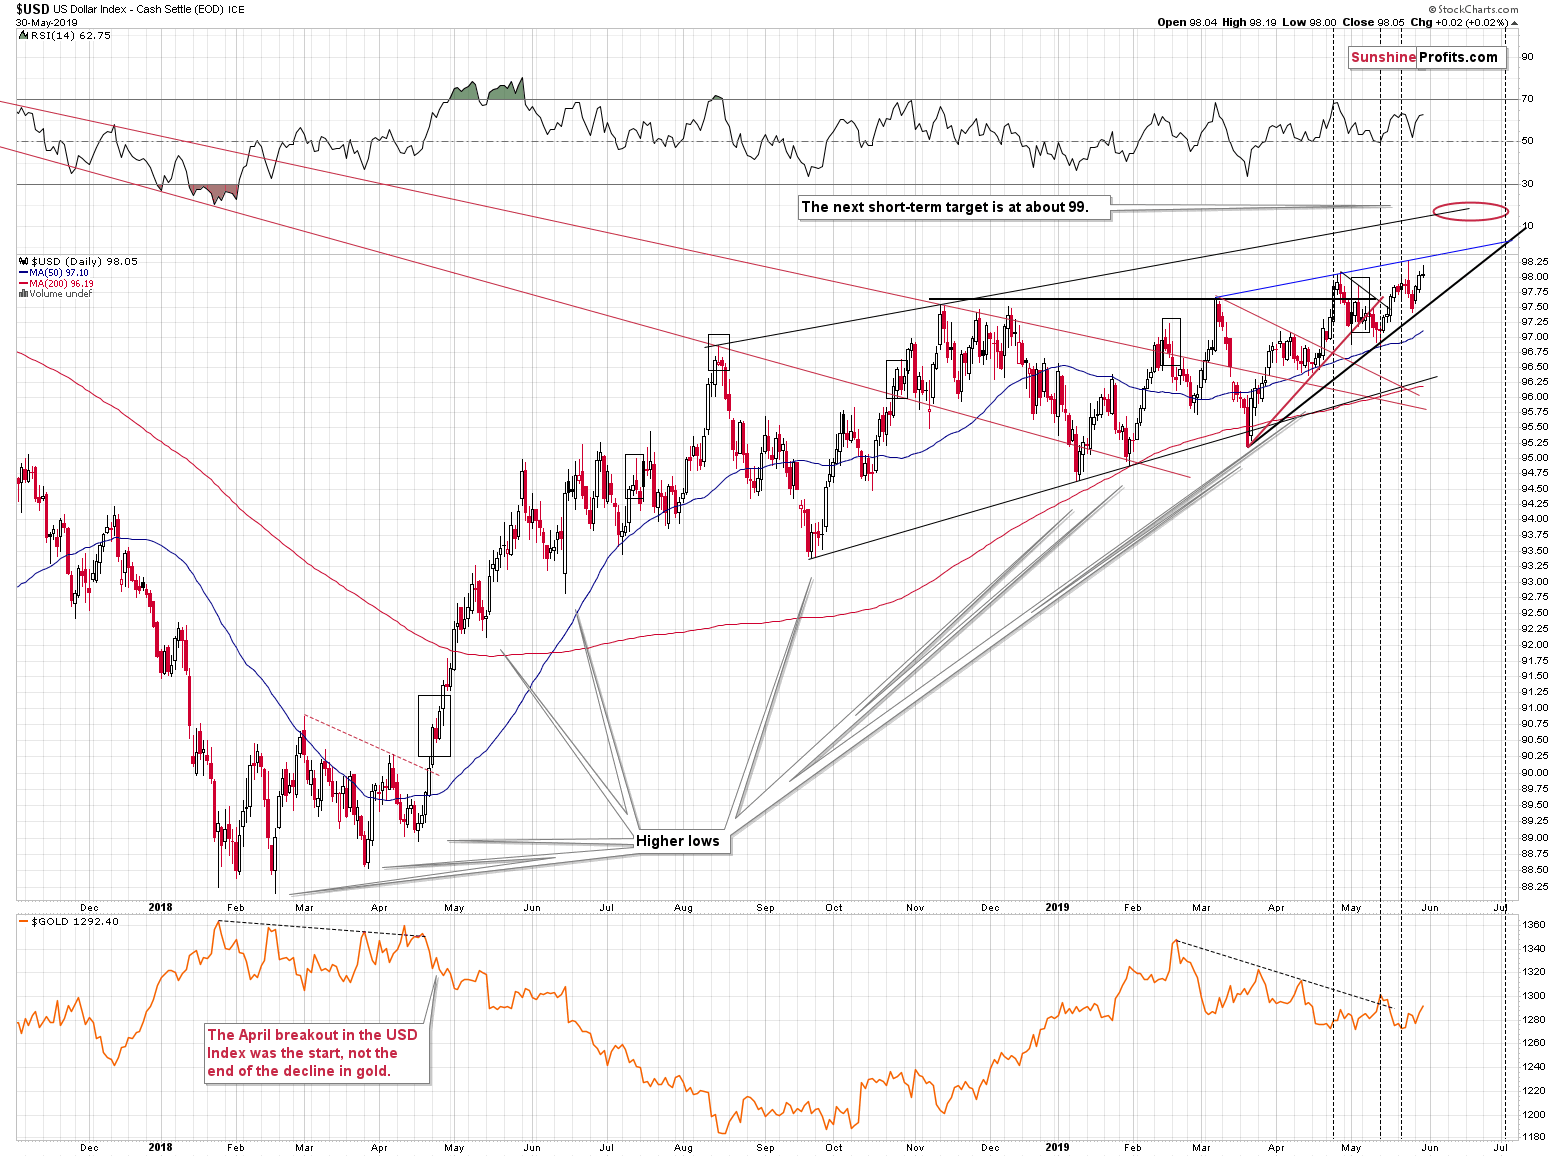
The U.S. currency didn't move to new yearly highs in intraday terms, but it did so in terms of closing prices. This is an important bullish development. The breakout is not confirmed yet and very few people seem to believe it, which is most likely why the precious metals market didn't react yet. There were so many attempts to break above the current levels that it will likely take a profound move higher for other markets to catch up and really react.
And you know what? We might actually see this kind of big upswing in the USD shortly. For many weeks (and months) the USD Index has been forming higher lows, increasing the pressure for a breakout. Almost every time when USD was about to break higher, some news popped up and made it decline instead. However, the USD recovered each time and came back a little stronger. It seems that it's already at the situation where no trigger is necessary for it to move higher as there's so much technical pressure built up through the previous months.
Once USDX breaks higher, it's likely to move far. The longer the base, the stronger the move, is one of the useful technical sayings. And the base - the corrective period - took almost a year.
The implications for the precious metals market are very bearish.
We once again saw something like that. The USD is breaking higher and what did we see in the news? President Trump announces a tariff... on Mexico. That's something that is almost certain to damage the value of the US currency. Why? And most importantly - why now? Quoting the above article:
But the sudden tariff threat comes at a peculiar time, given how hard the administration has been pushing for passage of the USMCA, which would update the North American Free Trade Agreement. It comes less than two weeks after Trump lifted import taxes on Mexican and Canadian steel and aluminum, a move that seemed to clear an obstacle to its passage, and the same day that both Trump and López Obrador began the process of seeking ratification. The deal needs approval from lawmakers in all three countries before it takes effect.
So, just two weeks after reducing taxes to make improve the US-Mexico trade, it's now critical to slap tariffs?
Trump never liked the idea of strong dollar. Do you remember when the Treasury Secretary said that he would welcome a lower US dollar? That happened in late January 2018, almost right at the USD Index bottom. Then later in 2018, all the comments from Trump on monetary policy and interest rates.
We're not fans of screaming "manipulation" when things don't go our way, but the USD breakout and the tariff announcement timing is perhaps something more than a coincidence?
If so, what would it mean? Only a slight delay in USD's rally. The USD has already proved to be very strong by coming back up after each string of bearish geopolitical news. It seems that fewer people are willing to trust the tweets and "news" in general, at least with regard to the US dollar movement.
Technically, we just saw a small reversal and the USD Index could move back to about 97.60 or so - to the black rising support line. Then it would be likely to attempt another breakout. The above target is about 0.4 below yesterday's closing price. Given today's pre-market movement, we already saw about half of this move lower. Consequently, the downside potential from here seems very limited.
Another noteworthy thing that we have on the above chart is the intersection of the rising support and resistance line that takes place in early July. It might point to when we see a meaningful turnaround in the USD Index. The next upside target for the USD Index is at about 99, but given the size of the base for the move higher, it could be the case that the pullback from this level is relatively small and the USD will continue to rally relatively shortly after the initial top.
This might mean that the upcoming corrective upswing in the precious metals market is also quite brief.
Before summarizing, let's take a look at the precious metals reversal dates that appear likely based on the long-term triangle vertexes.
Triangles and Reversal Dates
In case of gold, we have a reversal date in late June. This is more or less in tune with the vertex-based reversal on the USD Index chart.
In case of silver, we have one turnaround right now, and the next is - just like what we have in gold - in late June.
As far as gold stocks are concerned, we have a series of turnarounds between now and late June. The last time when we saw so many reversals so close to each other, was in June and August 2018. That's when the biggest decline of 2018 accelerated. The sharpest part of the move ended along with the last of the reversals, which would confirm the scenario in which the bottom takes place in late June.
Now, the fact that we have quite a few interim turnarounds could indicate some choppy trading, but it could be the case that these reversals indicate only small corrections, just like the one that we saw yesterday. Just like the July and early-August 2018 corrections were not tradable from the regular point of view (different opportunities are available in case of day trading), we might see something similar also in June. At least before the final part thereof.
Summary
Summing up, even though gold moved higher yesterday, the outlook for the following weeks didn't change and it remains bearish. The news-based nature of the USD reversal makes it temporary and the same appears to be the case for the gold price rally. The HUI and silver remain below their respective resistance levels and their key breakdowns were not invalidated. The next reversal is likely to take place close shortly - but based on the recent move higher in gold the reversal is likely to be a price top. The next bottom is likely to be formed in the final part of June, which means that gold, silver and miners will have a few weeks to slide to their respective targets. This makes it more likely that miners will be able to reach their distant target along with the underlying precious metals. Once gold reaches our interim target level of $1,240, we will consider opening long positions.
To summarize:
Trading capital (supplementary part of the portfolio; our opinion): Full short position (250% of the full position) in gold, silver, and mining stocks is justified from the risk/reward perspective with the following stop-loss orders and exit profit-take price levels:
- Gold: profit-take exit price: $1,241; stop-loss: $1,357; initial target price for the DGLD ETN: $51.87; stop-loss for the DGLD ETN $39.87
- Silver: profit-take exit price: $13.81; stop-loss: $15.72; initial target price for the DSLV ETN: $39.38; stop-loss for the DSLV ETN $26.97
- Mining stocks (price levels for the GDX ETF): profit-take exit price: $17.61; stop-loss: $24.17; initial target price for the DUST ETF: $34.28; stop-loss for the DUST ETF $15.47
In case one wants to bet on junior mining stocks' prices (we do not suggest doing so - we think senior mining stocks are more predictable in the case of short-term trades - if one wants to do it anyway, we provide the details), here are the stop-loss details and target prices:
- GDXJ ETF: profit-take exit price: $24.71; stop-loss: $35.67
- JDST ETF: profit-take exit price: $78.21 stop-loss: $30.97
Long-term capital (core part of the portfolio; our opinion): No positions (in other words: cash)
Insurance capital (core part of the portfolio; our opinion): Full position
Whether you already subscribed or not, we encourage you to find out how to make the most of our alerts and read our replies to the most common alert-and-gold-trading-related-questions.
Please note that the in the trading section we describe the situation for the day that the alert is posted. In other words, it we are writing about a speculative position, it means that it is up-to-date on the day it was posted. We are also featuring the initial target prices, so that you can decide whether keeping a position on a given day is something that is in tune with your approach (some moves are too small for medium-term traders and some might appear too big for day-traders).
Plus, you might want to read why our stop-loss orders are usually relatively far from the current price.
Please note that a full position doesn't mean using all of the capital for a given trade. You will find details on our thoughts on gold portfolio structuring in the Key Insights section on our website.
As a reminder - "initial target price" means exactly that - an "initial" one, it's not a price level at which we suggest closing positions. If this becomes the case (like it did in the previous trade) we will refer to these levels as levels of exit orders (exactly as we've done previously). Stop-loss levels, however, are naturally not "initial", but something that, in our opinion, might be entered as an order.
Since it is impossible to synchronize target prices and stop-loss levels for all the ETFs and ETNs with the main markets that we provide these levels for (gold, silver and mining stocks - the GDX ETF), the stop-loss levels and target prices for other ETNs and ETF (among other: UGLD, DGLD, USLV, DSLV, NUGT, DUST, JNUG, JDST) are provided as supplementary, and not as "final". This means that if a stop-loss or a target level is reached for any of the "additional instruments" (DGLD for instance), but not for the "main instrument" (gold in this case), we will view positions in both gold and DGLD as still open and the stop-loss for DGLD would have to be moved lower. On the other hand, if gold moves to a stop-loss level but DGLD doesn't, then we will view both positions (in gold and DGLD) as closed. In other words, since it's not possible to be 100% certain that each related instrument moves to a given level when the underlying instrument does, we can't provide levels that would be binding. The levels that we do provide are our best estimate of the levels that will correspond to the levels in the underlying assets, but it will be the underlying assets that one will need to focus on regarding the signs pointing to closing a given position or keeping it open. We might adjust the levels in the "additional instruments" without adjusting the levels in the "main instruments", which will simply mean that we have improved our estimation of these levels, not that we changed our outlook on the markets. We are already working on a tool that would update these levels on a daily basis for the most popular ETFs, ETNs and individual mining stocks.
Our preferred ways to invest in and to trade gold along with the reasoning can be found in the how to buy gold section. Additionally, our preferred ETFs and ETNs can be found in our Gold & Silver ETF Ranking.
As a reminder, Gold & Silver Trading Alerts are posted before or on each trading day (we usually post them before the opening bell, but we don't promise doing that each day). If there's anything urgent, we will send you an additional small alert before posting the main one.
=====
Latest Free Trading Alerts:
Many people worry about the replay of the last economic crisis. But what if we look not in the direction from which the threat will come? What if we fight the last war? We invite you to read our today's article about the possibility that the endgame will not to be a 2008-style financial crisis, but a slow, painful and unstoppable zombification of the global economy. And find out how it would affect the gold market.
Smart Gold Investors Ask: Crisis or Zombification?
=====
Thank you.
Sincerely,
Przemyslaw Radomski, CFA
Editor-in-chief, Gold & Silver Fund Manager


