Briefly: in our opinion, full (300% of the regular position size) speculative short positions in junior mining stocks are justified from the risk/reward point of view at the moment of publishing this Alert.
Gold and silver are moving higher today, but nothing really changed despite that. Silver moved to its previous highs, while gold didn’t (chart courtesy of https://GoldPriceForecast.com).
Yes, the silver price is once again outperforming on a very short-term basis, and it makes the previous bearish indications stronger.
As a reminder, silver is much more popular with the investment public than gold is (relatively to how they are both popular with institutional buyers, that is), quite likely due to multiple theories surrounding its mispricing and also quite likely due to the fact that the silver market is much smaller than the gold market and big buyers can’t easily enter the silver market without moving its price too much.
Since the investment public tends to buy close to the tops (and sell close to the bottoms), silver’s outperformance relative to gold is what we often see as an indication that both precious metals are about to move lower.
Yes, there is some fundamental sense to PMs’ moving higher – China is ending its zero-COVID policy, which means some extra uncertainty for the markets, but overall, it’s unlikely to change that much.
Aside from the day-to-day price swings, the big picture for gold and the USD Index (one of gold’s price key drivers) should make it clear that whatever we have seen in the recent months was not bullish, but rather a regular correction within a medium-term downtrend.
The size of the recent short-term upswing may seem significant, but only until one zooms out and notices that the correction that we saw in 2008 was even bigger. It was then followed by a huge decline. I marked both rallies – the 2008 one and the current one – with green rectangles.
The 2008 correction ended with gold above its 40- and 60-week moving averages. That’s where gold has moved recently as well.
Why would the current situation be similar? In both cases, there is major trouble ahead for the stock market due to tighter financial conditions. Back in 2008, it was the subprime crisis that started it all, and while the circumstances were different this time, interest rates (nominal and real) are now on the rise (globally!), which is likely to contribute to people's rapidly decreasing motivation to hold anything that doesn't provide interest or a decent yield. Also, speaking of the big picture, did you notice that gold is NOT above its 2011 high despite so many dollars, euros, yen, and other currencies being printed since that time? Gold is not above its 2011 high even thiugh there’s now a war in Europe!
Silver is not even trading at half of the value that it had at its 2011 top…
And gold stocks… The HUI Index is trading below its 2003 (yes!) high.
All these are not signs of a strong market. Conversely, these are indications that the precious metals market wants to move lower in the following months, and (probably) weeks.
While the precious metals sector doesn’t need a specific trigger to decline, getting one would speed up the decline, and it seems that it’s about to get one from the USD Index.
The USDX moved to its 2016 and 2020 highs and is now trading slightly above them. It’s normal for any market to verify breakouts by moving back to the previously broken levels, before the main move continues. Consequently, it’s no wonder that the USD Index did exactly that.
It’s also normal that the recent corrective downswing was sharp – because that’s how the preceding rally was, too.
As very strong support was reached, the USD Index is now likely to rally once again. Since the USDX and the precious metals market tend to move in opposite directions, it implies lower precious metals values in the future, and it seems that we won’t have to wait too long, either.
Having said that, let’s take a look at the markets from a more fundamental point of view.
Is Gold’s Festive Season About to End?
With risk assets looking to end 2022 on a high note, gold, silver, mining stocks and the S&P 500 rallied on Dec. 23. However, with sentiment shifting after each economic release, the recent results support a higher U.S. federal funds rate (FFR) in 2023.
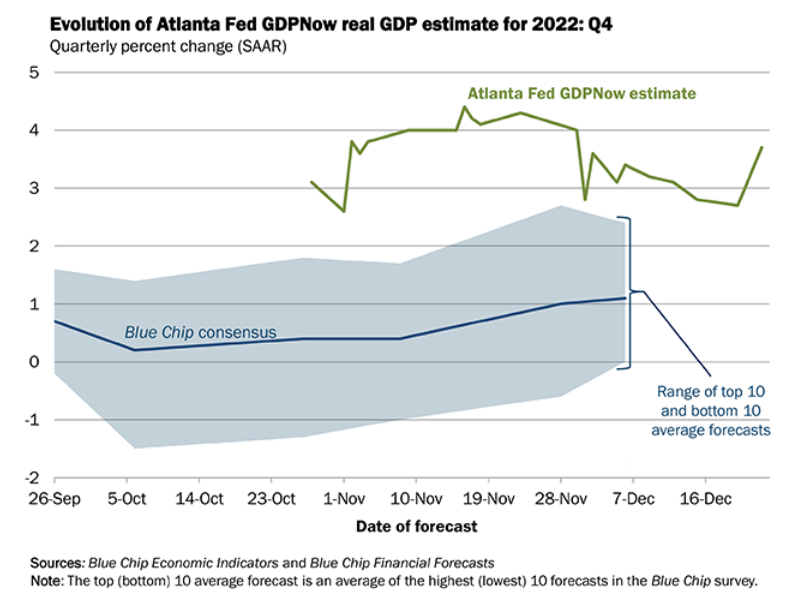
For example, the Atlanta Fed updated its fourth-quarter real GDP growth estimate on Dec. 23; and with the projection remaining resilient, more hawkish policy should commence in the months ahead. The report stated:
“The GDPNow model estimate for real GDP growth (seasonally adjusted annual rate) in the fourth quarter of 2022 is 3.7 percent on December 23, up from 2.7 percent on December 20 (…). The nowcasts of fourth-quarter real personal consumption expenditures growth and fourth-quarter real gross private domestic investment growth increased from 3.4 percent and -0.2 percent, respectively, to 3.6 percent and 3.8 percent, respectively.”
Please see below:
To explain, the green line above tracks the Atlanta Fed’s Q4 real GDP growth estimate, while the blue line above tracks the Blue Chip consensus estimate (investment banks). If you analyze the right side of the chart, you can see that the green line remains relatively elevated, given that U.S. real GDP growth tracked near 2% pre-pandemic.
As a result, with inflation highly problematic and economic growth far from crisis levels, the FFR should continue its ascent and accelerate the liquidity drain.
To that point, while inflation slowed in November due to the decline in asset prices that occurred in September/October, the Personal Consumption Expenditures (PCE) Index met expectations on Dec. 23.
But, while the crowd views the development as bullish, they miss the forest through the trees. We warned on numerous occasions that rampant wage inflation is the hawkish canary in the coal mine. In a nutshell: wage inflation drives output inflation because Americans can afford price increases that match their salary increases.
Yet, with wage inflation re-accelerating in November, while asset prices declined in September/October, it created the perfect backdrop for a rise in real (inflation-adjusted) incomes.
Please see below:
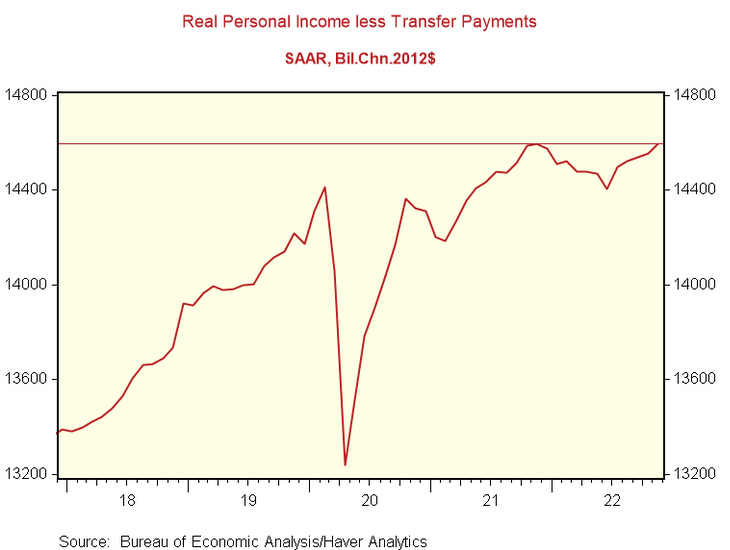
To explain, the red line above tracks consolidated real income minus transfer payments (government benefits). For context, the metric measures the change in Americans’ inflation-adjusted incomes after removing the impact of social security benefits, state pensions, unemployment benefits, etc.
If you analyze the right side of the chart, you can see that the red line has risen in recent months and has been running at an annualized rate of 3.2% since June.
So, with wage inflation outperforming output inflation recently, Americans’ real spending power has increased, which supports more discretionary purchases in the months ahead. Thus, the fundamentals are bullish for the FFR, real yields and the USD Index, and the crowd underestimates the resiliency of demand.
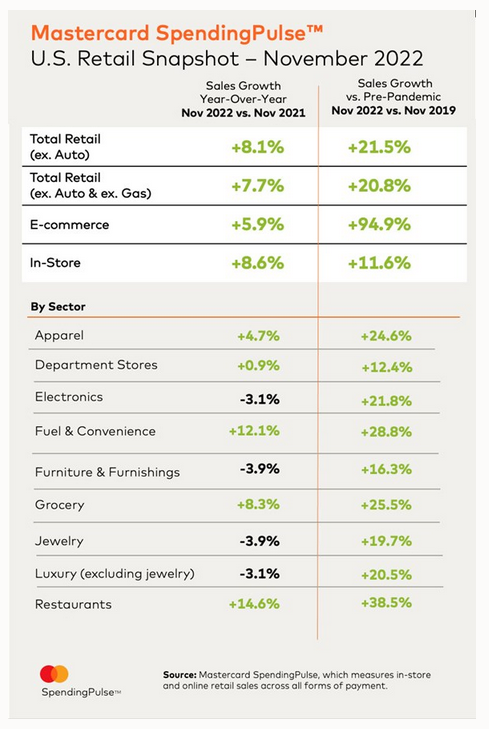
Speaking of which, Mastercard released its SpendingPulse U.S. retail sales report on Dec. 9. An excerpt read:
“U.S. retail sales excluding automotive were up +8.1% year-over-year (YoY) in November. E-commerce sales were up +5.9% YoY while in-store sales were up +8.6% YoY.”
As such, while consumer spending remains robust relative to its pre-pandemic level (the right column), it’s also highly resilient versus November 2021 (the left column). Therefore, the economic pain that spurs dovish pivots is largely non-existent.
Please see below:
To that point, while the FOMC reiterated its hawkish commitment on Dec. 14, the Bank of Canada (BoC) decided to adopt a wait-and-see approach. Although, we warned on Dec. 8 that the fundamentals do not support a pause anytime soon. We wrote:
While the BoC cited “excess demand” and “unemployment near historic lows,” and in the next breath, questioned “whether the policy interest rate needs to rise further,” the contradiction highlights the conundrum confronting North American central banks. With some areas of their economies running too hot, while others are too cold, they want to have their cake and eat it too.
However, the reality is that supporting growth encourages inflation, and history shows the gambit ends in a recession regardless of what they do; and while the BoC (and maybe the Fed next week) thinks the overnight lending rate could peak at 4.25%, we believe the central bank materially underestimates the challenges that lie ahead.
Likewise, with the recent data coming in hotter than expected, this Bloomberg headline from Dec. 23 is another example of the crowd's fallibility; and while the consensus peak FFR (and Canada's overnight lending rate) expectation has risen from 3% to 5% (4.25% in Canada), demand destruction has not materialized to the extent required to reduce inflation.
Please see below:
Finally, while the PMs have ignored the development, the U.S. 10-Year real yield has been on fire in December. After completing its consolidation and hitting a countertrend low of 1.08% on Dec. 2, the metric has soared by 47 basis points and ended the Dec. 23 session at 1.55%. Furthermore, it’s only 19 basis points away from its 2022 high of 1.74%, so gold is ignoring the ominous development at its own peril.
Overall, bullish seasonality has investors prioritizing sentiment, while history shows that normalizing unanchored inflation results in profound economic pain. Moreover, the crowd assumes that interest rates have peaked, corporate profits will stay elevated and inflation will magically disappear with little help from the other two (higher interest rates and lower corporate profits). But, their expectations contrast history and fundamental logic, and a profound wake-up call should occur in 2023.
Is Silver Blind to the Ramifications of Higher Interest Rates?
While investors are eager to turn the page on 2022, the fundamental issues that plagued the white metal haven't abated. Conversely, the coming New Year has elicited hopes of a more prosperous outcome, with disinflation and a more dovish Fed viewed as catalysts for further gains.
Yet, we've warned repeatedly that a major decline in U.S. GDP growth and the labor market are required for a dovish 180; and with economic output revised higher twice in Q3, and tracking north of 3% in Q4, the fundamental backdrop supports higher, not lower, interest rates.
Also, with resilient employment still far from the levels required to normalize wage inflation, continued hiring only strengthens the case for a higher FFR in 2023.
For example, S&P Global released its U.S. Composite PMI on Dec. 16; and while the headline index declined from 46.4 in November to 44.6 in December, the report stated:
“Private sector hiring remained subdued in December. Employment rose only marginally as manufacturers signaled broadly unchanged workforce numbers on the month and service sector hiring slipped lower to register only a modest gain.”
Remember, while the results are far from celebratory, modest employment gains are bullish for the FFR because the Fed needs employment to contract to reduce wage inflation. In contrast, U.S. firms are still increasing their headcount, which intensifies the imbalance between labor demand and supply.
Consequently, it’s no wonder why the Atlanta Fed’s Wage Growth Tracker and the U.S. Bureau of Labor Statistics' (BLS) average hourly earnings metric both re-accelerated in November; and the longer this persists, the more it supports a higher peak FFR.
In addition, the New York Fed released its Empire State Manufacturing Survey on Dec. 15. The headline index decreased from 4.5 in November to -11.2 in December. However, an excerpt read:
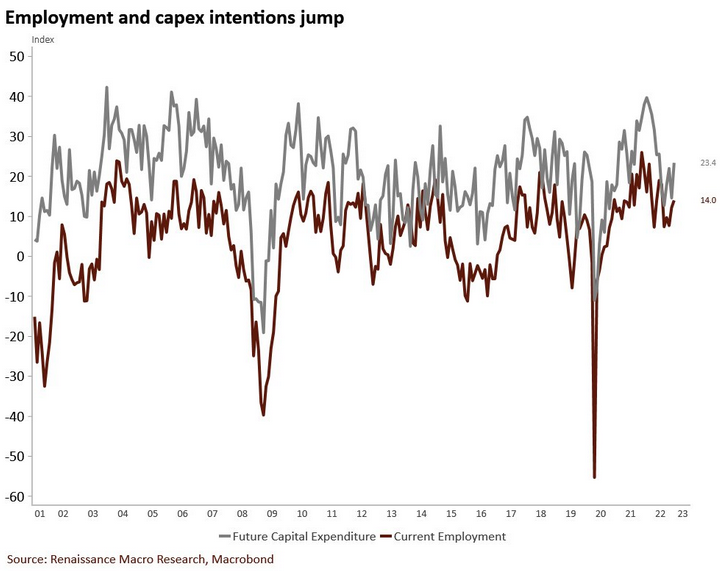
“Despite the overall decline in activity, the index for number of employees edged up to 14.0, marking another month of employment gains…. The pace of price increases was little changed, with the prices paid index holding steady at 50.5 and the prices received index remaining similar to last month’s level at 25.2.”
As a result, while inflation held steady, employment increased alongside intentions for future capital spending.
Please see below:
To explain, the brown line above tracks the New York Fed’s employment index, while the gray line above tracks the expectations index for future capital expenditures. If you analyze the right side of the chart, you can see that both metrics rose in December and are far from the troughs set during the 2001, 2008 and 2020 recessions.
For context, capital expenditures are investments in plant, property and equipment (PP&E) with a shelf life of more than one year. Furthermore, companies do not expand their cap-ex spending if they expect demand to fall off a cliff.
Also noteworthy, the Philadelphia Fed released its Manufacturing Business Outlook Survey on Dec. 15. The headline index increased from -19.8 in November to -13.8 in December. Moreover, while the inflation and employment indexes both declined, this month's “special questions” were highly revealing.
For example, the results showed that Philadelphia manufacturers are producing more now than in Q4 2021.
Please see below:
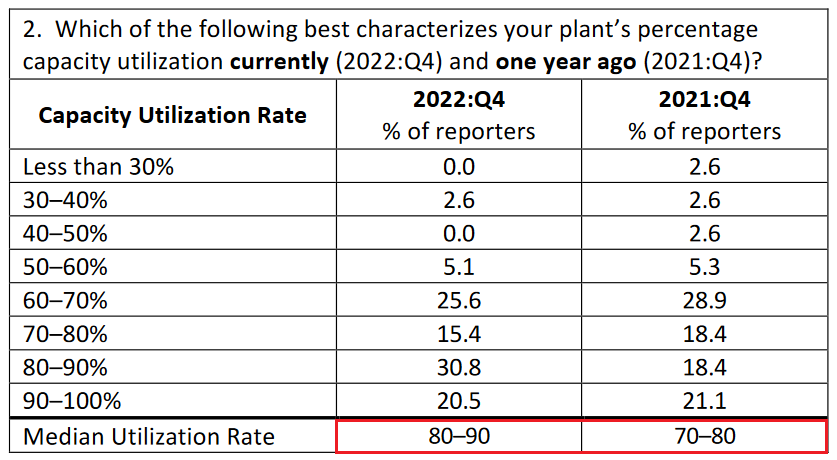
To explain, when respondents were asked to contrast their current capacity utilization rate with Q4 2021, the median figure increased from 70%-80% to 80%-90% (the red box above).
For context, the rate measures Philadelphia manufacturers’ actual output as a percentage of their potential output; and with more firms ramping up production in 2022, their operations have increased YoY. Likewise, with the current figure still below 100%, there is more room for future growth in the months ahead. As a result, the Fed’s 17 25 basis point rate hikes in 2022 have not capsized demand enough to reduce inflation.
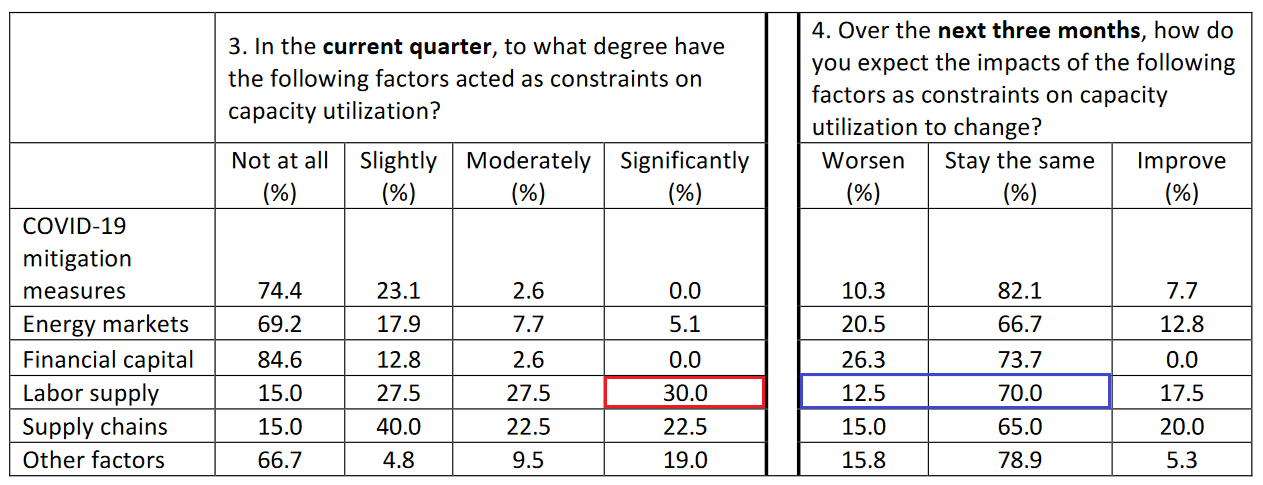
As further evidence, when asked about why their firms are operating below 100% capacity, a lack of labor supply was the primary driver.
Please see below:
To explain, the red box above shows that 30% of respondents cited labor supply as a significant constraint to their capacity utilization. Moreover, a consolidated 85% labeled it a slight, moderate or significant problem.
In addition, the blue box above shows that 82.5% of respondents expect the problem to remain constant or worsen over the next three months. Consequently, the findings are bullish for wage inflation, and highlight how these firms could increase their revenues if more employees were available. Therefore, the data continues to support our medium-term fundamental outlook.
But, what does all of this have to do with silver?
Well, the trajectory of wage inflation will impact the FFR. With Americans’ checking account balances at unprecedented record highs, the supply/demand imbalance in the U.S. labor market only enhances their spending power; and as long as consumers remain resilient, the lack of demand destruction will keep wage and output inflation from normalizing.
Remember, ~70% of the U.S. economy is driven by consumer spending; and when companies are fighting for employees to meet demand, the Fed will continue to see unwanted economic strength, and the FFR will need to rise much higher.
Overall, the silver price has decoupled from the fundamentals, as the crowd assumes a pivot is a done deal in 2023. Although, the data contrasts that narrative, and investors should be surprised by the lengths the Fed has to go to win its inflation fight. So, while the S&P 500 may consolidate in the short term, profound declines should confront risk assets over the medium term.
The Bottom Line
Seasonality has the bulls in the driver’s seat, and low liquidity often culminates with asset managers attempting to pump prices higher in the final days of the year to increase their annual performance. However, both are irrelevant from a medium-term perspective, and cheerful sentiment can’t eliminate inflation or keep the U.S. from entering a recession. As such, while the crowd is happy to ignore the fundamentals right now, we saw this movie several times in 2022, and it didn’t end well for the dip buyers.
In conclusion, the PMs rallied on Dec. 23, as the last chance for a Santa Clause rally has commenced. But, while gold, silver and mining stocks ignore the developments, the U.S. 10-Year real yield has quietly soared in December, while the Fed’s balance sheet hit a new 2022 low last week. As a result, the liquidity drain continues to intensify, and it’s likely only a matter of time before risk assets feel the pain.
Overview of the Upcoming Part of the Decline
- It seems to me that the corrective upswing is over (or about to be over) and that the next big move lower is already underway (or that it’s about to start).
- If we see a situation where miners slide in a meaningful and volatile way while silver doesn’t (it just declines moderately), I plan to – once again – switch from short positions in miners to short positions in silver. At this time, it’s too early to say at what price levels this could take place and if we get this kind of opportunity at all – perhaps with gold prices close to $1,500 - $1,550.
- I plan to switch from the short positions in junior mining stocks or silver (whichever I’ll have at that moment) to long positions in junior mining stocks when gold / mining stocks move to their 2020 lows (approximately). While I’m probably not going to write about it at this stage yet, this is when some investors might consider getting back in with their long-term investing capital (or perhaps 1/3 or 1/2 thereof).
- I plan to return to short positions in junior mining stocks after a rebound – and the rebound could take gold from about $1,450 to about $1,550, and it could take the GDXJ from about $20 to about $24. In other words, I’m currently planning to go long when GDXJ is close to $20 (which might take place when gold is close to $1,450), and I’m planning to exit this long position and re-enter the short position once we see a corrective rally to $24 in the GDXJ (which might take place when gold is close to $1,550).
- I plan to exit all remaining short positions once gold shows substantial strength relative to the USD Index while the latter is still rallying. This may be the case with gold prices close to $1,400 and GDXJ close to $15 . This moment (when gold performs very strongly against the rallying USD and miners are strong relative to gold after its substantial decline) is likely to be the best entry point for long-term investments, in my view. This can also happen with gold close to $1,400, but at the moment it’s too early to say with certainty.
- The above is based on the information available today, and it might change in the following days/weeks.
You will find my general overview of the outlook for gold on the chart below:
Please note that the above timing details are relatively broad and “for general overview only” – so that you know more or less what I think and how volatile I think the moves are likely to be – on an approximate basis. These time targets are not binding nor clear enough for me to think that they should be used for purchasing options, warrants, or similar instruments.
Letters to the Editor
We received a few messages over e-mail, but as we are moving to our new platform, we will be transferring them below the articles as comments – and that’s where we’ll be replying to them.
Asking your questions below the articles or in the spaces called “Ask the Community” or “Position Sizes” directly will help us deliver a reply sooner. In some cases, someone from the community might reply and help even before we do.
Please remember about the Pillars of our Community, especially about the Kindness of Speech Pillar.
Also, if there’s anything that you’re unhappy with, it’s best to send us a message at [email protected].
Please note that this section is going to go away within the next 1-8 weeks, as you can add comments/questions below the article on Golden Meadow – the platform that we’re using to provide our analyses. Your notification e-mails include an invitation link that allows you to access the “Gold Trading Alerts” space.
Also, if you haven’t had the chance to see the video, in which I’m talking about the new platform and why we essentially moved from Sunshine Profits to Golden Meadow, I strongly encourage you to do so:
Summary
Summing up, it seems that the major bottom in the USD Index is in, while the correction in stocks, gold, silver, and mining stocks is over.
The nature of the recent corrections was mostly technical and rumor-based. The rumor was that the Fed would be making a dovish U-turn soon, and it recently became clear that this was not going to be the case. Consequently, the corrective upswing is likely to be reversed, and medium-term downtrends are likely to resume.
In my opinion, the current trading position is going to become profitable in the following weeks, and quite possibly in the following days. And while I can’t promise any kind of performance, I fully expect it to become very profitable before it’s over and to prolong our 2022 winning streak.
After the final sell-off (that takes gold to about $1,350-$1,500), I expect the precious metals to rally significantly. The final part of the decline might take as little as 1-5 weeks, so it's important to stay alert to any changes.
As always, we'll keep you – our subscribers – informed.
To summarize:
Trading capital (supplementary part of the portfolio; our opinion): Full speculative short positions (300% of the full position) in junior mining stocks are justified from the risk to reward point of view with the following binding exit profit-take price levels:
Mining stocks (price levels for the GDXJ ETF): binding profit-take exit price: $20.32; stop-loss: none (the volatility is too big to justify a stop-loss order in case of this particular trade)
Alternatively, if one seeks leverage, we’re providing the binding profit-take levels for the JDST (2x leveraged). The binding profit-take level for the JDST: $22.87; stop-loss for the JDST: none (the volatility is too big to justify a SL order in case of this particular trade).
For-your-information targets (our opinion; we continue to think that mining stocks are the preferred way of taking advantage of the upcoming price move, but if for whatever reason one wants / has to use silver or gold for this trade, we are providing the details anyway.):
Silver futures downside profit-take exit price: $14.32
SLV profit-take exit price: $13.42
ZSL profit-take exit price: $48.87
Gold futures downside profit-take exit price: $1,504
HGD.TO – alternative (Canadian) 2x inverse leveraged gold stocks ETF – the upside profit-take exit price: $16.47
HZD.TO – alternative (Canadian) 2x inverse leveraged silver ETF – the upside profit-take exit price: $36.87
Long-term capital (core part of the portfolio; our opinion): No positions (in other words: cash)
Insurance capital (core part of the portfolio; our opinion): Full position
Whether you’ve already subscribed or not, we encourage you to find out how to make the most of our alerts and read our replies to the most common alert-and-gold-trading-related-questions.
Please note that we describe the situation for the day that the alert is posted in the trading section. In other words, if we are writing about a speculative position, it means that it is up-to-date on the day it was posted. We are also featuring the initial target prices to decide whether keeping a position on a given day is in tune with your approach (some moves are too small for medium-term traders, and some might appear too big for day-traders).
Additionally, you might want to read why our stop-loss orders are usually relatively far from the current price.
Please note that a full position doesn't mean using all of the capital for a given trade. You will find details on our thoughts on gold portfolio structuring in the Key Insights section on our website.
As a reminder - "initial target price" means exactly that - an "initial" one. It's not a price level at which we suggest closing positions. If this becomes the case (as it did in the previous trade), we will refer to these levels as levels of exit orders (exactly as we've done previously). Stop-loss levels, however, are naturally not "initial", but something that, in our opinion, might be entered as an order.
Since it is impossible to synchronize target prices and stop-loss levels for all the ETFs and ETNs with the main markets that we provide these levels for (gold, silver and mining stocks - the GDX ETF), the stop-loss levels and target prices for other ETNs and ETF (among other: UGL, GLL, AGQ, ZSL, NUGT, DUST, JNUG, JDST) are provided as supplementary, and not as "final". This means that if a stop-loss or a target level is reached for any of the "additional instruments" (GLL for instance), but not for the "main instrument" (gold in this case), we will view positions in both gold and GLL as still open and the stop-loss for GLL would have to be moved lower. On the other hand, if gold moves to a stop-loss level but GLL doesn't, then we will view both positions (in gold and GLL) as closed. In other words, since it's not possible to be 100% certain that each related instrument moves to a given level when the underlying instrument does, we can't provide levels that would be binding. The levels that we do provide are our best estimate of the levels that will correspond to the levels in the underlying assets, but it will be the underlying assets that one will need to focus on regarding the signs pointing to closing a given position or keeping it open. We might adjust the levels in the "additional instruments" without adjusting the levels in the "main instruments", which will simply mean that we have improved our estimation of these levels, not that we changed our outlook on the markets. We are already working on a tool that would update these levels daily for the most popular ETFs, ETNs and individual mining stocks.
Our preferred ways to invest in and to trade gold along with the reasoning can be found in the how to buy gold section. Furthermore, our preferred ETFs and ETNs can be found in our Gold & Silver ETF Ranking.
As a reminder, Gold & Silver Trading Alerts are posted before or on each trading day (we usually post them before the opening bell, but we don't promise doing that each day). If there's anything urgent, we will send you an additional small alert before posting the main one.
Thank you.
Przemyslaw K. Radomski, CFA
Founder, Editor-in-chief


