- Euro & USD Indices
- General Stock Market
- Gold
- Silver
- Mining Stocks
- Letters from Subscribers
- Gold and silver in Dec 2013 and Apr 2014
- Large positions shifting on Comex
- When to purchase gold in India
- Long-term investments and stop-loss orders
- Summary
There was no Premium Update last week, but so much happened in the recent days that we decided to post an extra update today (the next one will be posted on Friday, later this week, and meanwhile we’ll keep you updated via Market Alerts).
Let’s take a look at what happened on the precious metals market and on other key markets – USD Index, Euro Index and the S&P 500.
Let’s start with USD Index chart (charts courtesy by http://stockcharts.com).
USD and Euro Indices
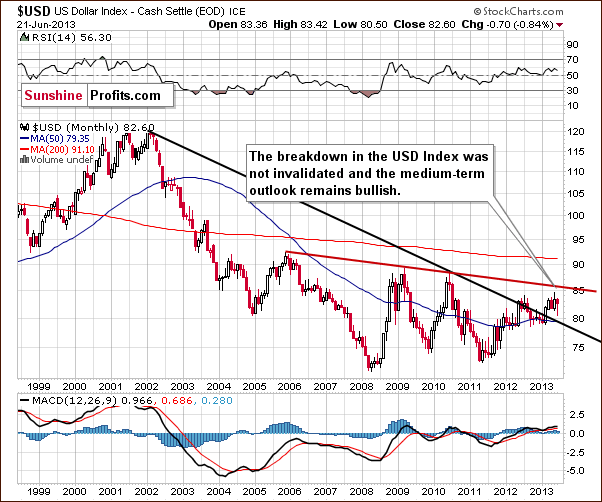
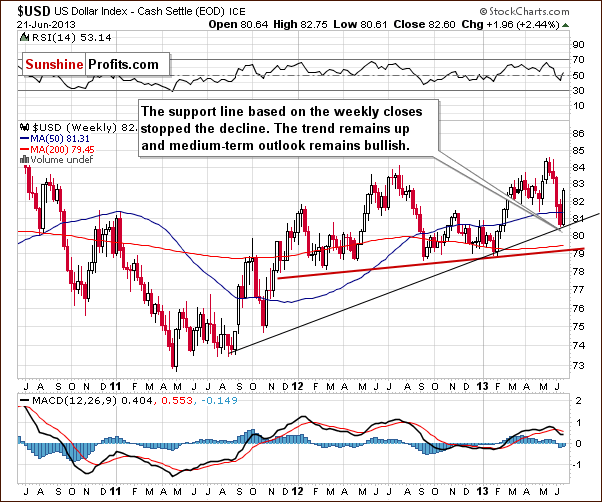
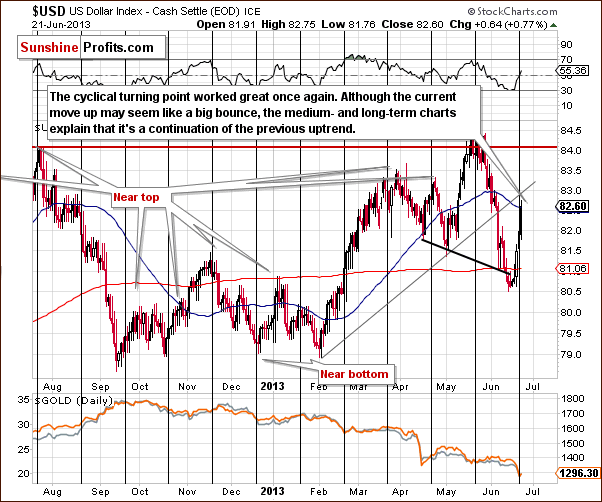
From the short-term perspective, last week’s sharp upswing seems to be a counter-trend bounce. Taking a look at medium- and long-term charts, however, reveals that it was actually the previous decline that was a counter-trend pullback. Consequently, even though we could see a small pause here, we can expect the dollar to strengthen further in the coming weeks. The next significant resistance is visible on the long-term chart (declining red line) and it’s currently close to 86 (86.4).
The dollar rallied about 2 index points and gold declined approximately $100 during that time. If the current strength of reaction persists and we see a move to 86.4 in the USD Index (about 3.8 index points higher), then gold could decline another $190 or so – this would mean a move to $1,100.
Of course gold could stop reacting to the dollar’s strength or the strength of reaction could diminish – and it would serve as a bullish indication – but it’s not the case just yet.
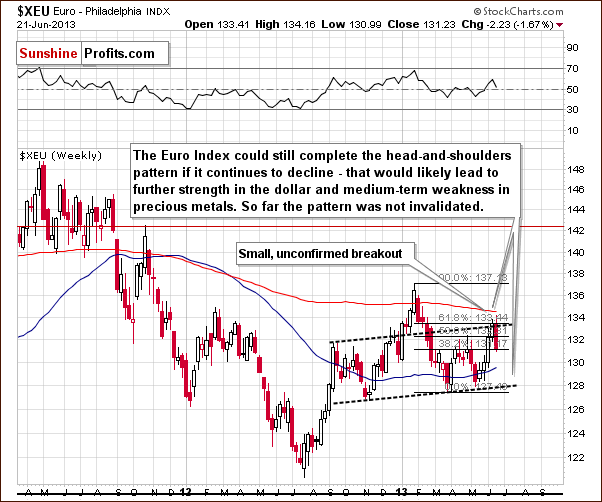
In the latest Premium Update we wrote that the bearish head-and-shoulders pattern could still be completed, and this is still the case. The implications are bearish for precious metals.
Summing up, gold declined significantly, but the USD Index didn’t “rally enough” in our view. If it continues to rally – which seems very likely – we will either see gold declining (the more likely outcome) or we will see it stop responding to dollar’s strength (which would tell us that the final bottom would very likely be in).
General Stock Market
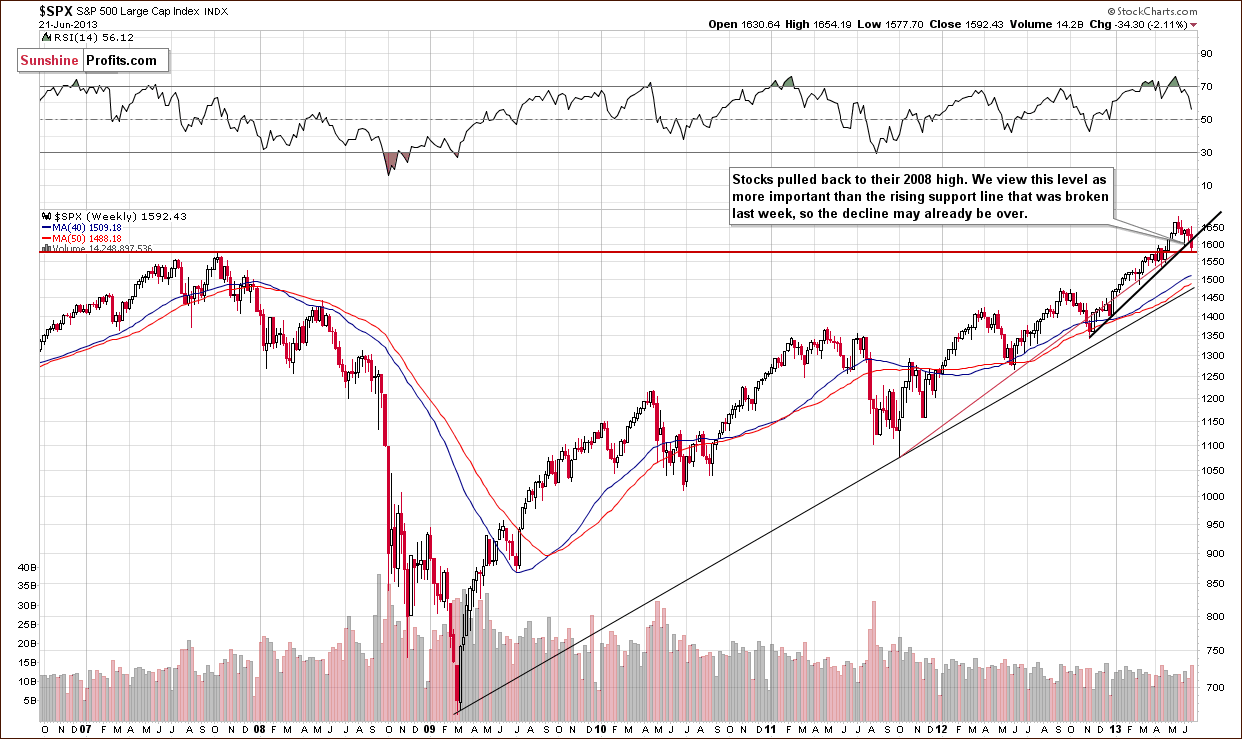
The decline took stocks to their 2008 high, which might have already stopped the decline. The medium-term outlook remains bullish in our view. In the short run stocks moved lower along with gold, but they have been negatively correlated recently, so if gold continues to be the anti-asset, we will see it move lower.
Gold
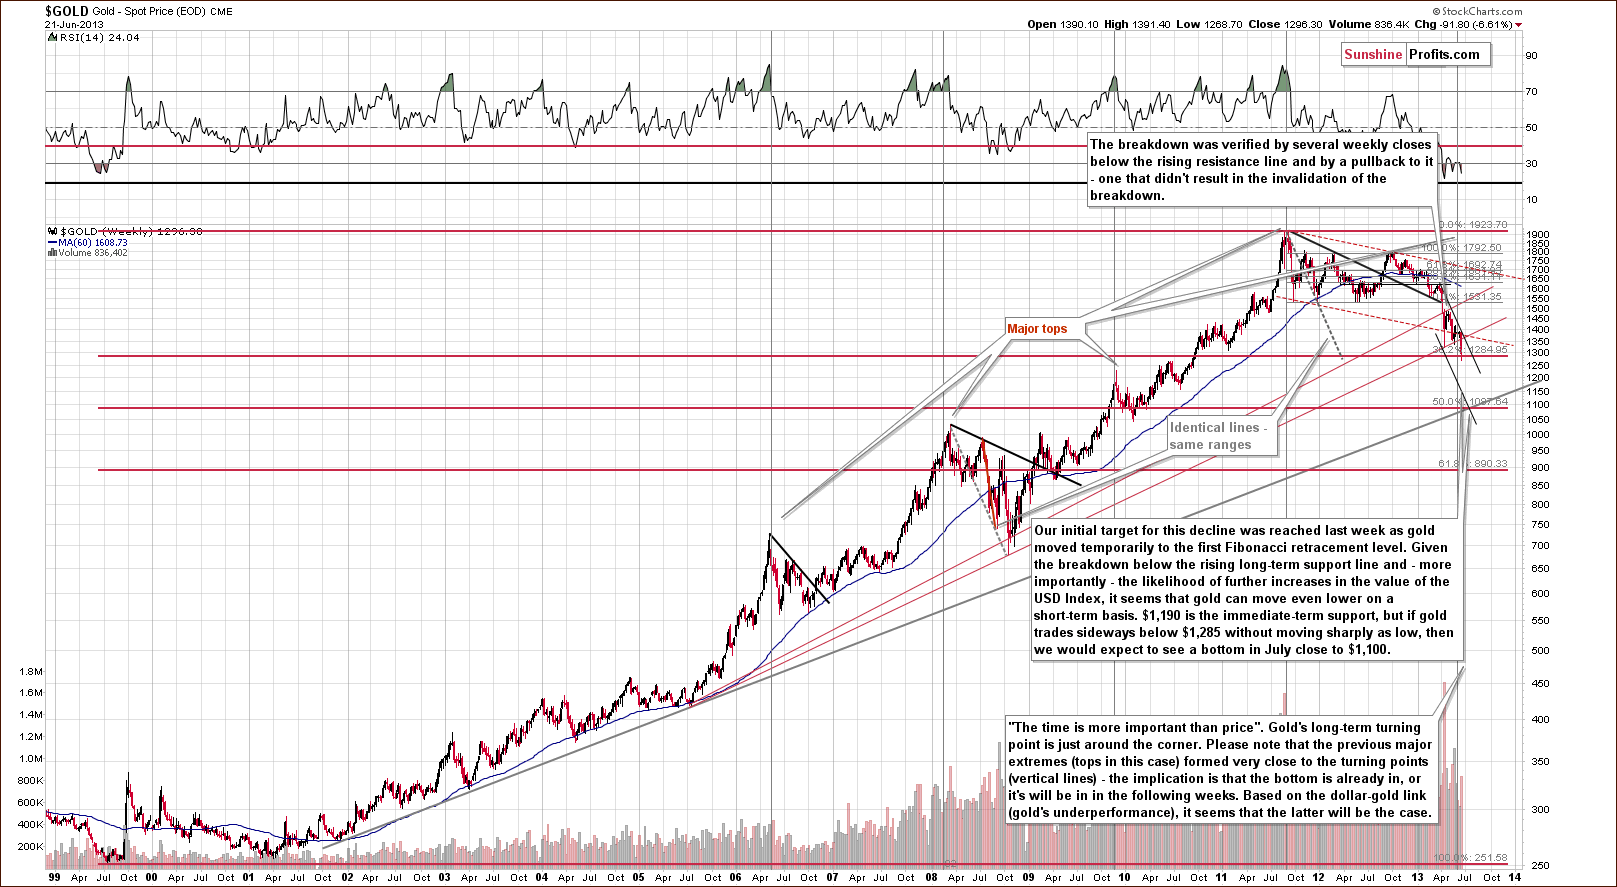
Basically, the key comment here is in the middle text box on the chart above. The $1,100 was one of our targets for many weeks, but we initially thought that it would not be reached and that gold would stop at the current price level.
What has changed? Fundamentally: another margin hike (more on that in the Letters section) and the increased possibility of the termination or limitation of QE. Technically, 2 most important factors include: gold’s extreme underperformance relative to the USD Index, the lack of extreme underperformance in case of silver so far.
If gold drops suddenly to the lower border of the declining trend channel (currently at $1,190) then we will likely see a pullback shortly thereafter. If, however, it consolidates and then moves lower, we expect it to bottom around $1,100. Note that it corresponds with what we wrote when discussing the gold-USD link below the USD charts earlier in this update.
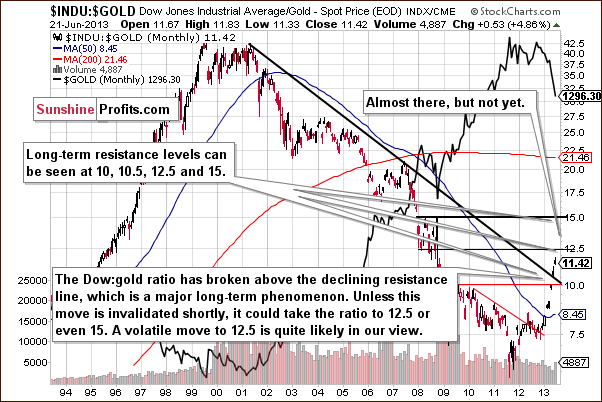
The ratio moved higher, but it didn’t move to the 12.5 level, which could stop the rally. It’s not guaranteed, though. We could see the ratio move as high as 15 before gold truly bottoms.
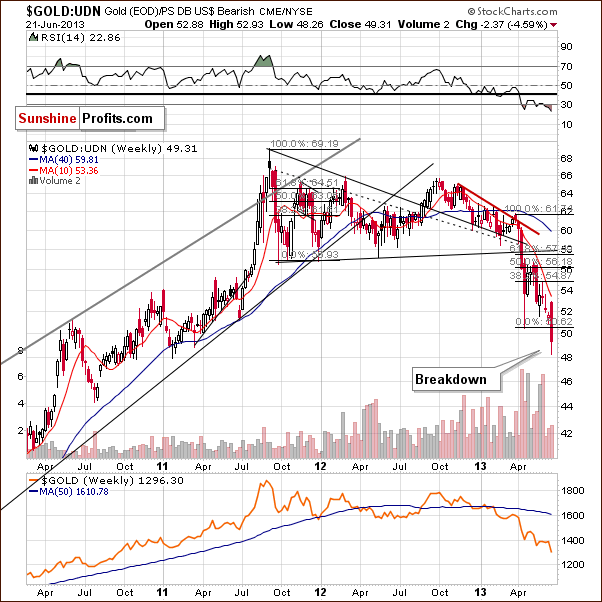
We also just saw a breakdown in case of gold seen from the non-USD perspective, which serves as a bearish confirmation.
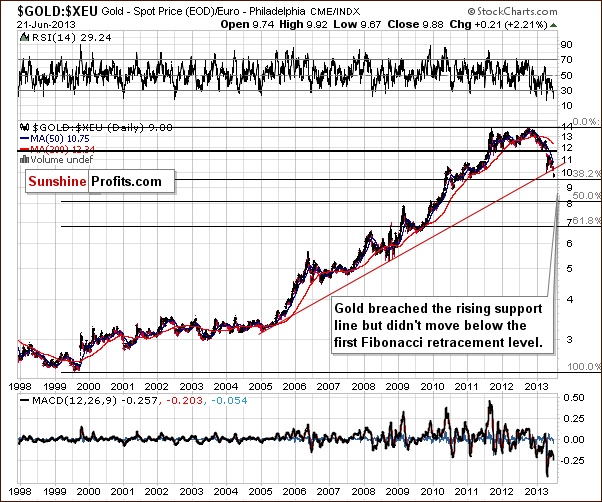
Taking a long-term perspective allows us to see that we had a breakdown below a long-term support line. The first Fibonacci retracement level may stop the decline, but it currently seems to us that gold will need to move even lower before the final bottom is formed – the next Fibonacci retracement – 50% - becomes our next target.
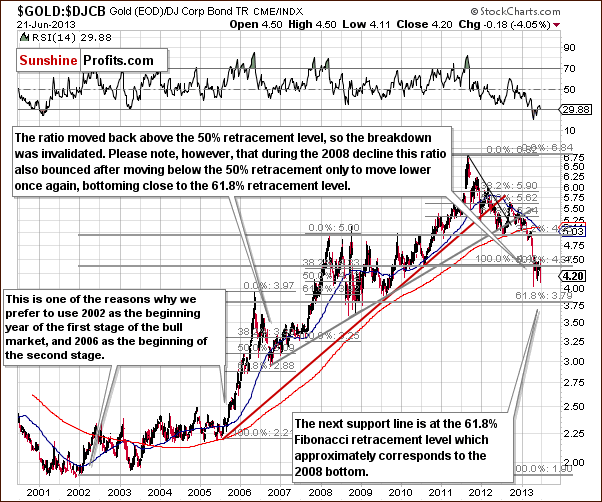
The gold-to-bonds ratio seems to have finished consolidating after moving below the 50% Fibonacci retracement level. Gold could decline when the ratio moves to the 61.8% retracement.
Summing up, the outlook for gold remains bearish and $1,100 is our current target. We will keep monitoring the situation and will report to you when the above changes.
Silver
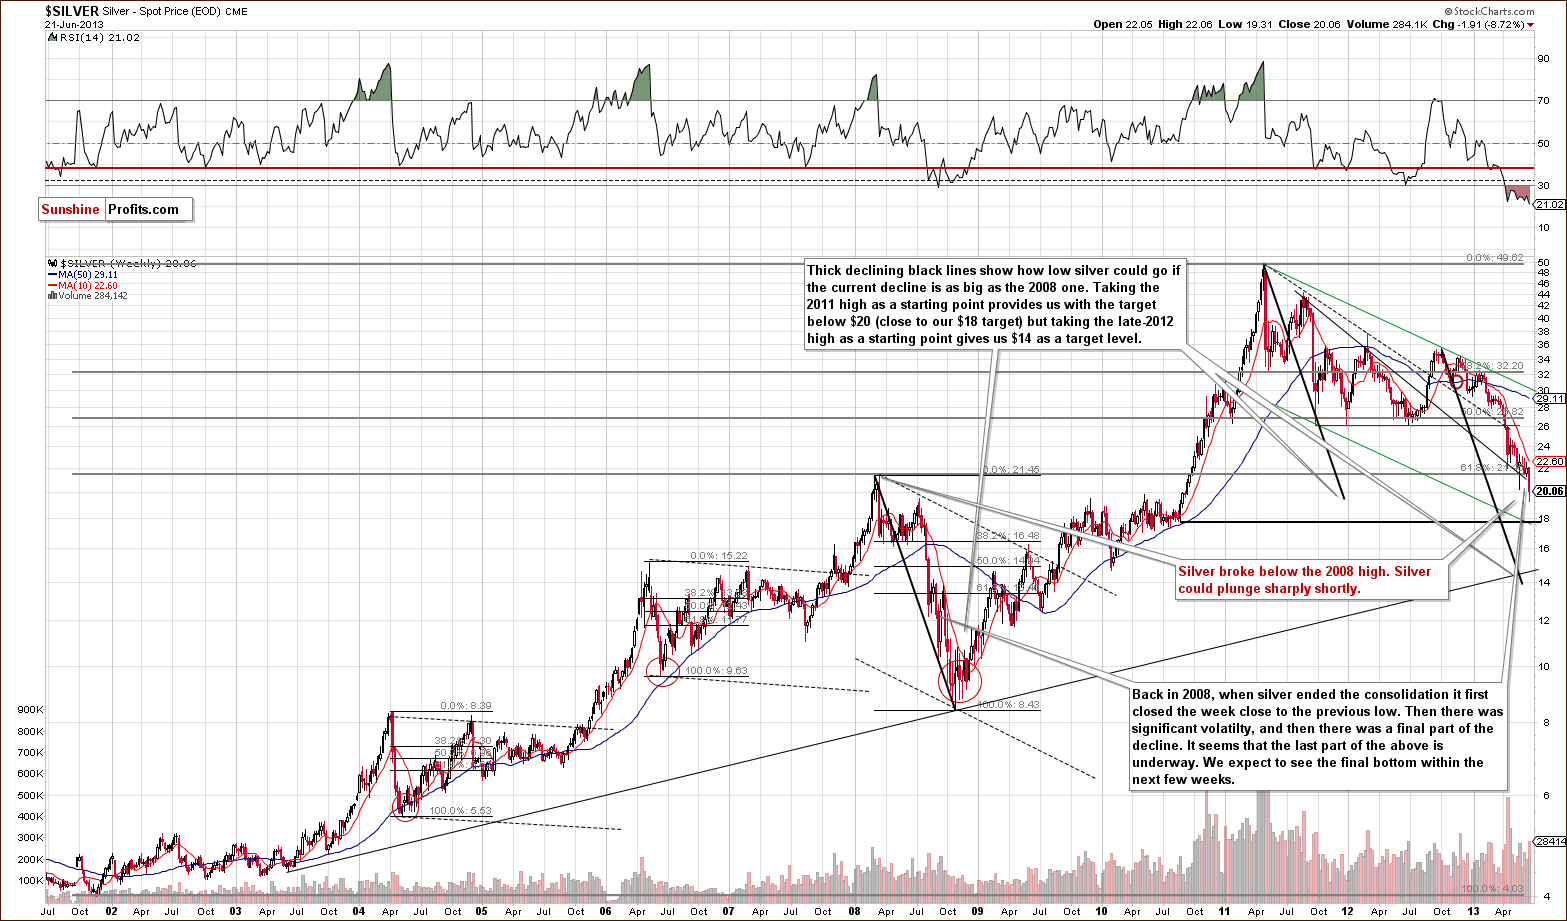
Silver broke below the 2008 high, which makes the situation bearish for the short term (and it will become even more bearish if the breakdown is confirmed by 3 consecutive daily closes below this level).
The silver-to-gold ratio doesn’t suggest that the decline is over.
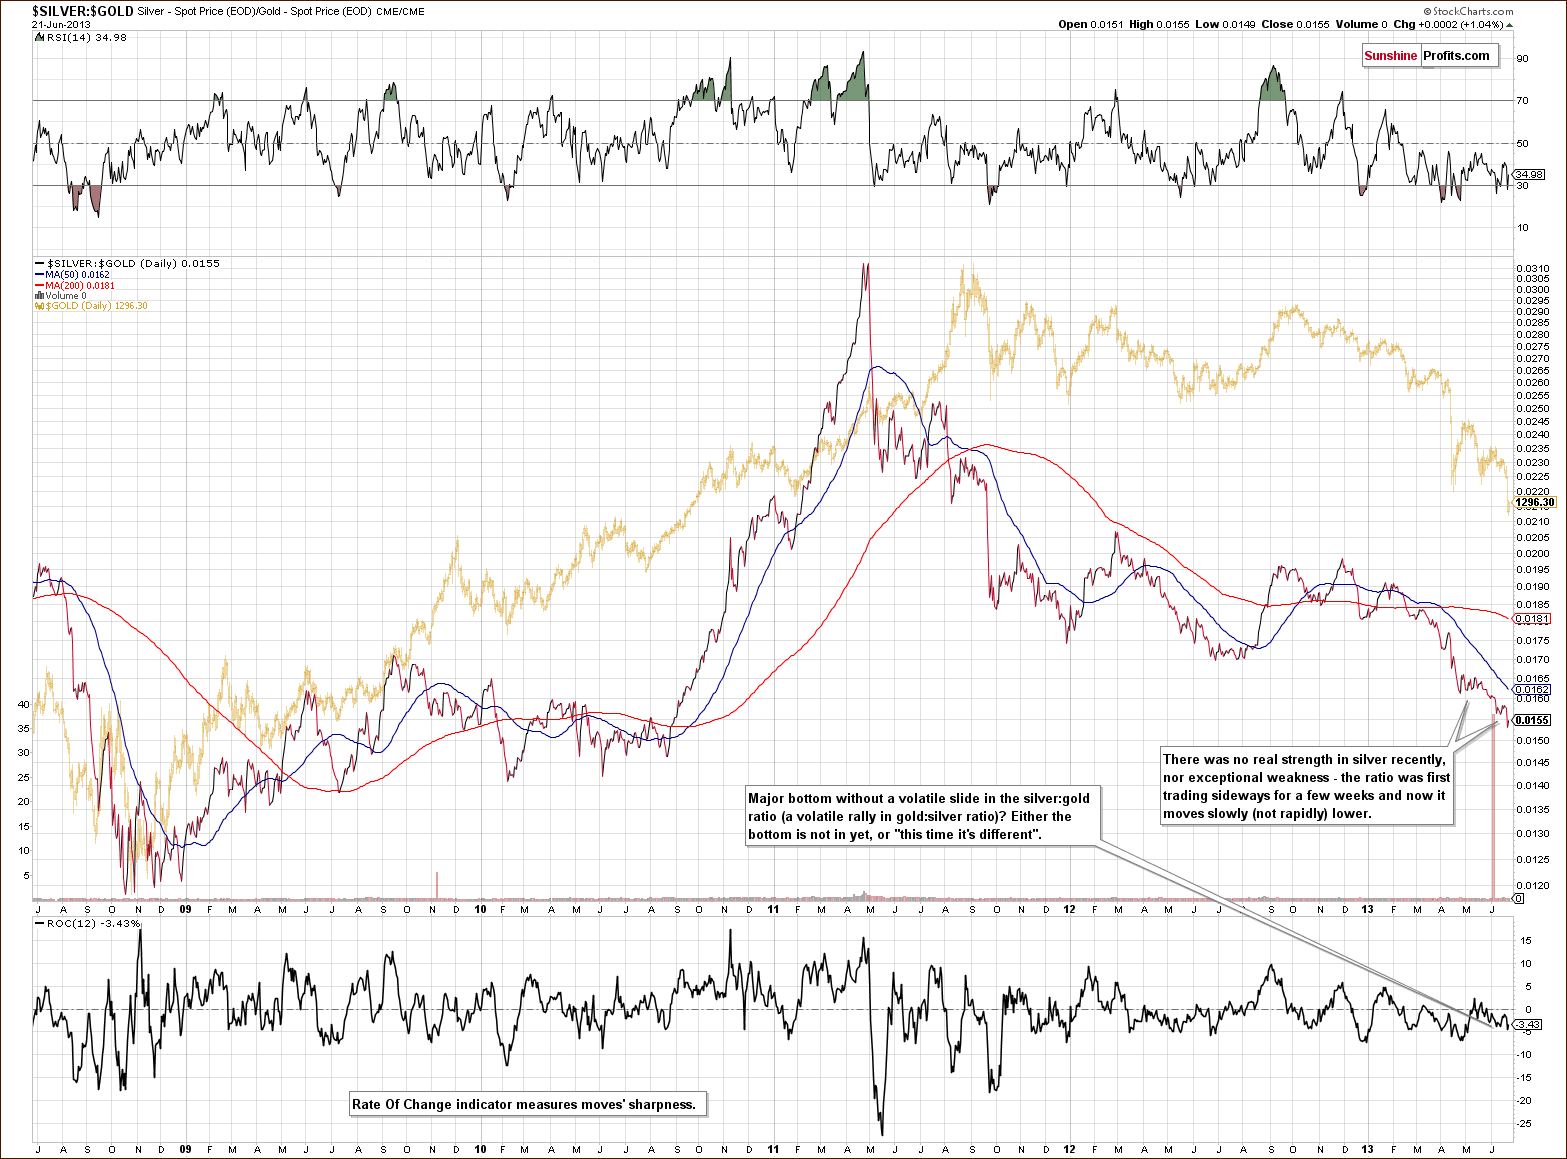
As you’ve read in the previous updates, we expect the bottom to be confirmed by significant underperformance of silver accompanied by a sharp drop in the silver to gold ratio. We have yet to see this signal.
Connecting the dots… If gold is going to decline by another $190 or so and are going to see silver underperform in a rapid manner, then silver is likely to plunge below $16.80. The closest strong support level below $16.80 is the lowest one seen on the silver chart – the long-term support line. It’s currently close to $14.70. We realize that it’s very low and perhaps even ridiculous given that silver was trading close to $50 just a few years ago and given that it’s likely to move above $50 in the coming years, but that seems to be a likely outcome.
Gold and Silver Mining Stocks
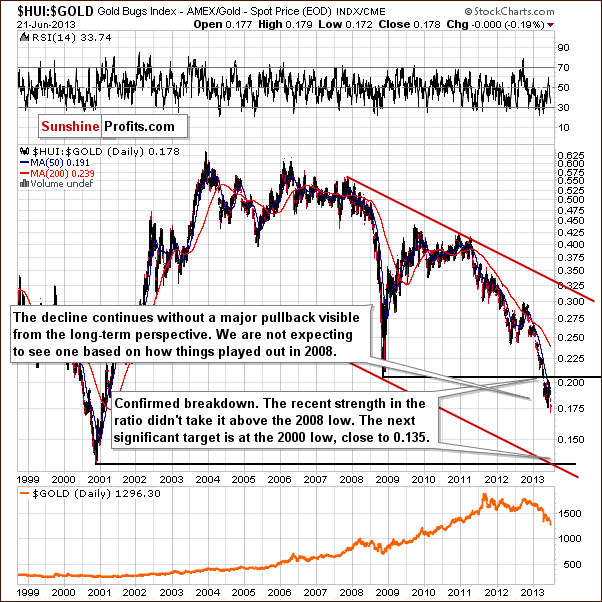
Beginning with the gold-stocks-to-gold ratio, we see that the decline continues and that the ratio is quite far from its target – the 2000 low. Therefore, the declines could very well continue.
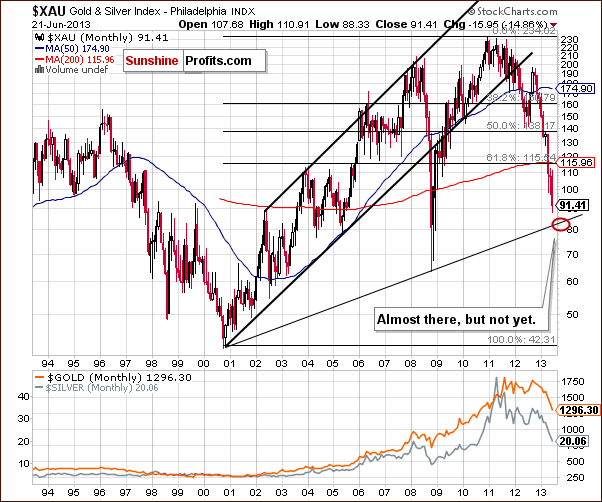
The XAU Index is above our initial target (84) for this decline, however, it seems that we could see a move even below that level. This will be an excellent buying opportunity, it’s definitely worth paying attention to the precious metals market right now.
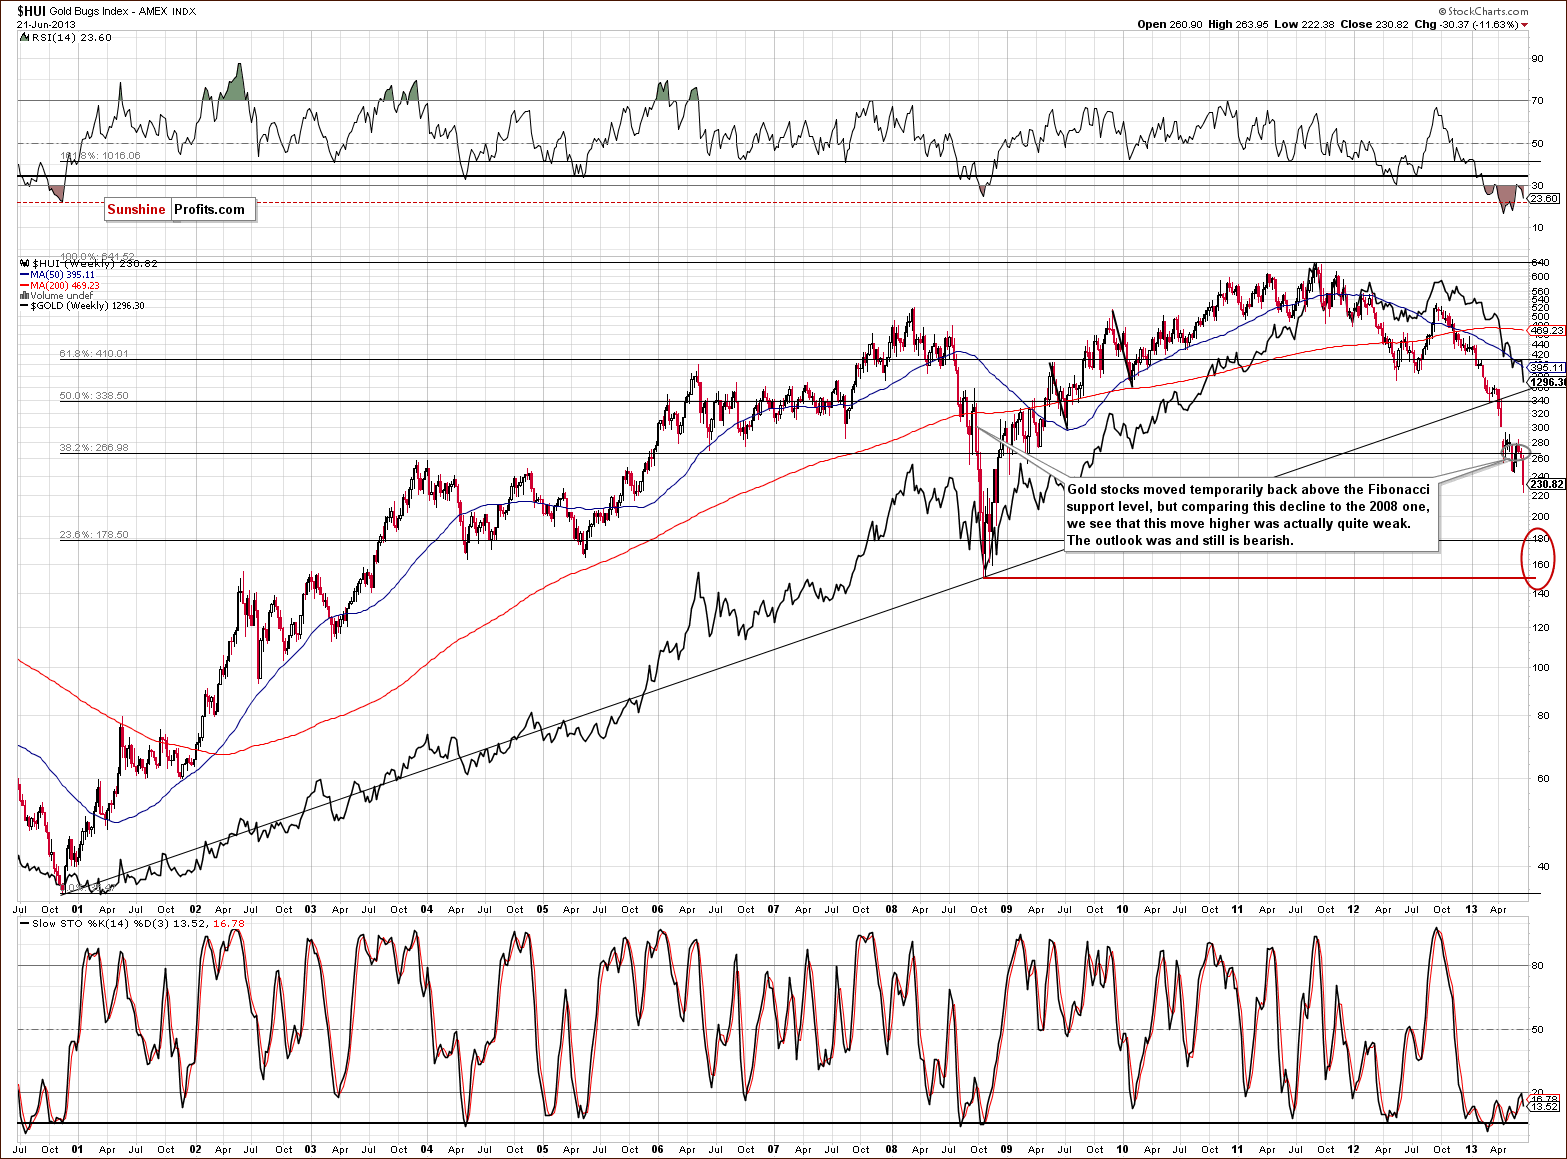
We previously wrote that the XAU Index chart was better for providing the price target, but given the more bearish outlook due to the gold-USD link, it seems that miners would move even below the 84 target from the XAU Index. In this case, it is the HUI Index that enables us to create a better price target.
The red ellipse on the above chart includes both important support levels – the 61.8% Fibonacci retracement level and the 2008 low. There’s one more thing that we didn’t mark on the chart and that is the price gap close to the 300 level (the gap was formed in April). Such a price gap sometimes indicates that at the time when its formed, the market is halfway done rallying or (in this case) declining. Taking this analogy provides us with a target in the marked area as well.
Summing up, the outlook for mining stocks remains bearish. If gold is to decline to $1,100 and the HUI:GOLD ratio is to decline as well, then we could see HUI at 150 or so. It doesn’t have to move so low – it could bottom higher, for instance in the upper part of our target range, closer to 180 – but it’s no longer an extremely unlikely event.
Letters from Subscribers
Q: What is Sunshine Profits' current estimage for the likely price range for gold and silver in Dec 2013 and Apri 2014? I just wonder when gold is likely to get over $1580 on a sustainable basis, and silver $26 and $30 respectively.
A: Our best guess at this time is $1,500 - $1,600 range in Dec 2013 and $1,800 - $1,900 by Apr 2014. However, a lot can happen along the way and we will likely adjust these projections at least a few times in the coming months (as more information becomes available).
Q: Do you think this article about large positions shifting on he Comex isaccurate? If so what implications do you see? Here's a small quote: "JPMorgan was able to flip a net short position in COMEX gold of 50,000contracts in February to a net long position of 50,000 contracts".
A: There are two ways to look at it.
1. JP Morgan and other banks are reducing the amounts of short contracts that they hold along with declining prices - just like it was multiple times before when prices declined. They might start shorting when metals rally again just like was the case previously. The current decline is exceptionally big, so the size of the reduction shouldn't surprise anyone. It's not a big deal.
2. The current low prices are exactly what JP Morgan and other banks (a.k.a. "banksters") want to finally cover their short positions. This is the final moment to get back in the market because the bankers may not short anymore and the price will move only up from here (no major corrections until $100+). Perhaps the news about Cyprus selling their gold, the bearish recommendation from Goldman that pushed gold below support levels in April and now the decline and another margin hike for gold futures (even though gold price declined) were all strategically planned to help in covering the massive short positions on the COMEX (and at the same time to show that there is no inflation threat).
Which of them is the proper way? Of course, only time will tell. There were numerous factors in place that contributed to lower prices of gold and other precious metals and the decision to raise margin requirements is at least suspicious in our view (gold's up - margin's up; gold's down - margin's up) and it really does seem that The Powers That Be are doing a lot to take gold lower and keep it there as long as possible (and at the same time the purchases of the official sector are at record highs...). If precious metals prices are manipulated and kept artificially low - and it's quite likely in our opinion - then it is likely that the way out for the "big shorts" will look something like what we have right now. Before you ask, this doesn't mean that the technical tools are useless - it simply means that they need to be approached carefully (for instance, a breakout/breakdown in silver is rarely meaningful if not accompanied by other metals and miners).
Moving back to the main topic, the shorts are covered when prices decline. This means that there are lower odds of a situation in which the market explodes overnight as banks are forced to cover their shorts at whatever price. Consequently, even if it is the second scenario that we will soon see, the rise in price will likely not be an overnight event, but a more regular rally (the post-1976 kind of a rally). This means that the above is not a reason to disregard all the short-term bearish indicators, but to keep in mind that the coming decline may - and very likely will - only be a temporary phenomenon.
What if it's the first outcome that will prevail? Surprisingly, the implications are not much different. If we get a regular rally in the following months that will not be the start of the final upswing of this bull market, then does it really change that much at this time? It doesn't. All it means is that there will be a bigger correction sometime in the coming months, perhaps in early 2014 or so.
Do the above information, discussion and analysis change anything in our approach toward our speculative and investment capital? No. In the short run, we can still move lower and the above-mentioned observations don't matter that much. In the long run, we have been expecting to see higher prices anyway, so our strategy takes that into account. In fact, we already suggested getting back with some of your capital into gold and platinum (but leaving most of it out - silver, miners, remaining half of gold and platinum investments).
Q: though the gold rate in oz is going below 1285 in us $,,we in India are not getting benefit of low gold rate due to depreeciation in rate of ruppee vs dollor,,today 59.75..
plz suggest when to purchase gold in India in view of short term & long term investment
A: Gold priced in the Indian rupee didn't move to new lows last week (it's slightly above the April low) but it seems that the final bottom will form at the same time as it will in case of gold from our regular USD perspective (so, we will keep you informed - it will be the same time when we suggest getting back in from the USD perspective). It also seems that gold will move below the April lows from the Rupee perspective too.
Q: Thanks for the recent update(s). I am up on gll,zsl and put option on FCX. My only question is if you suggest a long term investment at 1850 then does one hold regardless of the price dropping lower?
A: We were also asked if our suggestion to get back on the long side of the market with part of gold and platinum investments means that one should hold regardless of the price dropping lower. Generally, yes, we currently don't have a stop-loss for this part of the capital - it seems that the short term may be very volatile, but that the price will recover shortly - it may be difficult to re-enter the market if a stop-loss order takes you out of it. We will strive to get better entry prices than the recent ones, but being partly in helps to make sure that you get in low on average regardless whether we are successful or not. In case of the long-term capital, the risk is to be out of the precious metals market, in our view, so moving partly in below $1,300 seemed like a good idea.
Summary
10 days ago we suggested doubling the size of the short position in gold, silver and mining stocks, and we continue to think that having them is a good idea.
The USD Index is likely not done rallying, even though a short pause could be seen soon (after all the index moved very rapidly higher and a breather may be necessary). This means that gold is quite likely not done declining even though it’s already low.
If the USD Index moves above the 86 level, then we could very well see gold at $1,100, silver slightly below $15 and HUI in the 150-180 range. This may sound excessive and too low from the logical point of view, but this is what could happen – look at the USD Index, look at the strength of the reaction of gold to the dollar’s rally and look at the relative valuations of gold to silver and gold stocks. This could actually happen and be an exceptional buying opportunity.
For now, we remain bearish for the short- and medium term as far as the precious metals market is concerned.
Given that gold, silver and mining stocks moved lower, our short positions became even more profitable, and previous stop-loss orders are now quite far away, we decided to adjust the latter. You will find the details in the below table.
Trading – PR: Short gold, silver and mining stocks. Extra position.
Trading – SP Indicators: No positions: SP Indicators suggest long positions but the new self-similarity-based tool suggests short ones for the precious metals sector and we think that overall they cancel each other out.
Long-term investments: Half position in gold and half position in platinum. No positions in silver and mining stocks.
| Portfolio's Part | Position | Stop-loss / Expiry Date |
|---|---|---|
| Trading: Mining stocks | Short | 262 (HUI), $28.20 (GDX) / - |
| Trading: Gold | Short | $1,383 / - |
| Trading: Silver | Short | $22.55 / - |
| Long-term investments: Gold | Long (half) | - |
| Long-term investments: Silver | No position | Buy half at $18.20 |
| Long-term investments: Platinum | Long (half) | - |
| Long-term investments: Mining Stocks | No position | Buy half at XAU 84 |
This is an extra update; the full-sized Premium Update will be published normally and is scheduled for June 28, 2013.
Thank you for using the Premium Service.
Sincerely,
Przemyslaw Radomski, CFA


