Briefly: in our opinion, full (250% of the regular size of the position) speculative short position in gold, silver, and mining stocks is justified from the risk/reward perspective at the moment of publishing this Alert.
Gold miners just erased over 50% of the 2019 decline, and almost the entire upswing took place in just two trading days. Just how much more bullish can things get for the miners? Or... Maybe the rally is not as bullish as it seems at first sight? Maybe we have already seen something similar in the past? Maybe more than once and maybe there are some key learnings from these similarities, starring us in the face?
This is indeed the case. Let's jump right into the charts.
Lessons from the Past Make For Objectively Judging the Present
It's very easy to forget the big picture when things are very volatile. That's why it's so difficult to make money in any market. After a rally, people want to buy, thinking that a rally on one day makes a rally on the next day more likely. After a decline, people want to sell, thinking that a daily decline (especially a big decline) makes the decline inevitable on the next day. And people buy high and sell low. They feel "right" for a while, but their portfolios become smaller and smaller. That's not the way to make money in the markets.
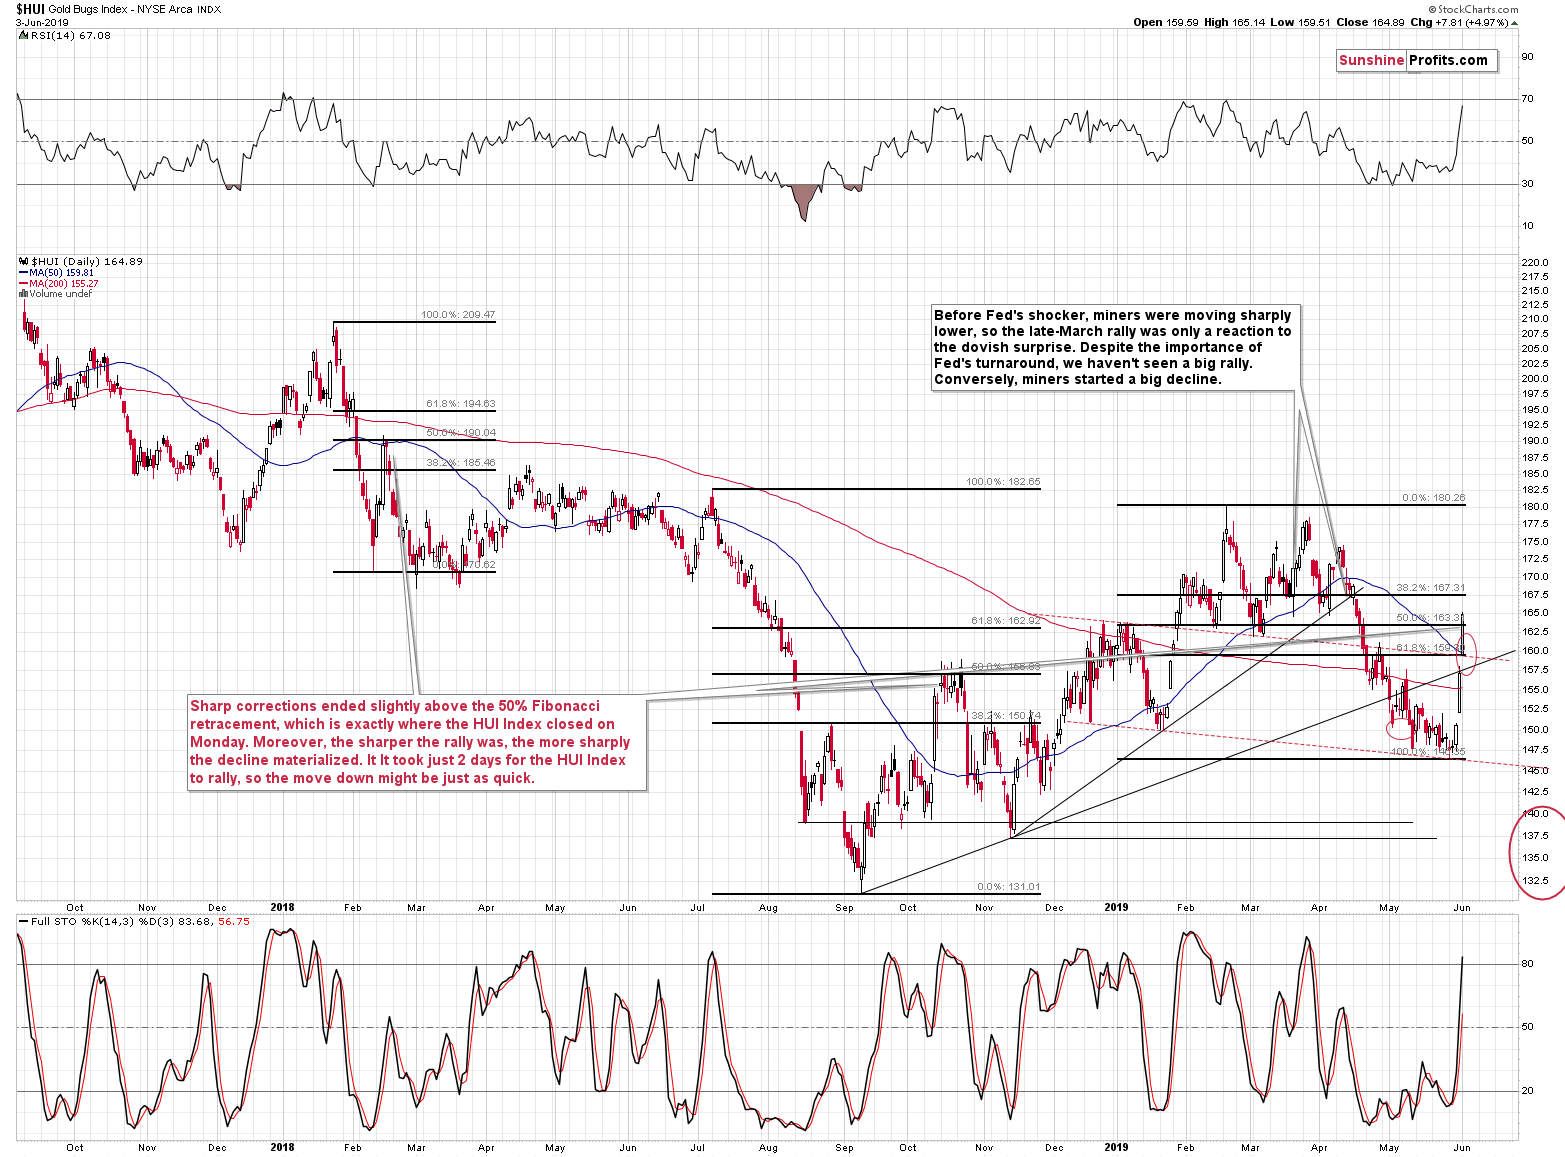
One of the best ways to do so is to focus on the context of a given move and see what it really means and how similar moves resolved in the past. In case of the mining stocks, we have a combination of one unexpected factor - Trump's tariff comments with regard to China and Mexico - and the triangle-vertex-based reversal that triggered a rally that was way bigger than what was reasonable to expect. Given the surprising nature of the trigger, the market moved higher more than it should, but... Weren't the markets surprised in the past? Of course they were. And they rallied sharply as well, regardless of the reasons for the rally. Even though the start of the rally was not really predictable (again, a small upswing was one of the possibilities, but it was the surprising nature of the comments that magnified it), the above tells us that the size of the move is not something that we haven't seen previously.
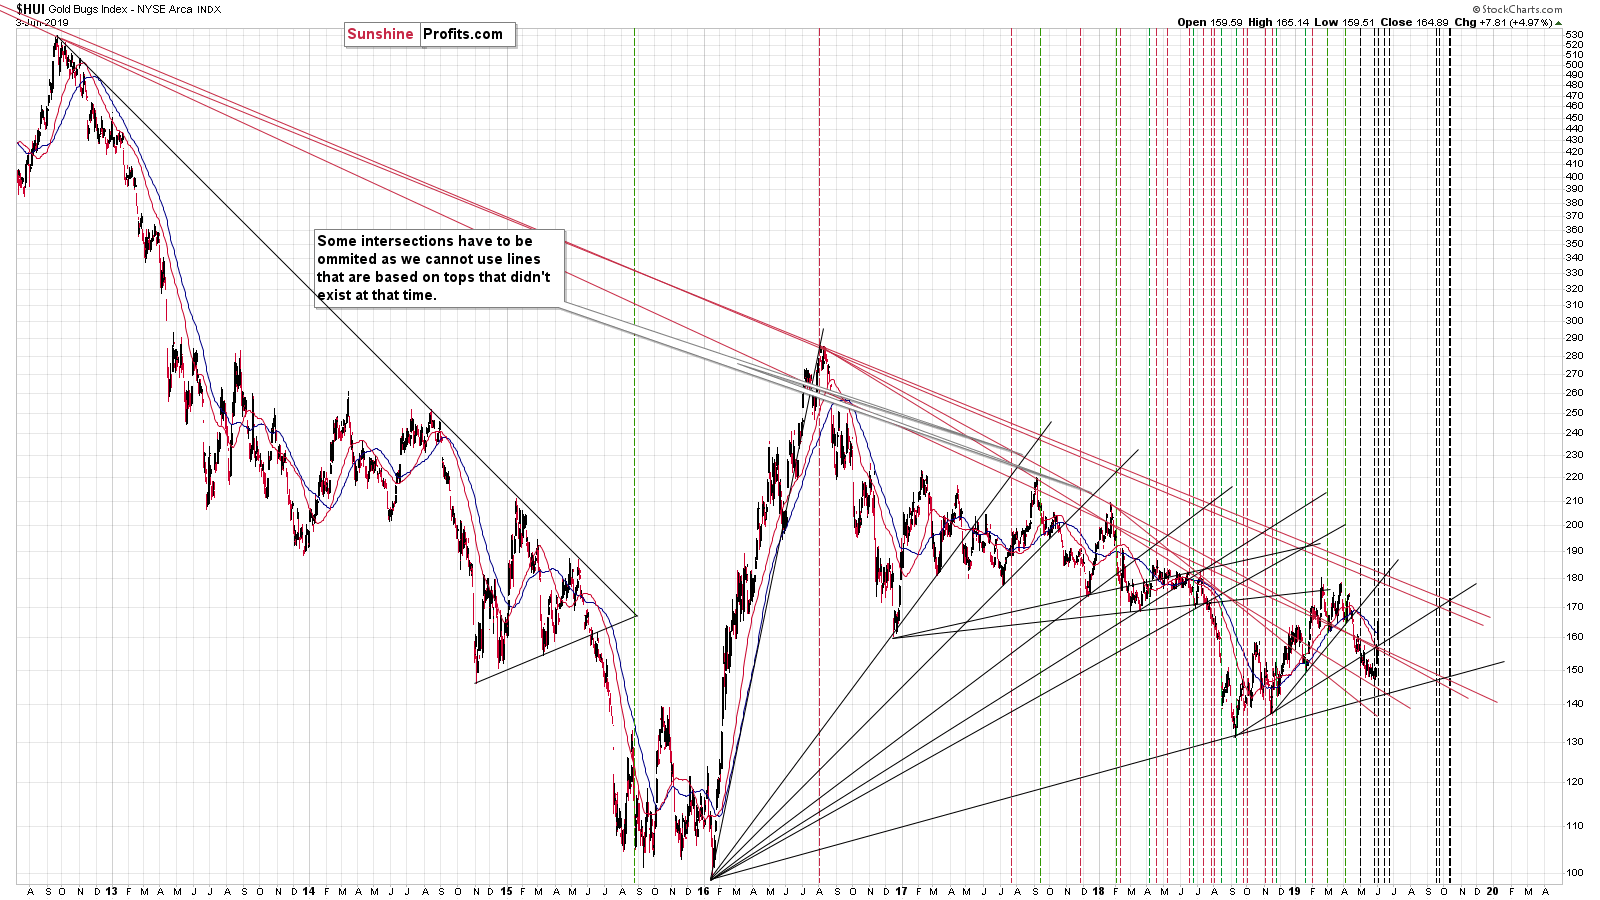
Conversely, there were two cases when a big decline was followed by a sharp rally. It was in February and in October 2018. What do these two situations - and the current one - have in common? The size of the rally. In all cases, the HUI Index moves a bit above the 50% Fibonacci retracement level. That was not the time to go long. It was a perfect shorting opportunity. This was especially the case in February 2018 - the top that we saw at the 50% retracement marked the prices that we haven't seen since that time. This is particularly interesting, because that was when two triangle-vertex-based reversals were right next to each other and we have exactly the same thing right now. Please take a look at the details on the below chart.
There's one more analogy that's more distant in time, but no less important.
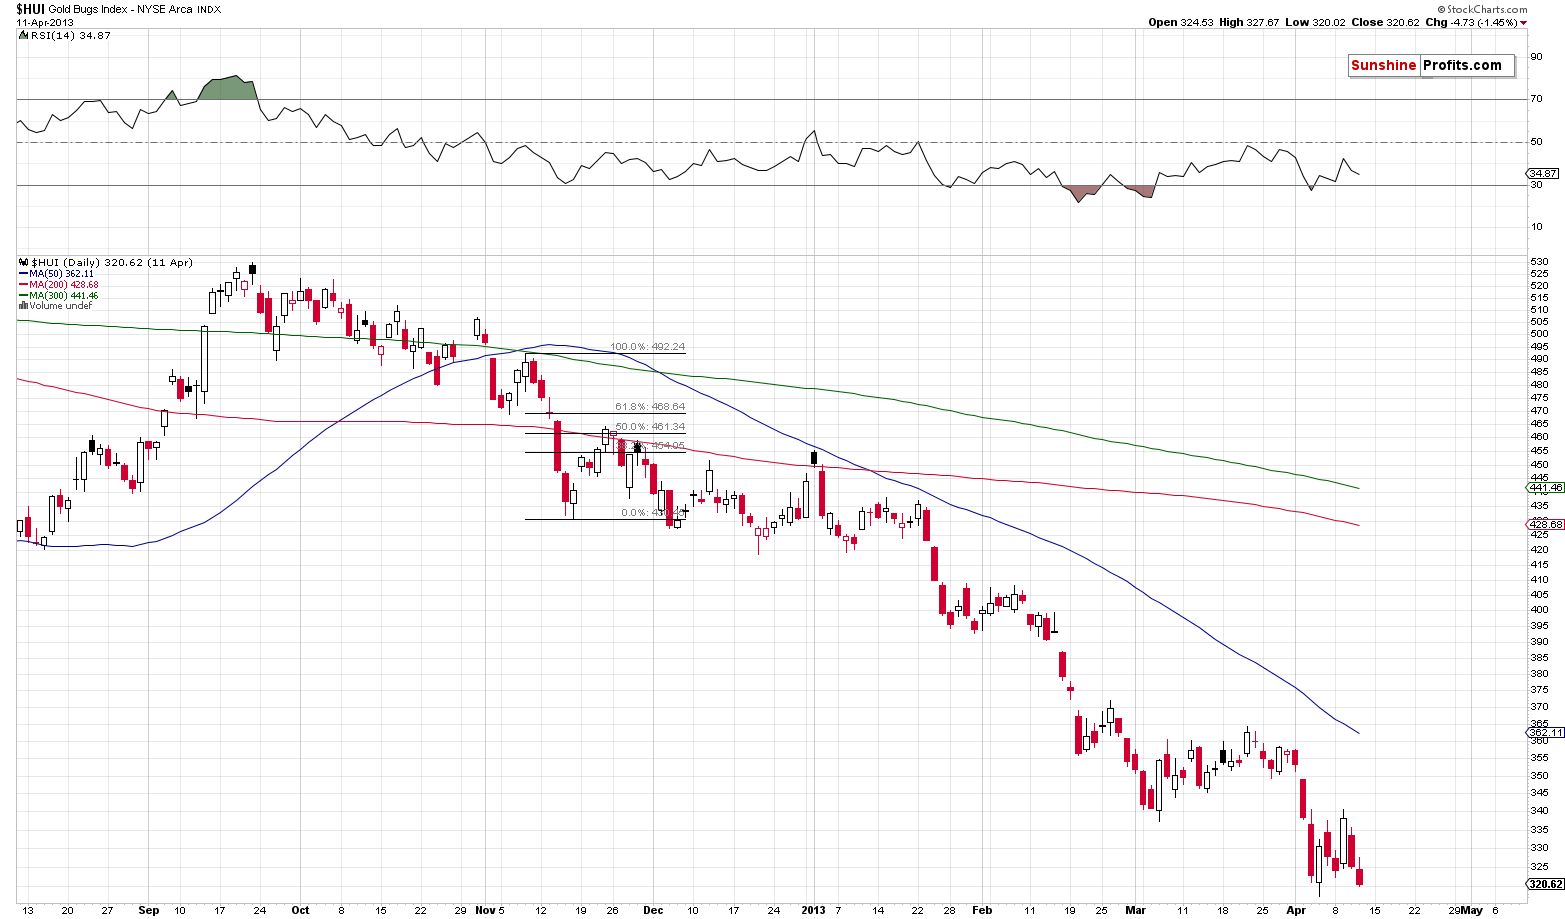
Do you know when the 50% Fibonacci retracement also followed a sizable decline?
In November 2012. There are multiple similarities between the 2012-2013 decline and the current situation, so the fact that we saw this kind of corrective upswing then makes it even more likely that the mining stocks are currently topping and that the outlook remains bearish.
The above chart shows what happened before the huge April 2013 plunge. Did it really matter if one didn't adjust their position to the November correction? Absolutely not.
The Present Across the PMs Sector
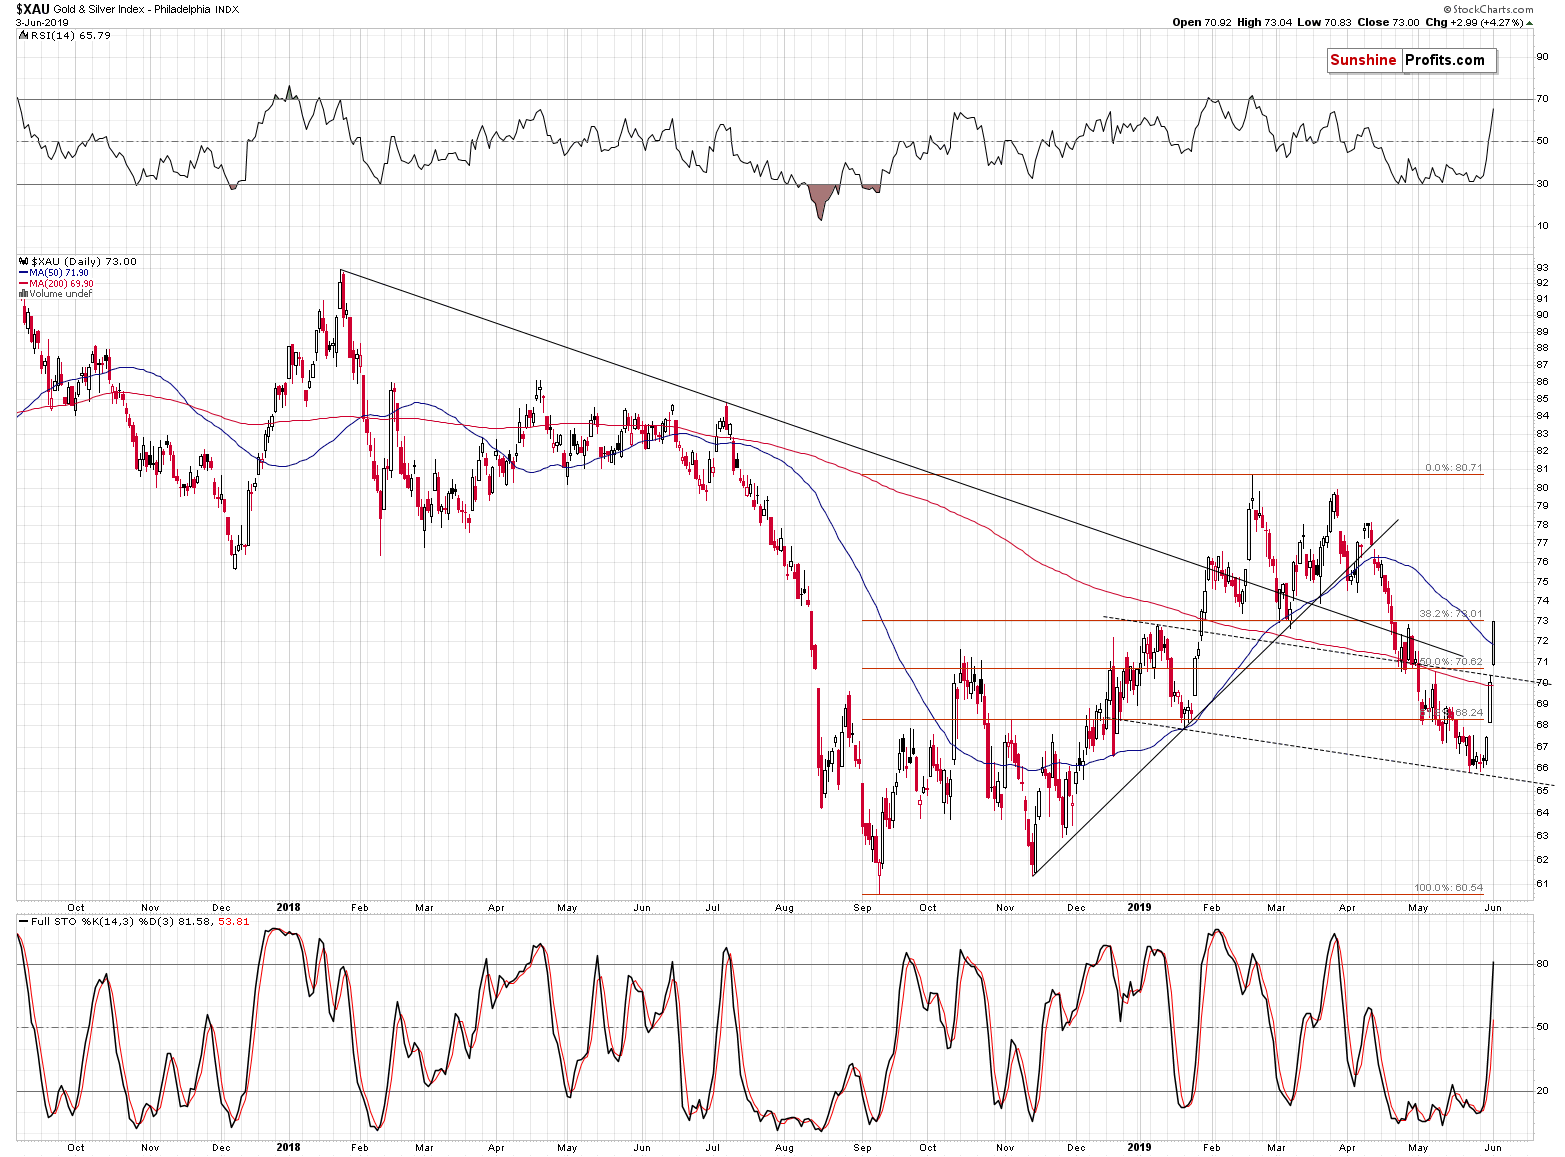
As far as the XAU Index is concerned, let's start with quoting our yesterday's comments on it:
Another proxy for the mining stocks, the XAU Index, reveals more of the same. The mining stocks moved to the line that's parallel to the neck level of the possible H&S top formation, so the top might already be in. However, even if the XAU rallied to about 73 - to the January high - it would not invalidate the formation just yet.
The XAU Index closed the day exactly at the 73 level. It didn't invalidate the possibility of seeing a medium-term head-and-shoulders pattern with profoundly bearish implications for the following weeks and months.
Let's turn to gold.
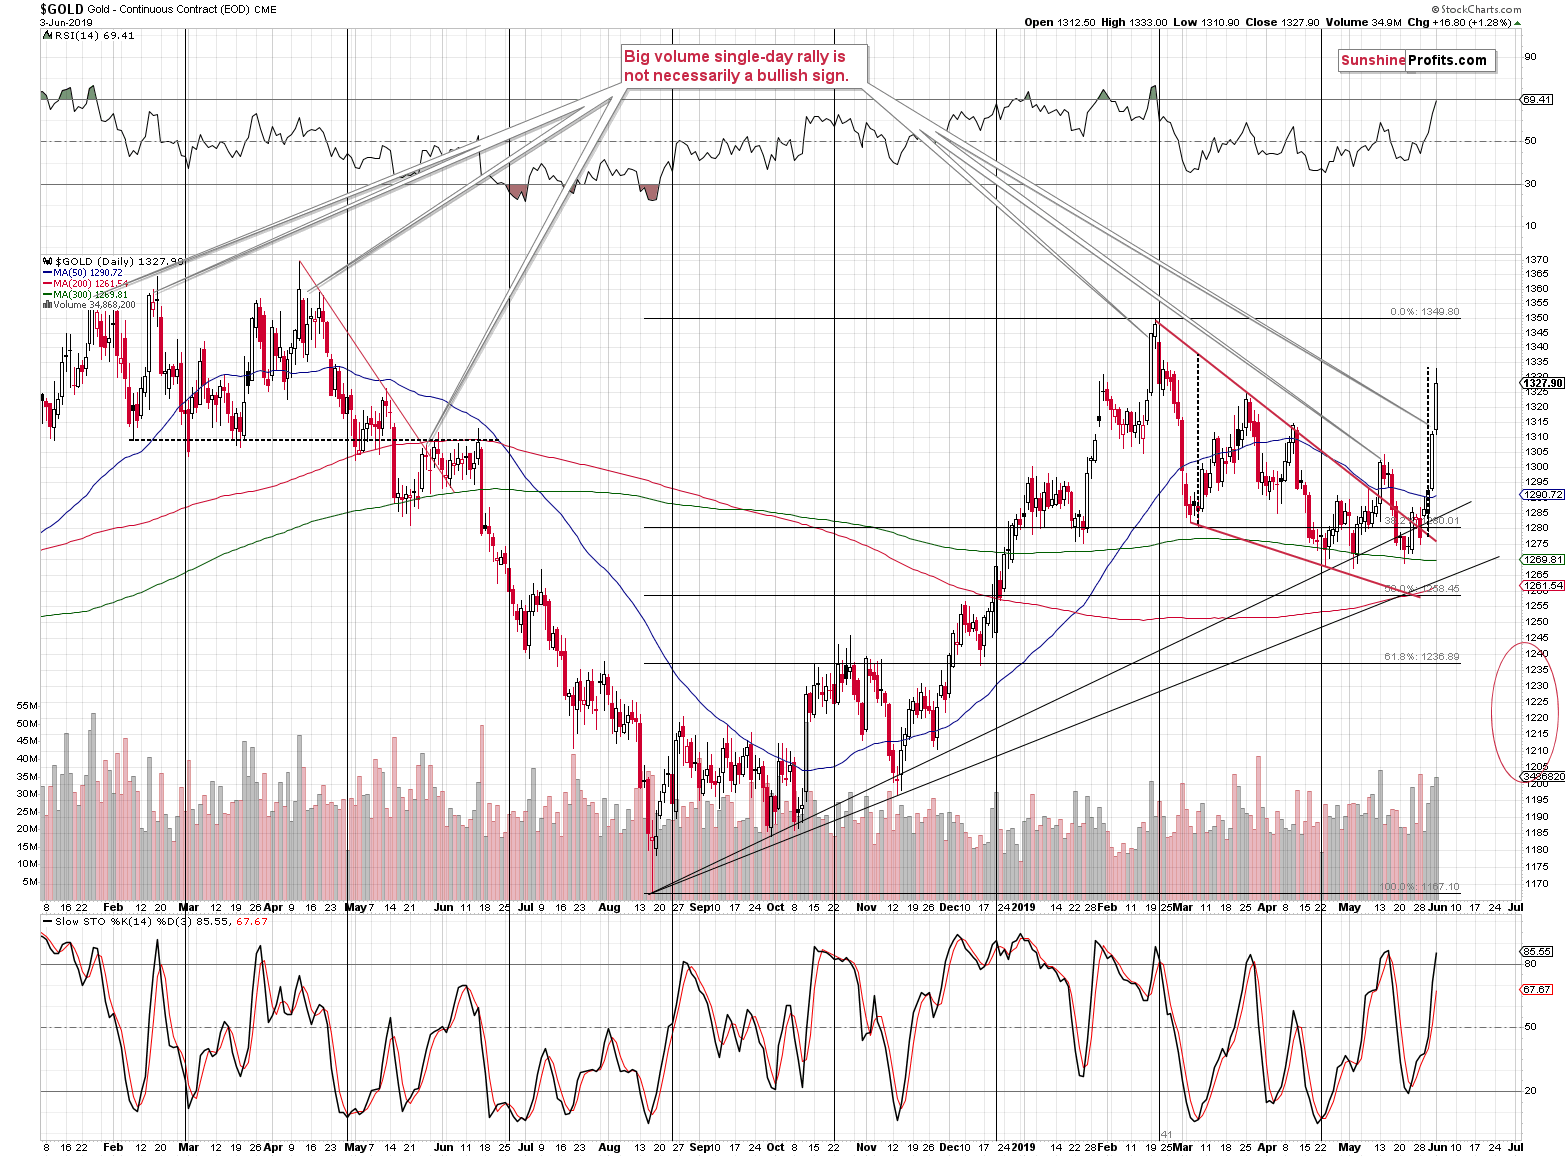
Gold rallied sharply, but it gave away some of its gains before the end of the day. The intraday high was almost precisely as high as the declining wedge formation would suggest. Moreover, the Stochastic is above 80 and RSI is at about 70. Both seem to confirm that the top is in or at hand.
And what about silver?
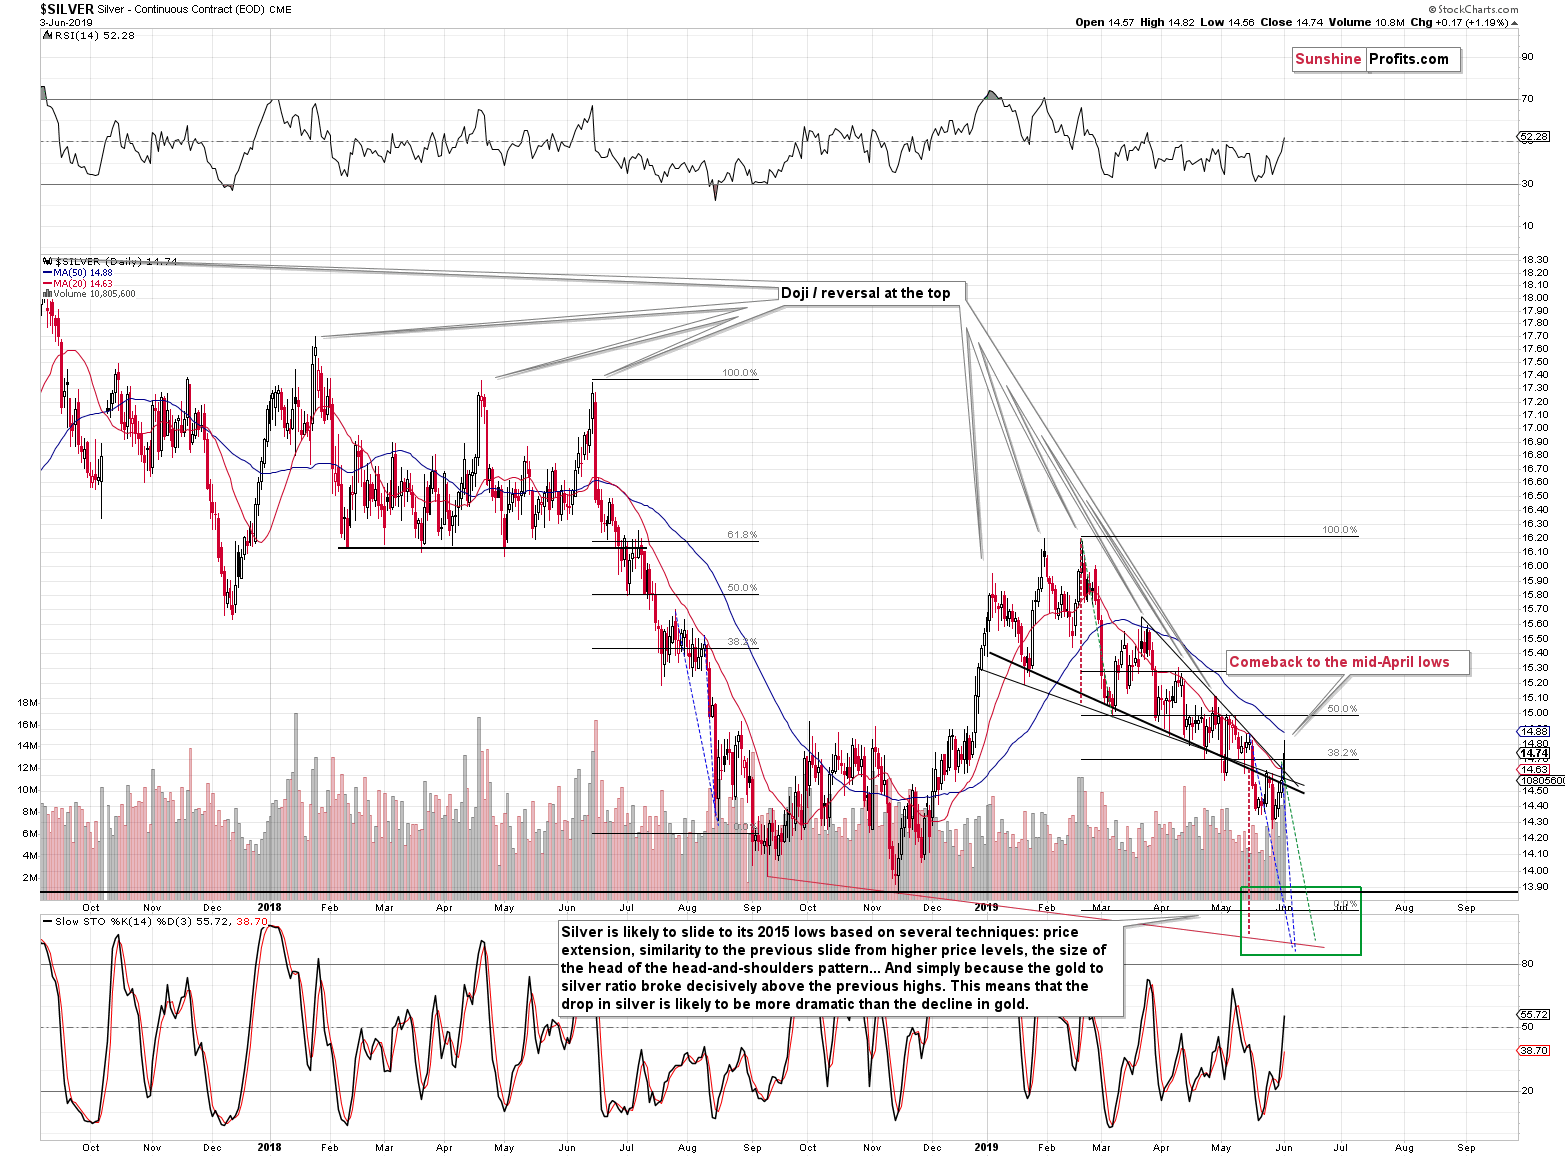
The white metal moved higher, but not significantly so. The white metal invalidated the breakout below the declining support line and it even rallied above the upper resistance line that we marked with red. Silver's performance is still relatively weak, but it moved much higher than it did on Friday, which means that it's catching up. That's what we usually see in the final parts of a given move higher, so the days of this rally are likely numbered.
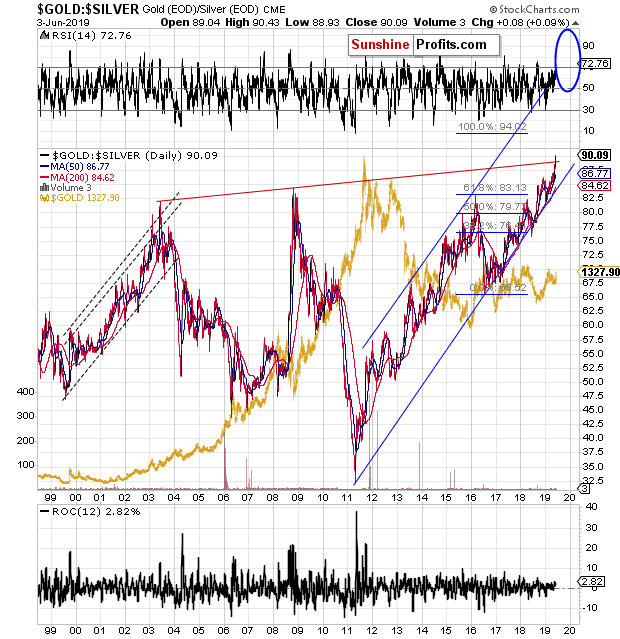
The overall weakness in the white metal continues to indicate that nothing major really happened. It's just a temporary reaction to an unexpected news. The gold to silver ratio provides details.
The ratio is above 90, which is quite normal given the recent breakout above the long-term highs and the fact that the next very strong resistance is still much higher - at 100. But what we would like to emphasize on the above chart, is the lack of a turnaround. The ratio moves up during big declines in the precious metals and it moves down during big rallies in the precious metals. The 2008 and 2011 performance clearly shows how it works. Now, even though gold and mining stocks rallied visibly, the ratio stays high, suggesting that nothing has really changed and that the big downtrend remains intact.
What about the USD Index?
USD Index: The Trigger of Yesterday's PMs Upswing?
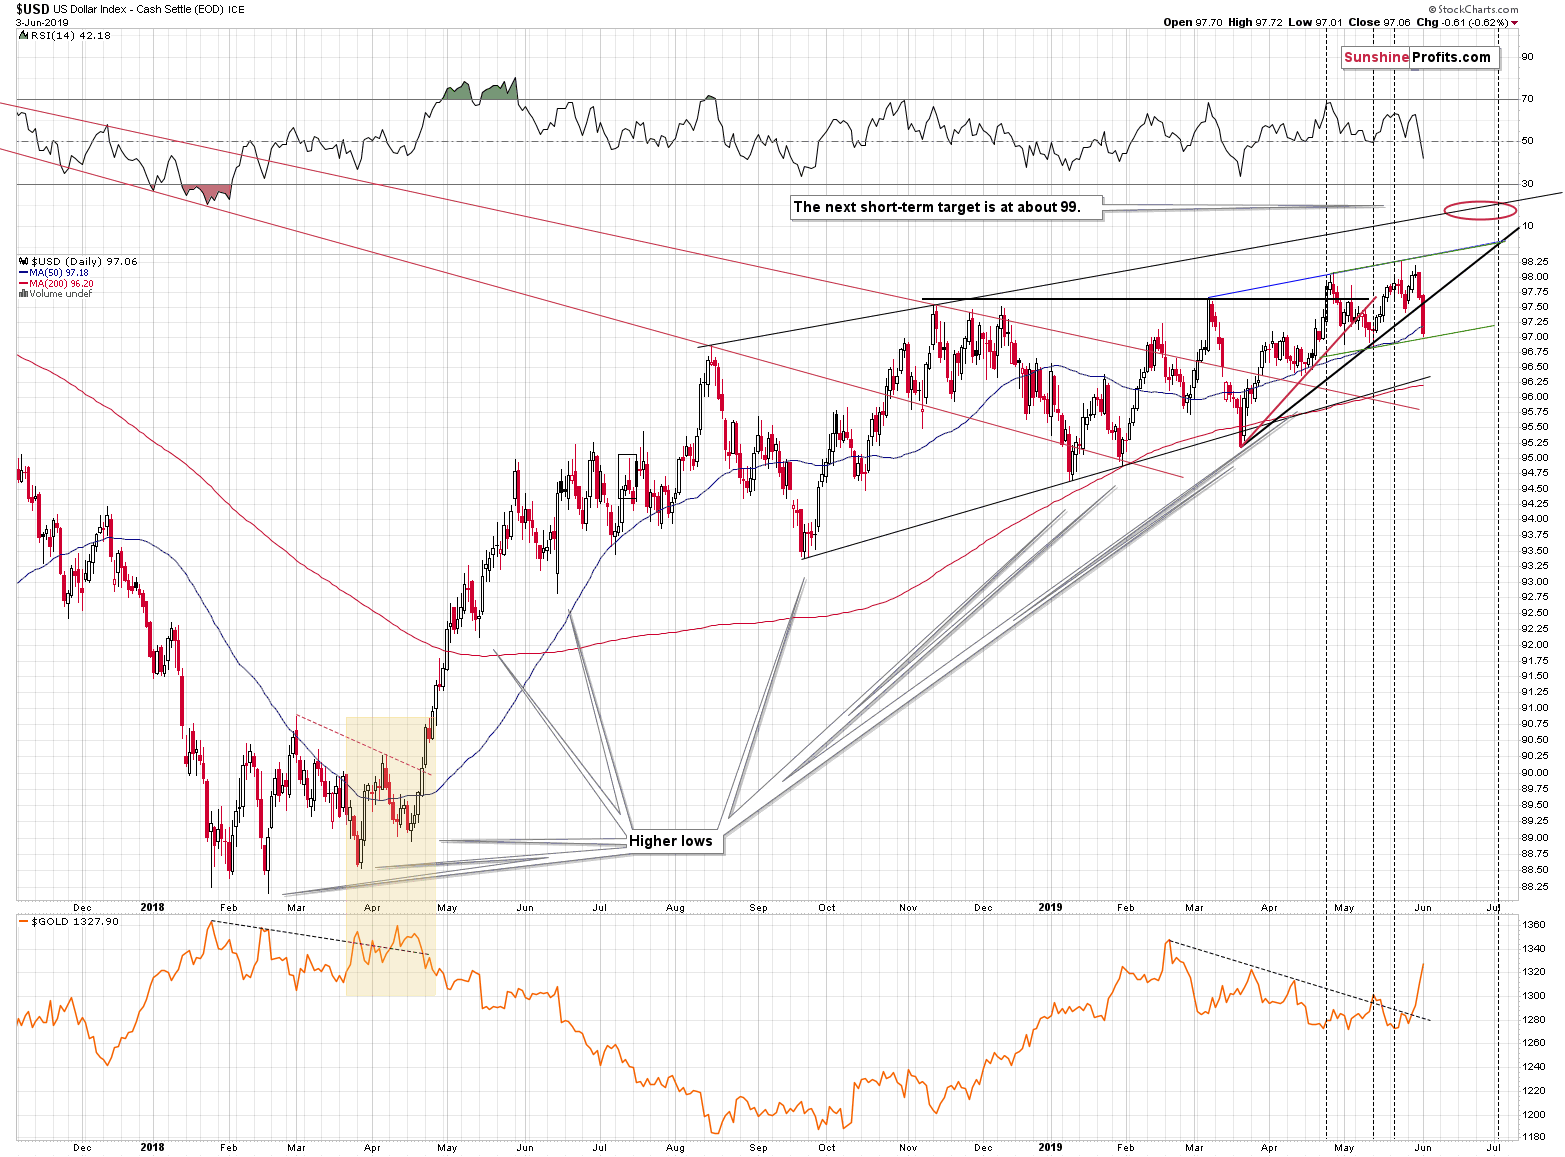
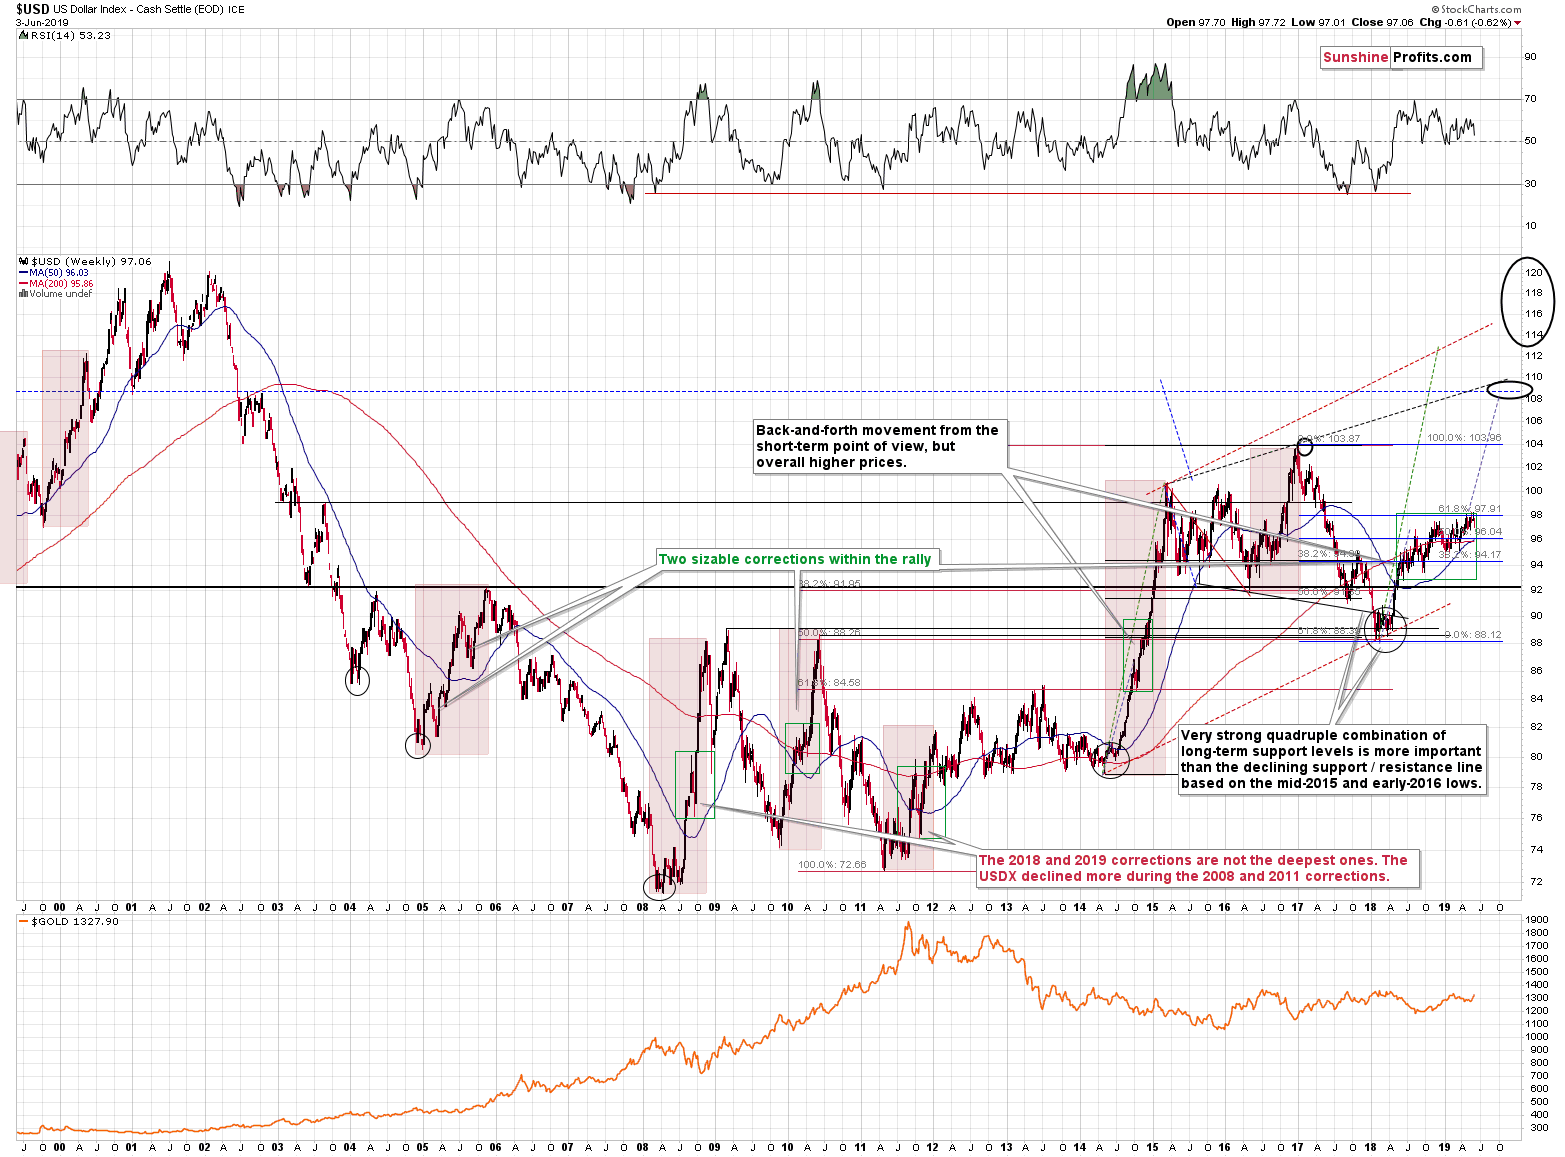
The USDX was pushed below the rising black support line and this breakdown is likely what was responsible for yesterday's upswing. It was an unlikely move, but yet it happened. Since it did, how low can the USD Index fall? Actually, it's very likely that the falling is almost over.
When the USD Index declined below the rising red support line in early May, it declined about as much as it had been above it before the breakout. Applying this to the current breakdown suggests that the bottom was just reached. This theory is supported by the green support line that's parallel to the line based on the April and May tops.
However, the lowest of the reasonable targets for the decline is the one at the rising medium-term support line that's based on the September 2018 and January 2019 lows. This line is currently at about 96.30, which is 0.76 below yesterday's close.
And the big picture?
The big picture is as favorable as it could be. The USD Index has been consolidating below the 2017-2018-decline-based 61.8% Fibonacci retracement for many months and once it breaks above it, the real moves will start - like a domino. They will likely make the last couple of days in the precious metals market relatively boring.
Earlier today we featured a chart where the HUI Index corrected more than 50% of its decline in late 2012. Did you remember it before we featured it on the chart? Most likely not. But you definitely do remember the 2013 slide (that is if you were interested in the precious metals market at that time). What's likely to come in the next several months will most likely make you forget what happened this and last week. The odds are that you will be too busy counting profits. Actually, now that we mentioned it, you may make a mental note and recall this time - you will probably recall it with a comment that the patience was well worth it.
Something in Addition to (Instead of?) Patience
Before summarizing, a quick note regarding patience and dealing with market's unpredictability in general. Patience is extremely rewarding while investing, but there is another way to deal with markets' unpredictability.
It's diversification.
For instance, those who diversified into silver are likely much calmer now than those who are trading only mining stocks (by the way, we give silver priority over gold in our managed futures service). But the diversification potential doesn't end there. While the precious metals sector was impacted by the Trump's trade comments in a bullish way, the impact on the crude oil market was very bearish. It was very positive for our short position in crude oil, which we had opened on April 23rd, right after crude oil closed at $65.55. Yesterday's closing price is exactly $53.25. That's over $10 in crude oil (about 15%) in less than 1.5 months. That's way over 100% annualized. There were also multiple profitable trades in our forex trades. There are no trades open at the moment, but we are making this year's currency analyses available for you to review. While an individual surprising news may be negative for one market, it can be positive for a different market. In other words, diversification allows to get profitable in a smoother, more predictable manner. It's not as comfortable as investing in a fully managed fund, or a trading program, but it's something that greatly adjusts the path to profits on an individual basis.
Then, there are also time perspectives. The recent moves may be significant on a day-to-day basis, but either by zooming in or zooming out, this can be mitigated.
The long-term approach - naturally connected with patience - means focusing on the big price moves instead of the brief ones that take just a few days and viewing the latter as price noise. It's not stressful, if one chooses to focus on different kind of moves. The downside here is that for longer periods, one may not have any positions at all, missing some good opportunities along the way.
Alternatively (or additionally), one could be zooming in - into day trading. It's not everyone's cup of tea as it requires more time and attention on a daily basis. But by making multiple tiny trades, no single big move is likely to have a particularly adverse effect. Surely, a single position could be closed unfavorably, but the stop-loss orders in such cases are very close and the single transaction barely changes anything. For instance, during the testing period of our Day Trading Signals, we had 42 trades and quite a few of them were not profitable, but despite these cases, overall (!) we managed to achieve the performance of 0.68% profit per trade (given no leverage for cryptocurrencies and 10x leverage for other assets).
So, both: patience and diversification can help to deal with markets' unpredictability. It's usually the case that the more patience and the more diversification one applies, the better the results and the greater the resulting peace of mind.
Summary
Summing up, even though gold moved higher yesterday, the outlook for the following weeks didn't change and it remains bearish. The news-based nature of the USD decline makes it temporary and the same appears to be the case for the gold price rally. The turnaround took place right at the long-term vertex-based reversal for silver and mining stocks. It's an unfortunate coincidence that Trump had to make the extremely surprising comments right on this day - if it wasn't for that, the rally would have likely been minimal. It doesn't seem to change anything with regard to the next several weeks and months, though. The next reversal is likely to take place shortly - but based on the recent move higher in gold, the reversal is likely to be a price top. In fact, there are indications that the top might already be in and that the decline can resume shortly. The next bottom is likely to be formed in the final part of June, which means that gold, silver and miners will have a few weeks to slide to their respective targets. This makes it more likely that miners will be able to reach their distant target along with the underlying precious metals. Once gold reaches our interim target level of $1,240, we will consider opening long positions.
To summarize:
Trading capital (supplementary part of the portfolio; our opinion): Full short position (250% of the full position) in gold, silver, and mining stocks is justified from the risk/reward perspective with the following stop-loss orders and exit profit-take price levels:
- Gold: profit-take exit price: $1,241; stop-loss: $1,357; initial target price for the DGLD ETN: $51.87; stop-loss for the DGLD ETN $39.87
- Silver: profit-take exit price: $13.81; stop-loss: $15.72; initial target price for the DSLV ETN: $39.38; stop-loss for the DSLV ETN $26.97
- Mining stocks (price levels for the GDX ETF): profit-take exit price: $17.61; stop-loss: $24.17; initial target price for the DUST ETF: $34.28; stop-loss for the DUST ETF $15.47
In case one wants to bet on junior mining stocks' prices (we do not suggest doing so - we think senior mining stocks are more predictable in the case of short-term trades - if one wants to do it anyway, we provide the details), here are the stop-loss details and target prices:
- GDXJ ETF: profit-take exit price: $24.71; stop-loss: $35.67
- JDST ETF: profit-take exit price: $78.21 stop-loss: $30.97
Long-term capital (core part of the portfolio; our opinion): No positions (in other words: cash)
Insurance capital (core part of the portfolio; our opinion): Full position
Whether you already subscribed or not, we encourage you to find out how to make the most of our alerts and read our replies to the most common alert-and-gold-trading-related-questions.
Please note that the in the trading section we describe the situation for the day that the alert is posted. In other words, it we are writing about a speculative position, it means that it is up-to-date on the day it was posted. We are also featuring the initial target prices, so that you can decide whether keeping a position on a given day is something that is in tune with your approach (some moves are too small for medium-term traders and some might appear too big for day-traders).
Plus, you might want to read why our stop-loss orders are usually relatively far from the current price.
Please note that a full position doesn't mean using all of the capital for a given trade. You will find details on our thoughts on gold portfolio structuring in the Key Insights section on our website.
As a reminder - "initial target price" means exactly that - an "initial" one, it's not a price level at which we suggest closing positions. If this becomes the case (like it did in the previous trade) we will refer to these levels as levels of exit orders (exactly as we've done previously). Stop-loss levels, however, are naturally not "initial", but something that, in our opinion, might be entered as an order.
Since it is impossible to synchronize target prices and stop-loss levels for all the ETFs and ETNs with the main markets that we provide these levels for (gold, silver and mining stocks - the GDX ETF), the stop-loss levels and target prices for other ETNs and ETF (among other: UGLD, DGLD, USLV, DSLV, NUGT, DUST, JNUG, JDST) are provided as supplementary, and not as "final". This means that if a stop-loss or a target level is reached for any of the "additional instruments" (DGLD for instance), but not for the "main instrument" (gold in this case), we will view positions in both gold and DGLD as still open and the stop-loss for DGLD would have to be moved lower. On the other hand, if gold moves to a stop-loss level but DGLD doesn't, then we will view both positions (in gold and DGLD) as closed. In other words, since it's not possible to be 100% certain that each related instrument moves to a given level when the underlying instrument does, we can't provide levels that would be binding. The levels that we do provide are our best estimate of the levels that will correspond to the levels in the underlying assets, but it will be the underlying assets that one will need to focus on regarding the signs pointing to closing a given position or keeping it open. We might adjust the levels in the "additional instruments" without adjusting the levels in the "main instruments", which will simply mean that we have improved our estimation of these levels, not that we changed our outlook on the markets. We are already working on a tool that would update these levels on a daily basis for the most popular ETFs, ETNs and individual mining stocks.
Our preferred ways to invest in and to trade gold along with the reasoning can be found in the how to buy gold section. Additionally, our preferred ETFs and ETNs can be found in our Gold & Silver ETF Ranking.
As a reminder, Gold & Silver Trading Alerts are posted before or on each trading day (we usually post them before the opening bell, but we don't promise doing that each day). If there's anything urgent, we will send you an additional small alert before posting the main one.
=====
Latest Free Trading Alerts:
The U.S. yield curve has inverted again, and it has done so to the widest level since 2007. How much of a reason to worry is that actually? A sky-is-falling moment lurking ahead? If so, what chance of saving us does gold have?
Yield Curve Inverted Again. Will Gold Shine Now?
=====
Thank you.
Sincerely,
Przemyslaw Radomski, CFA
Editor-in-chief, Gold & Silver Fund Manager


