Briefly: in our opinion, full (300% of the regular position size) speculative short positions in mining stocks are justified from the risk/reward point of view at the moment of publishing this Alert.
Gold moved visibly higher yesterday, but it gold stock were barely affected. This means that the medium-term trend remains down and what we see right now is just a correction within this downtrend. In other words, what we saw yesterday, was not a bullish sign, but a yet another bearish one. We see multiple signs of miners’ weakness on a day-to-day and week-to-week basis, and it was the same in 2013, before the huge slide in the entire precious metals sector.
In yesterday’s analysis, I wrote the following:
This week has been calm so far for the precious metals investors. Let’s keep in mind that this is likely the calm before the storm; at least that’s what the HUI Index’s performance relative to gold in the previous week indicated. As a reminder, the HUI Index (the flagship proxy for gold stocks) was down while gold was up by almost $30, which is an extreme underperformance, as well as a clear sell sign.
While thanks to yesterday’s upswing in gold, the week is no longer as calm, the implications remain intact. Gold futures (in terms of daily closing prices) are up by $14, while the HUI Index is up by mere 2.17, which is next to nothing.
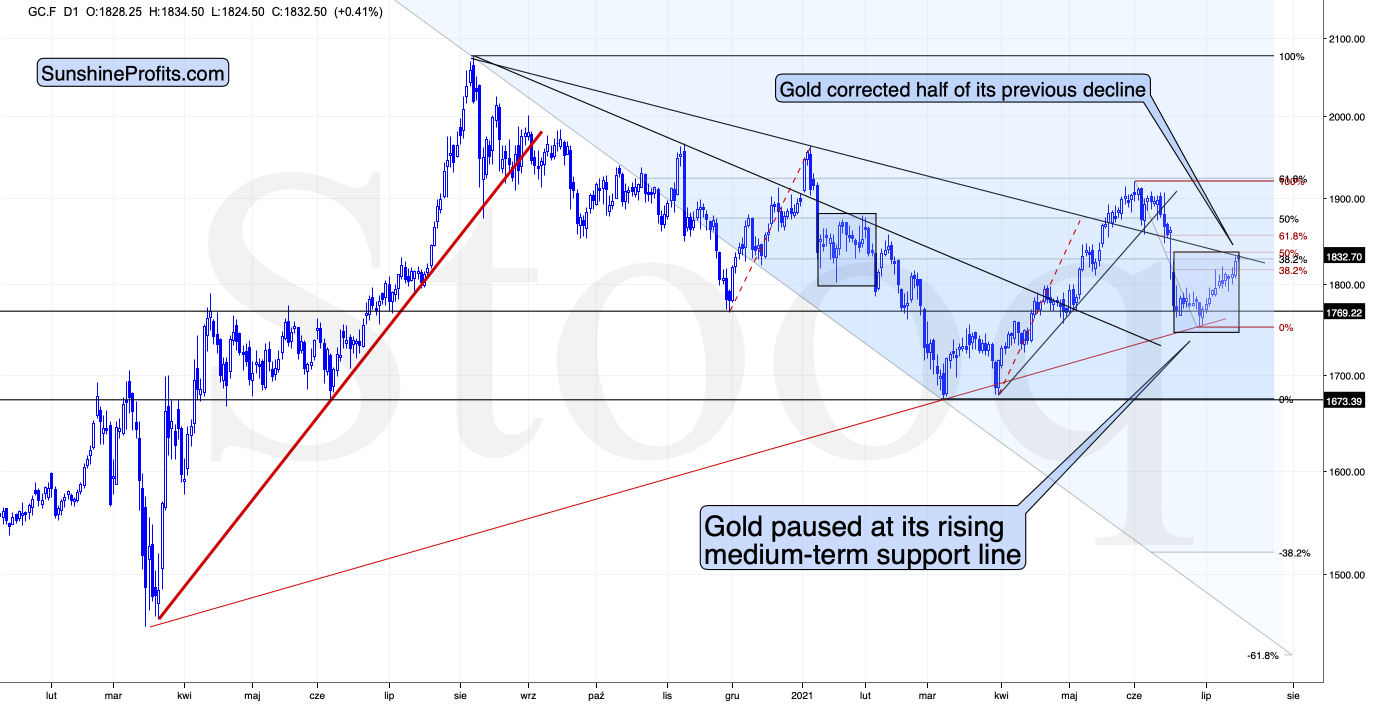 Overall, gold continues to follow a very similar pattern to what it did in January. After a sharp slide, gold then corrected about half of the preceding decline and then declined much more. Based on yesterday’s and today’s pre-market upswings, gold is very close to its 50% Fibonacci retracement, which means that the sizes of corrections are analogous. Consequently, it would be quite natural for the correction to end shortly.
This is particularly the case given that gold just moved to its declining resistance line based on the August 2020 and January 2021 highs.
The key bearish confirmation doesn’t come from gold itself, but from the very weak performance of mining stocks.
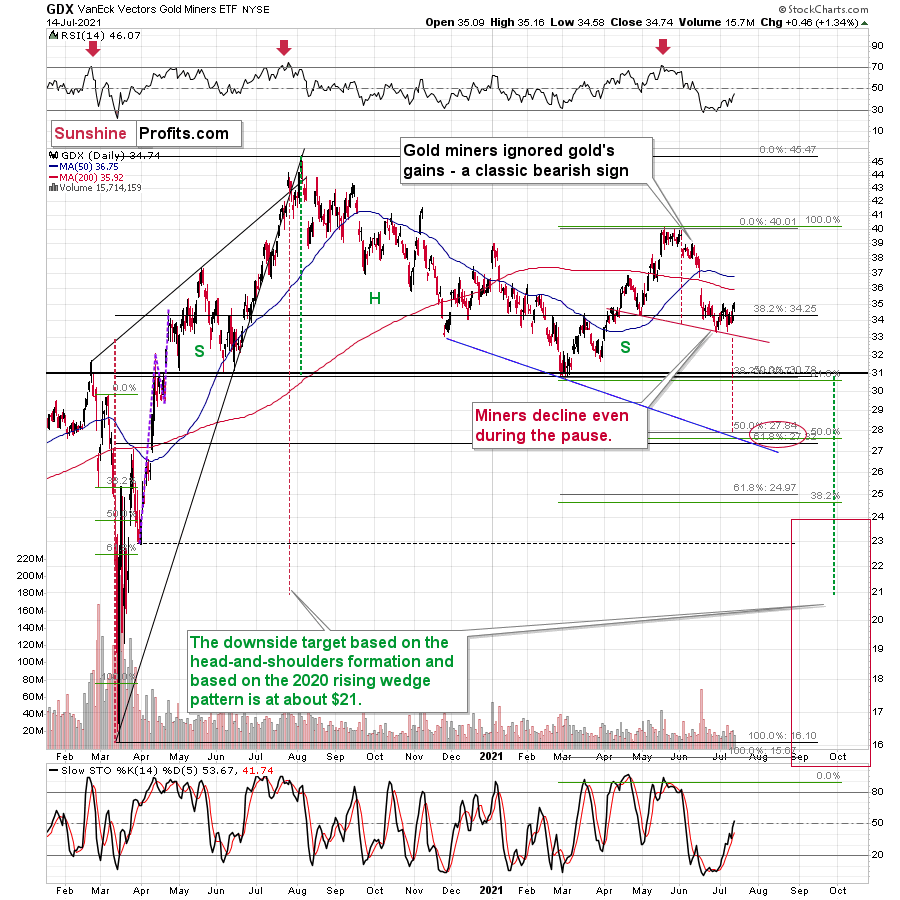
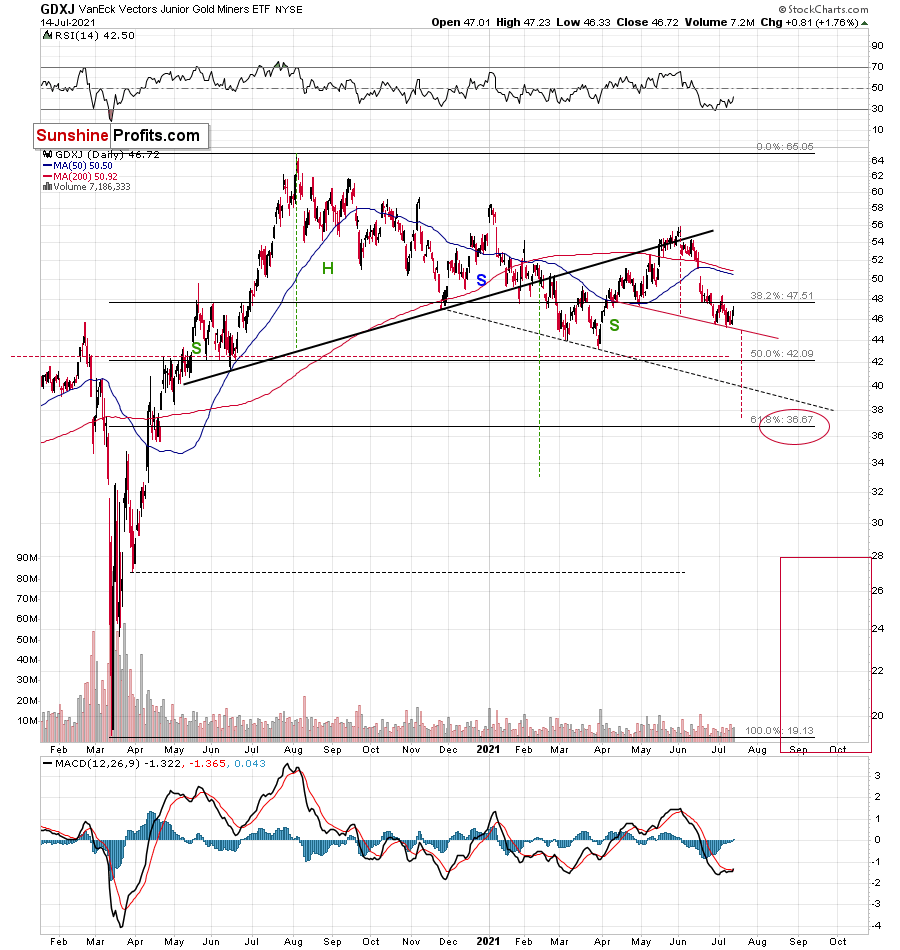
Senior gold miners (GDX) have barely moved to their recent highs. And junior gold miners (GDXJ) didn’t even manage to do the same thing. The upswing that we saw in case of the latter was tiny and practically barely visible.
Let’s not forget that while things may seem calm (at least in case of the minings stocks) now, they might change very soon and very fast. The situation in the USD Index shows that the storm is already brewing.
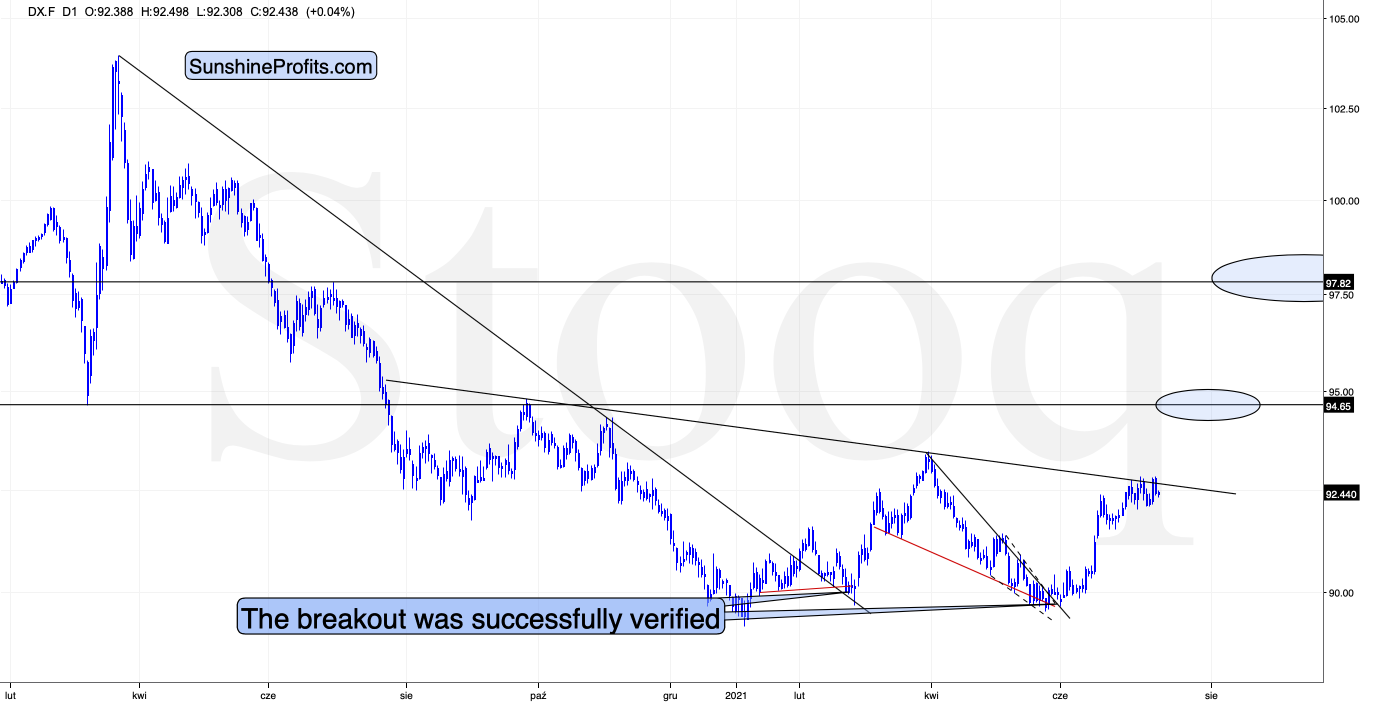
The U.S. currency is on the verge of breaking above the neck level of a medium-term inverse head-and-shoulders pattern. Once it breaks above it, it will likely rally to about 98 without looking back. When that happens, it’s very probable that it will trigger big declines in the precious metals sector – and this breakout in the USDX seems to be just around the corner.
Having said that, let’s take a look at the markets from a more fundamental angle.
Rinse, Repeat
With Jerome Powell, Chairman of the U.S. Federal Reserve (FED), telling Congress on Jul. 14 that the U.S. economy is “still a ways off,” investors rejoiced as the rhetoric implies that tapering is “still a ways off.” However, while Powell repeated his classic lines and maintained his classic stance, his short-term suppression of U.S. Treasury yields and the USD Index will likely result in even more violent upswings over the medium term.
Case in point: while Powell painted an ominous portrait of the U.S. economy, the FED also released its Beige Book on Jul. 14. For context, the report consolidates data from 12 regional FED banks ranging from the New York FED to the San Francisco FED.
Excerpts from the report read:
“The U.S. economy strengthened further from late May to early July, displaying moderate to robust growth. Sectors reporting above-average growth included transportation, travel and tourism, manufacturing, and nonfinancial services. Energy markets improved slightly, and agriculture had mixed results.”
“Healthy labor demand was broad-based but was seen as strongest for low-skilled positions. Wages increased at a moderate pace on average, and low-wage workers enjoyed above-average pay increase.... All Districts noted an increased use of non-wage cash incentives to attract and retain workers.”
More importantly, though:
What’s more, the NFIB Small Business Optimism Index (released on Jul. 13) increased by 2.9 points in June (to 102.5) and rose above 100 for the first time since November 2020. For context, the FED’s latest Small Business Credit Survey (SBCS) included the following tidbit: “The SBCS is an annual survey of firms with fewer than 500 employees. These types of firms represent 99.7% of all employer establishments in the United States.” The bottom line? The behavior of U.S. small businesses has a profound impact on the U.S. economy.
The NFIB report revealed:
“The net percent of owners raising average selling prices increased seven points to a net 47% (seasonally adjusted), the highest reading since January 1981.”
“A net 39% (seasonally adjusted) reported raising compensation, a record high. A net 26% plan to raise compensation in the next three months.”
“Owners’ plans to fill open positions continue, with a seasonally adjusted net 28 percent planning to create new jobs in the next three months, up 1 point from May. Job creation plans remain at record high levels.”
Quite the contradiction from Powell’s assessment, huh?
Moreover, while Powell’s dovish comments uplifted the PMs on Jul. 14, the NFIB’s commentary included an ominous warning:
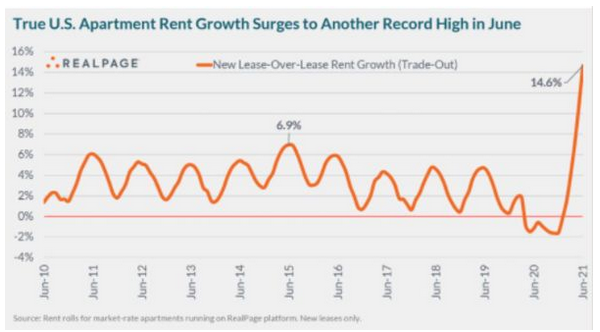
On top of that, I’ve been warning that rent inflation could add further upward pressure to the Consumer Price Index (CPI) in the coming months. And on Jul. 7, RealPage – a technology platform that serves over 19 million rental units worldwide – revealed that “rents are climbing at the fastest pace seen in decades.”
Please see below:
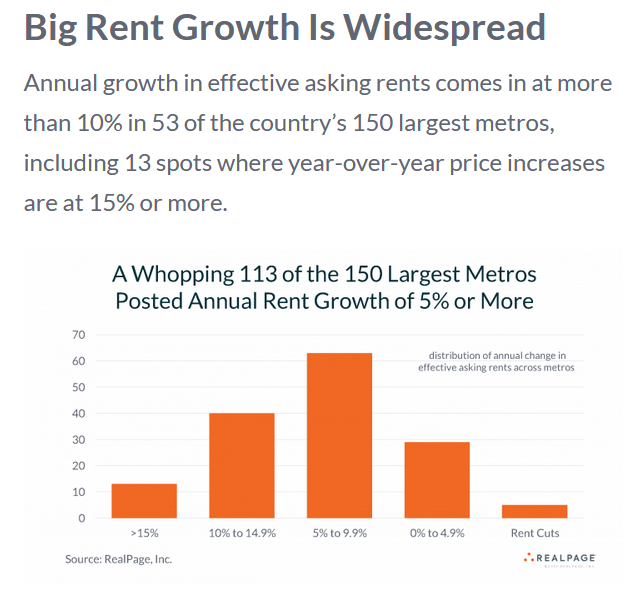 Furthermore, if we isolate the large U.S. areas with “at least 100,000 apartment units,” the situation is even worse: ranging from 10% year-over-year (YoY) growth in Orlando, Florida to 19.2% YoY growth in Phoenix, Arizona, the FED is sitting on an inflationary time bomb.
Please see below:
In addition, while Powell cites “base effects” as the reasons for the inflationary surge, new rental agreements are already tracking ahead of their pre-pandemic counterparts. And with the Shelter CPI accounting for more than 30% of the movement of the headline CPI, used cars and trucks should be the least of Powell’s concerns.
But even more revealing, the commodity PPI surged by 19.51% YoY on Jul. 14 – the highest YoY percentage increase since 1974. For context, the commodity PPI has increased by 15% or more YoY six times since 1994. And with 330 monthly observations recorded over that span, it amounts to 1.8% of historical readings. Furthermore, with the commodity PPI also rising by 1.83% month-over-month (MoM), Powell will likely regret his patience over the medium term.
To explain, I wrote on Jun. 15:
The commodity PPI often leads the headline CPI and that’s why tracking its movement is so important. If we analyze the performance of the pair during the inflationary surges of the 1970s and the early 1980s, it’s clear that the relationship has stood the test of time.
Please see below:
To explain, the green line above tracks the year-over-year (YoY) percentage change in the commodity PPI, while the red line above tracks the YoY percentage change in the headline CPI. If you analyze the relationship, you can see that the pair have a close connection.
More importantly, though, during the historical inflationary downpour, the month-over-month (MoM) percentage change in the commodity PPI never declined by more than 1.68%.
Please see below:
To explain, the green line above tracks the MoM percentage change in the commodity PPI. And if you compare the two MoM spikes in the commodity PPI to the two YoY spikes in the first chart above (focus your attention on the highs between 1972-1975 and 1978-1981), you can see that MoM resiliency helped sustain the YoY surges. In addition,, during the roughly nine-year bout of inflation, the commodity PPI dipped in-and-out of negative territory but never fell off of a cliff.
Now, if we circle back to the present, the YoY increase in the commodity PPI implies a headline CPI print of roughly 5.15% to 5.65% in July (when the data is released in August).
Please see below:
Finally, BlackRock CEO Larry Fink – who heads the world’s largest asset manager – told CNBC on Jul. 14 that “I worry about inflation [and] I do not believe inflation is going to be transitory.”
“I’m not trying to suggest that it’s going to be a straight-line upward, and there could be disappointments going forward. But overall, with the amount of fiscal stimulus and monetary stimulus, and more importantly with the amount of cash that is looking to be put to work, I believe the trend line is still going to be upward.”
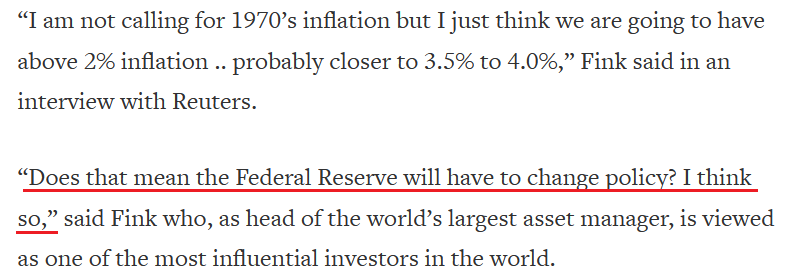
More importantly, though, when speaking with Reuters on Jul. 14, he also predicted the following:
In conclusion, while the PMs applauded Powell’s performance on Jul. 14, history has shown that the cheers often turn into jeers over the medium term. For example, nearly every dovish speech from Powell results in ‘PMs up, USD Index down.’ However, once the short-term high wears off and reality returns, the reversal of fortunes often ushers the precious metals lower than they were initially. Moreover, while taunting inflation may seem amusing in the short run, the FED’s nonchalance will likely result in an even faster taper once the pressure mounts. And with gold’s largest 2021 daily loss more than 1.58x its largest daily gain, the precious metals will likely run for cover once the drama unfolds.
Moreover, let’s keep in mind that gold stocks didn’t “buy” yesterday’s strength in gold. Their exceptional underperformance continues to suggest that the medium-term trend is down and that what we saw recently is nothing more than a prolonged breather, before another downswing.
Overview of the Upcoming Part of the Decline
- The barely visible corrective upswing in gold might already be over, and another huge decline is likely just around the corner.
- After miners slide in a meaningful and volatile way, but silver doesn’t (and it just declines moderately), I plan to switch from short positions in miners to short positions in silver. At this time, it’s too early to say at what price levels this would take place – perhaps with gold close to $1,600. I plan to exit those short positions when gold shows substantial strength relative to the USD Index, while the latter is still rallying. This might take place with gold close to $1,350 - $1,500 and the entire decline (from above $1,900 to about $1,475) would be likely to take place within 6-20 weeks, and I would expect silver to fall the hardest in the final part of the move. This moment (when gold performs very strongly against the rallying USD and miners are strong relative to gold – after gold has already declined substantially) is likely to be the best entry point for long-term investments, in my view. This might also happen with gold close to $1,475, but it’s too early to say with certainty at this time.
- As a confirmation for the above, I will use the (upcoming or perhaps we have already seen it?) top in the general stock market as the starting point for the three-month countdown. The reason is that after the 1929 top, gold miners declined for about three months after the general stock market started to slide. We also saw some confirmations of this theory based on the analogy to 2008. All in all, the precious metals sector would be likely to bottom about three months after the general stock market tops.
- The above is based on the information available today, and it might change in the following days/weeks.
Please note that the above timing details are relatively broad and “for general overview only” – so that you know more or less what I think and how volatile I think the moves are likely to be – on an approximate basis. These time targets are not binding or clear enough for me to think that they should be used for purchasing options, warrants or similar instruments.
Letters from Subscribers
Q: When you say to short junior miners, do you mean individual junior mining stocks, or specifically GDXJ, or is there an ETF that shorts, or should we just use the JDST?
A: I think that all those approaches would work: shorting individual junior miners (one would need to diversify though), shorting GDXJ, or going long the JDST. Shorting GDXJ or going long JDST would likely be cheaper in terms of brokerage fees and would provide more flexibility in case of quickly entering and exiting positions in case of counter-trend moves, so I would go with either of them (depending on one’s preference regarding leverage) instead of the individual junior miners, but shorting miners individually would likely provide good results anyway.
Q: PR, I intend to purchase more physical PMs on the final bottom. Which is the most undervalued? Secondly, it is very difficult for me to see our brokerage accounts surviving the final collapse. What are your thoughts? Love your work!
A: Thanks, I’m very happy that you enjoy it! If I was going to purchase a physical metal at or close to the final bottom, and I would be choosing the precious metal with the most upside potential, I would choose silver.
I will, however, focus on purchasing mining stocks at that time, as they tend to rally the most in the initial parts of the rally. I plan to partially switch from mining stocks to silver and gold as the price recovers (likely a few months after the bottom).
I don’t think that the brokerage accounts (financial system as a whole, etc.) would be destroyed even if the general stock market declined profoundly along with the PMs. For comparison, even though the 2020 slide was huge and values of stocks declined substantially, the brokerage accounts by themselves were not affected. Massive rallies and massive declines would be likely to result in a major transfer of wealth but not to destroy the mechanisms used to transfer it (including brokerage accounts).
Summary
To summarize, even though gold could still move somewhat higher in the near term, it seems that having a short position in the junior mining stocks is much more justified from the risk-to-reward point of view than having a long one in any part of the precious metals market. Gold miners’ exceptional underperformance along with the inverse head-and-shoulders pattern in the USD Index make the bearish outlook justified from the risk-to-reward point of view.
Due to the increased clarity regarding the likely next interim bottom in gold (previous 2021 lows) and mining stocks (below their previous 2021 lows), the profit-take levels on our current short position are not pointing to the final bottom, but to the likely interim one. This does not imply that the entire decline is going to be smaller than first believed. It’s simply a consequence of the short-term target becoming more crystallized.
After the sell-off (that takes gold to about $1,350 - $1,500), I expect the precious metals to rally significantly. The final part of the decline might take as little as 1-5 weeks, so it's important to stay alert to any changes.
Most importantly, please stay healthy and safe. We made a lot of money last March and this March, and it seems that we’re about to make much more on the upcoming decline, but you have to be healthy to enjoy the results.
As always, we'll keep you - our subscribers - informed.
By the way, we’re currently providing you with a possibility to extend your subscription by a year, two years or even three years with a special 20% discount. This discount can be applied right away, without the need to wait for your next renewal – if you choose to secure your premium access and complete the payment upfront. The boring time in the PMs is definitely over and the time to pay close attention to the market is here. Naturally, it’s your capital, and the choice is up to you, but it seems that it might be a good idea to secure more premium access now, while saving 20% at the same time. Our support team will be happy to assist you in the above-described upgrade at preferential terms – if you’d like to proceed, please contact us.
To summarize:
Trading capital (supplementary part of the portfolio; our opinion): Full speculative short positions (300% of the full position) in mining stocks are justified from the risk to reward point of view with the following binding exit profit-take price levels:
Mining stocks (price levels for the GDXJ ETF): binding profit-take exit price: $37.12; stop-loss: none (the volatility is too big to justify a stop-loss order in case of this particular trade)
Alternatively, if one seeks leverage, we’re providing the binding profit-take levels for the JDST (2x leveraged) and GDXD (3x leveraged – which is not suggested for most traders/investors due to the significant leverage). The binding profit-take level for the JDST: $15.96; stop-loss for the JDST: none (the volatility is too big to justify a SL order in case of this particular trade); binding profit-take level for the GDXD: $37.02; stop-loss for the GDXD: none (the volatility is too big to justify a SL order in case of this particular trade).
For-your-information targets (our opinion; we continue to think that mining stocks are the preferred way of taking advantage of the upcoming price move, but if for whatever reason one wants / has to use silver or gold for this trade, we are providing the details anyway.):
Silver futures upside profit-take exit price: unclear at this time - initially, it might be a good idea to exit, when gold moves to $1,683
Gold futures upside profit-take exit price: $1,683
HGD.TO – alternative (Canadian) inverse 2x leveraged gold stocks ETF – the upside profit-take exit price: $12.88
Long-term capital (core part of the portfolio; our opinion): No positions (in other words: cash
Insurance capital (core part of the portfolio; our opinion): Full position
Whether you already subscribed or not, we encourage you to find out how to make the most of our alerts and read our replies to the most common alert-and-gold-trading-related-questions.
Please note that we describe the situation for the day that the alert is posted in the trading section. In other words, if we are writing about a speculative position, it means that it is up-to-date on the day it was posted. We are also featuring the initial target prices to decide whether keeping a position on a given day is in tune with your approach (some moves are too small for medium-term traders, and some might appear too big for day-traders).
Additionally, you might want to read why our stop-loss orders are usually relatively far from the current price.
Please note that a full position doesn't mean using all of the capital for a given trade. You will find details on our thoughts on gold portfolio structuring in the Key Insights section on our website.
As a reminder - "initial target price" means exactly that - an "initial" one. It's not a price level at which we suggest closing positions. If this becomes the case (like it did in the previous trade), we will refer to these levels as levels of exit orders (exactly as we've done previously). Stop-loss levels, however, are naturally not "initial", but something that, in our opinion, might be entered as an order.
Since it is impossible to synchronize target prices and stop-loss levels for all the ETFs and ETNs with the main markets that we provide these levels for (gold, silver and mining stocks - the GDX ETF), the stop-loss levels and target prices for other ETNs and ETF (among other: UGL, GLL, AGQ, ZSL, NUGT, DUST, JNUG, JDST) are provided as supplementary, and not as "final". This means that if a stop-loss or a target level is reached for any of the "additional instruments" (GLL for instance), but not for the "main instrument" (gold in this case), we will view positions in both gold and GLL as still open and the stop-loss for GLL would have to be moved lower. On the other hand, if gold moves to a stop-loss level but GLL doesn't, then we will view both positions (in gold and GLL) as closed. In other words, since it's not possible to be 100% certain that each related instrument moves to a given level when the underlying instrument does, we can't provide levels that would be binding. The levels that we do provide are our best estimate of the levels that will correspond to the levels in the underlying assets, but it will be the underlying assets that one will need to focus on regarding the signs pointing to closing a given position or keeping it open. We might adjust the levels in the "additional instruments" without adjusting the levels in the "main instruments", which will simply mean that we have improved our estimation of these levels, not that we changed our outlook on the markets. We are already working on a tool that would update these levels daily for the most popular ETFs, ETNs and individual mining stocks.
Our preferred ways to invest in and to trade gold along with the reasoning can be found in the how to buy gold section. Furthermore, our preferred ETFs and ETNs can be found in our Gold & Silver ETF Ranking.
As a reminder, Gold & Silver Trading Alerts are posted before or on each trading day (we usually post them before the opening bell, but we don't promise doing that each day). If there's anything urgent, we will send you an additional small alert before posting the main one.
Thank you.
Przemyslaw Radomski, CFA
Founder, Editor-in-chief


