Briefly: In our opinion, full (150% of the regular full position) speculative short positions in gold, silver and mining stocks are justified from the risk/reward perspective at the moment of publishing this alert.
No market can move up or down in a straight line and Friday’s session proved that mining stocks are not immune to this rule. The latter rallied, while the USD Index reversed before the end of the session. Was this the end of the decline – something that gold and silver’s Thursday’s show of strength had heralded?
Most likely, it was not the case. Let’s take a look at how gold stocks rallied on Friday (chart courtesy of http://stockcharts.com).
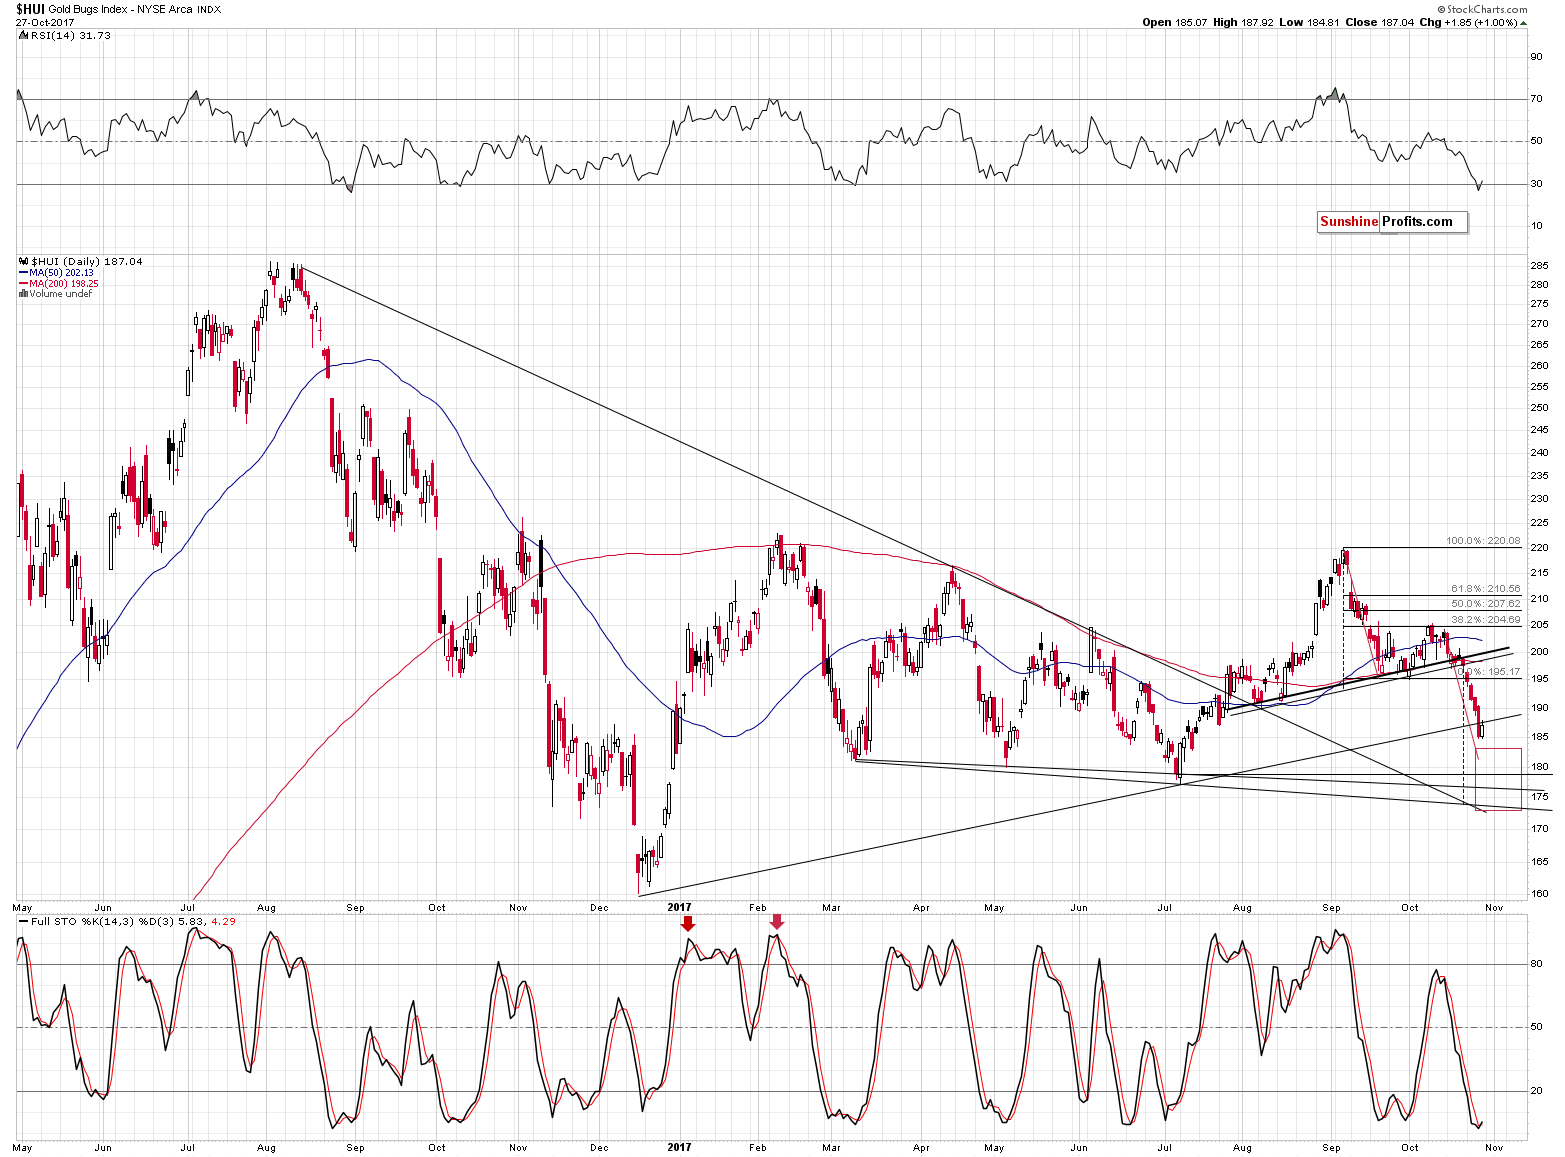
First of all, gold stocks rallied insignificantly. The move higher that we saw was smaller than even half of the preceding day’s decline. What’s more important, however, is that this move didn’t take the HUI Index back above the rising medium-term support/resistance line (based on the December 2016 and July 2017 bottoms). In other words, miners didn’t invalidate Thursday’s breakdown – they are verifying it.
The additional bearish implications of the rally come from the fact that gold stocks were unable to invalidate the breakdown even though the general stock market rallied sharply and closed the week at new highs.
What about the USD Index? Surely it’s reversal had some bearish implications which should be bullish for the precious metals sector?
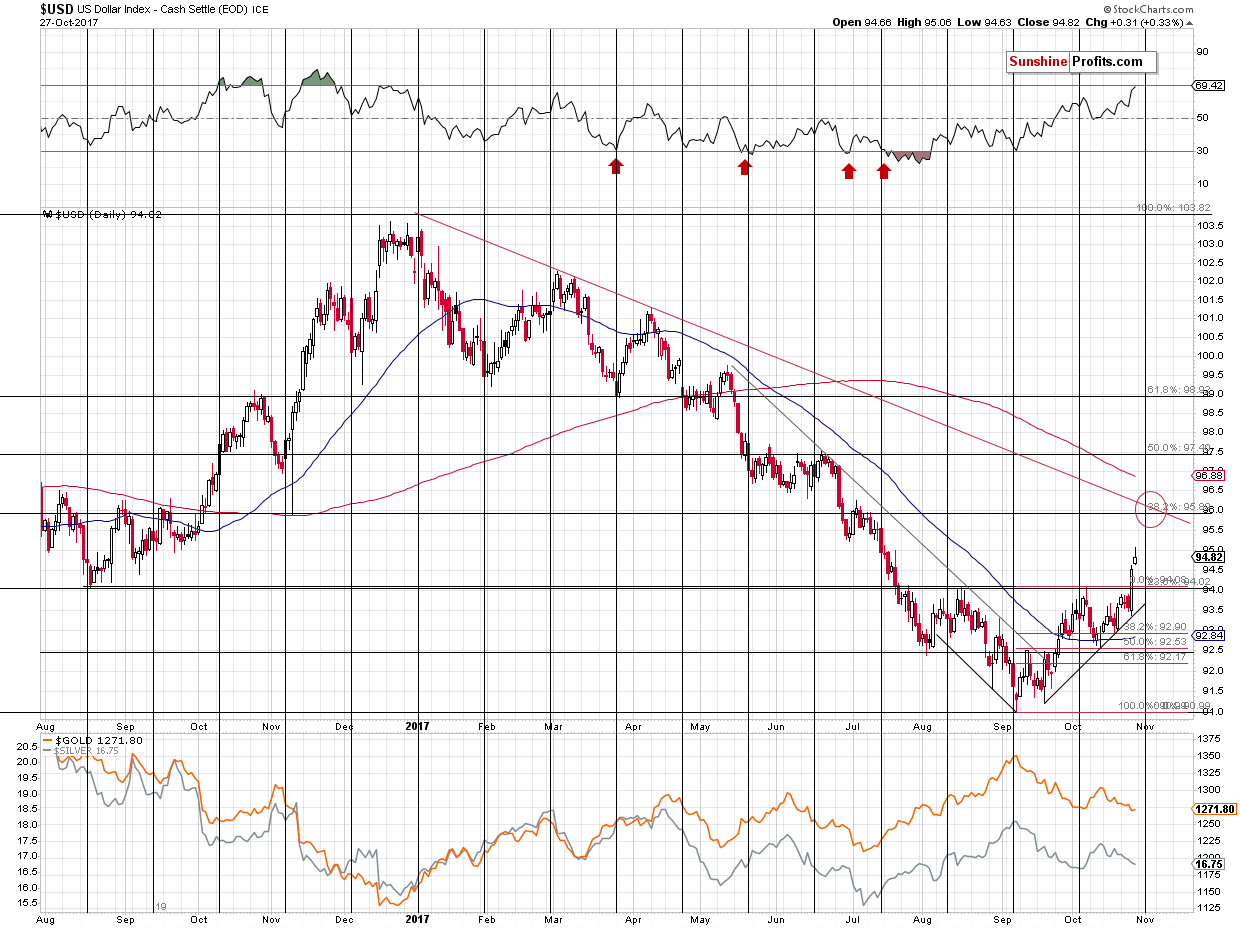
Not necessarily. Well, to be honest, a daily reversal IS a bearish sign when it’s seen after a rally, but in light of the breakout above the neck level of the reverse head-and-shoulders formation and a weekly close above it, it seems that Friday’s session can be viewed as bullish precisely because it ended without invalidating the mentioned breakout.
In light of the latter, even if the USD is to reverse here, it’s likely to move lower only to the previously broken neck level (94). Consequently, the downside is very limited and such a small downswing could simply be a verification of the breakout. So, are the implications really bearish for the USD? In our view, not really.
Even though the USD Index could move a bit lower in the short run, our previous comments remain up-to-date:
Moving on to the star of yesterday’s session, we see that the reverse head and shoulders formation was clearly completed and the implications are very bullish. Still, let’s keep in mind that the formation could still become invalidated and if that happens, the USD would be likely to move to 92.5 or lower – maybe even to the 91 bottom. This is not likely, but we want to prepare you for this possibility. At the moment of writing these words, the USD Index is trading at 94.86, so it has a long way down to invalidate the breakout above 94 and – again – the invalidation of the breakout doesn’t appear likely, but it should be kept in mind nonetheless.
What is likely is the scenario that we had outlined previously – a quick run to the 95.5 – 96.5 area (96 being the most likely target) followed by a local (not the final one) top in early November.
The RSI indicator is moving close to the 70 level, but that doesn’t concern us as in the recent past there were only 2 similar cases - about a year ago. In both of them, the USD Index continued to rally to much higher levels before the top was in (PMs continued to decline).
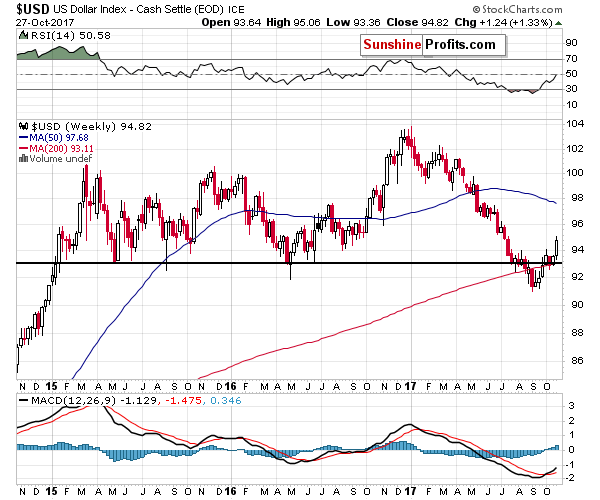
Moreover, if we look at the USD’s performance from the weekly point of view, we’ll see that the previous breakdown below the 2015 and 2016 lows is now clearly invalidated. Consequently, higher USD values are likely to follow in the weeks and months to come.
Moving on to the metals market, as you can see below there were very little changes in the case of gold and silver on Friday.
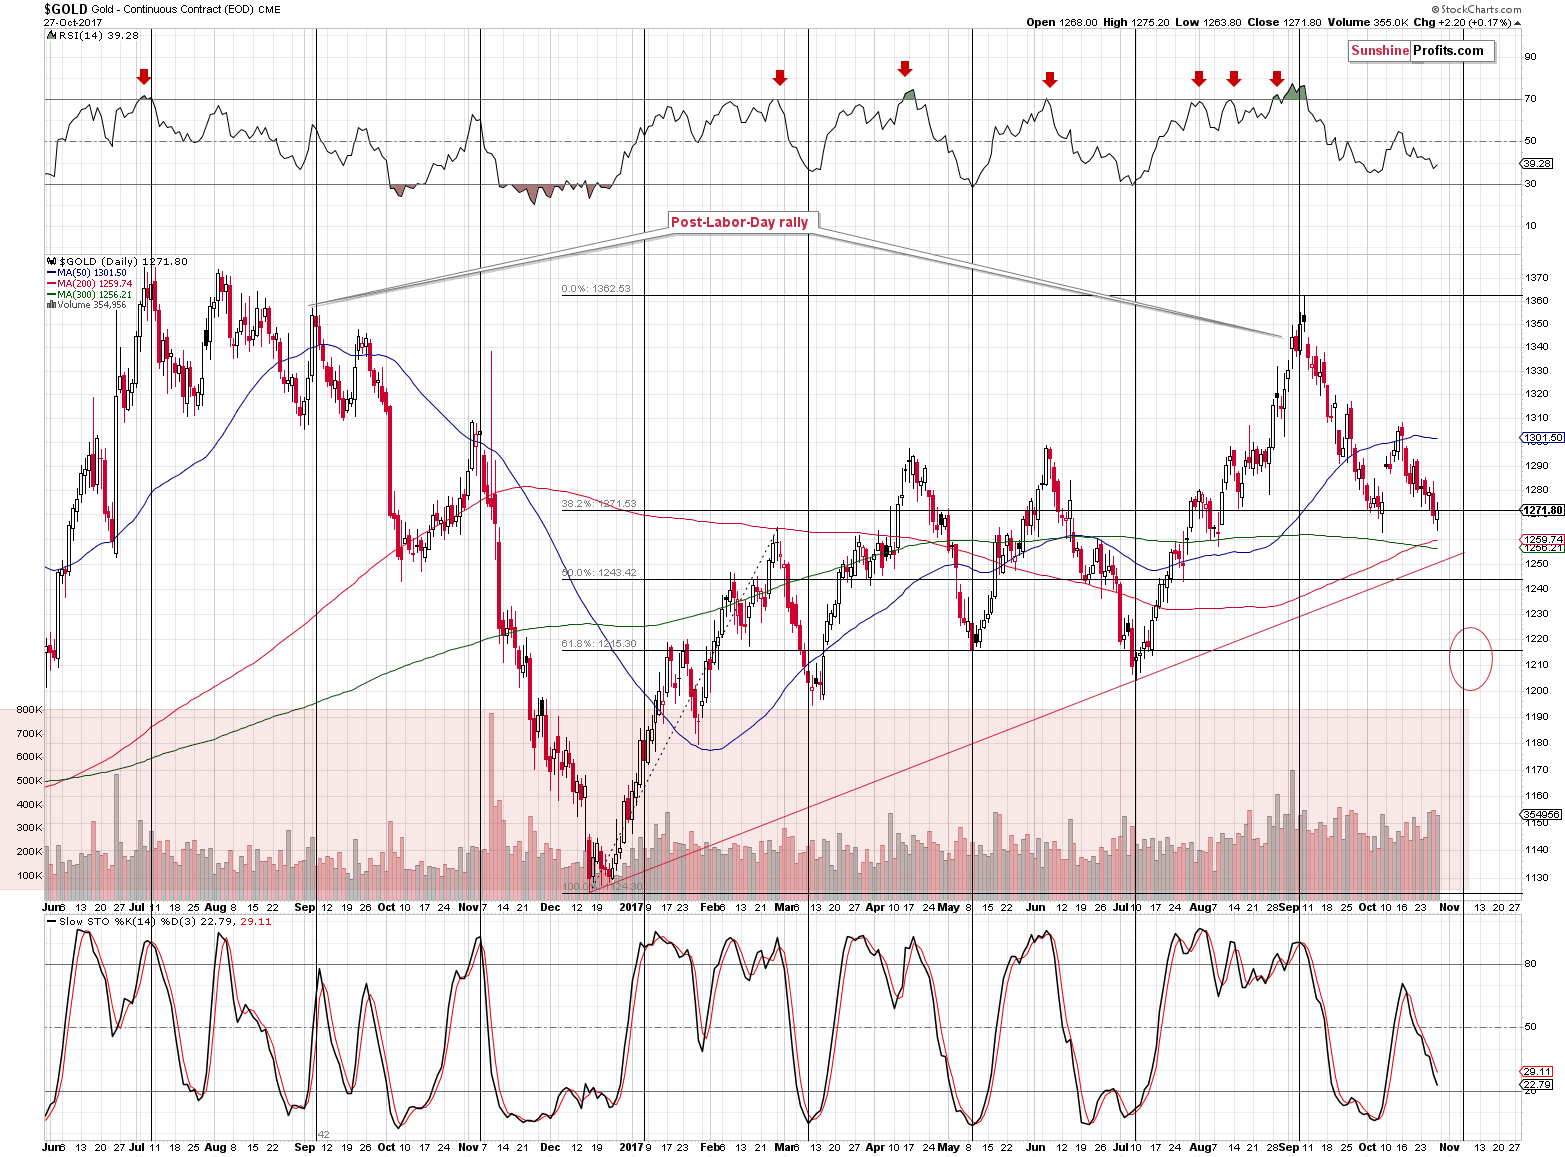
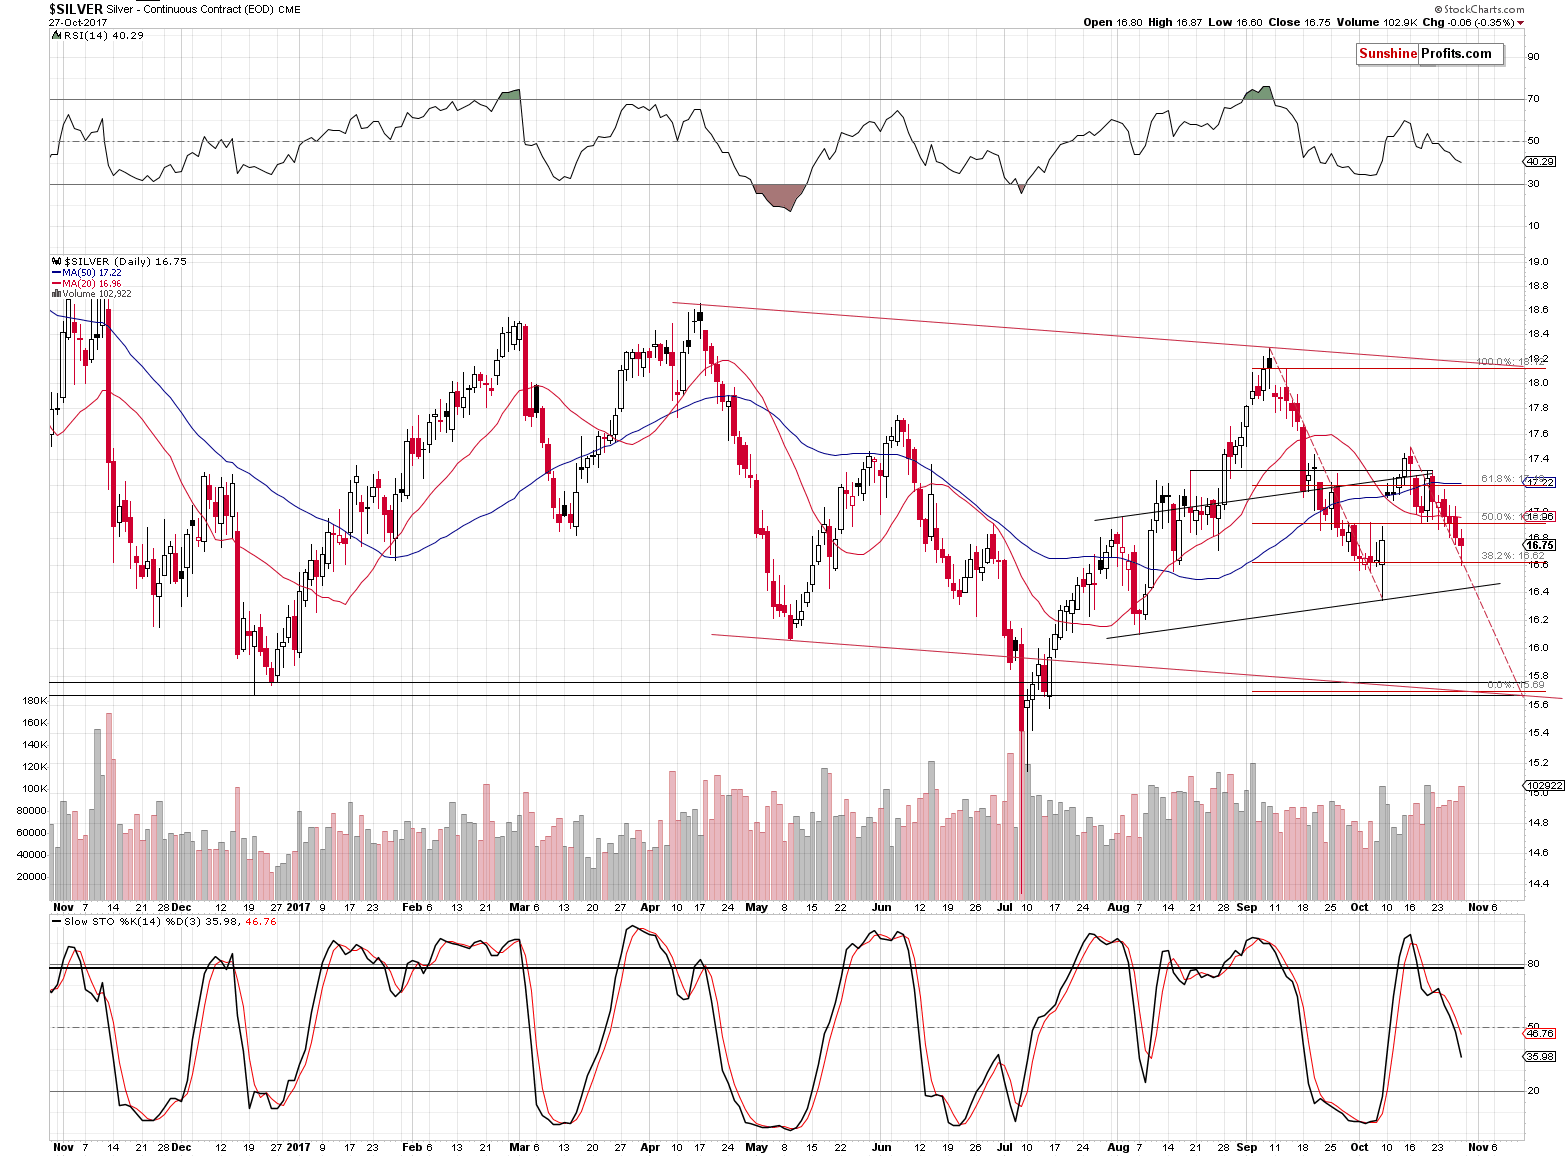
However, from the long-term point of view, we can see several important developments based on what happened last week.
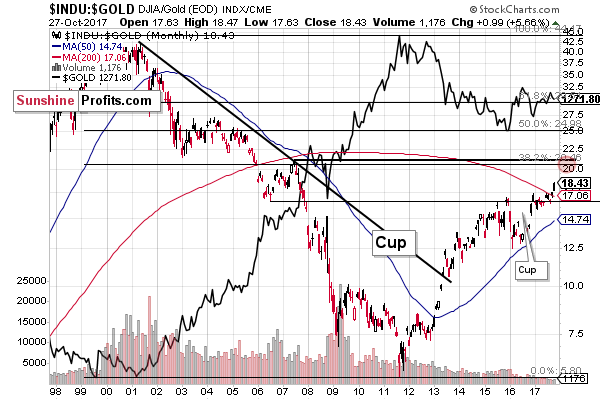
First of all, we would like to quote our previous (Sep. 14) comments on the Dow to gold ratio:
The cup and handle pattern is a bullish formation that is often followed by significant price moves to the upside. For instance, we saw it in gold from late 1999 to June 2002 (cup) and then to November 2002 (handle) and a major rally followed – in fact, that was how the entire bull market started.
Moving back to the above chart, the main cup formed from 2008 to 2015 and the handle has been forming since 2015. Interestingly, the ratio created a smaller cup in the first part of the handle. The ratio is now forming the final part of the big handle which is also the handle of the smaller cup. The bullish implications are stronger than they would be in case of only one formation as they now confirm each other.
With the ratio likely to move higher, gold is likely to move down as it’s in the denominator of the ratio. Since the ratio has medium-term implications, it’s likely that gold will go down in the medium term.
Both cup-and-handle formations were completed and the Dow-to-gold ratio indeed moved higher. When was the last time the ratio broke higher and rallied significantly? In early 2013 – that’s what accompanied and confirmed the decline in the precious metals sector. Naturally the implications for the following weeks and months are bullish for the ratio and bearish for the prices of precious metals. This is the case even though the above is based on monthly candlesticks and there are only two more sessions left before the month is over, and it seems highly unlikely that we will see a major invalidation of the above.
Speaking of long-term signals, gold’s long-term chart’s implications continue to be bearish and it seems that quoting our October 25 Alert would be useful:
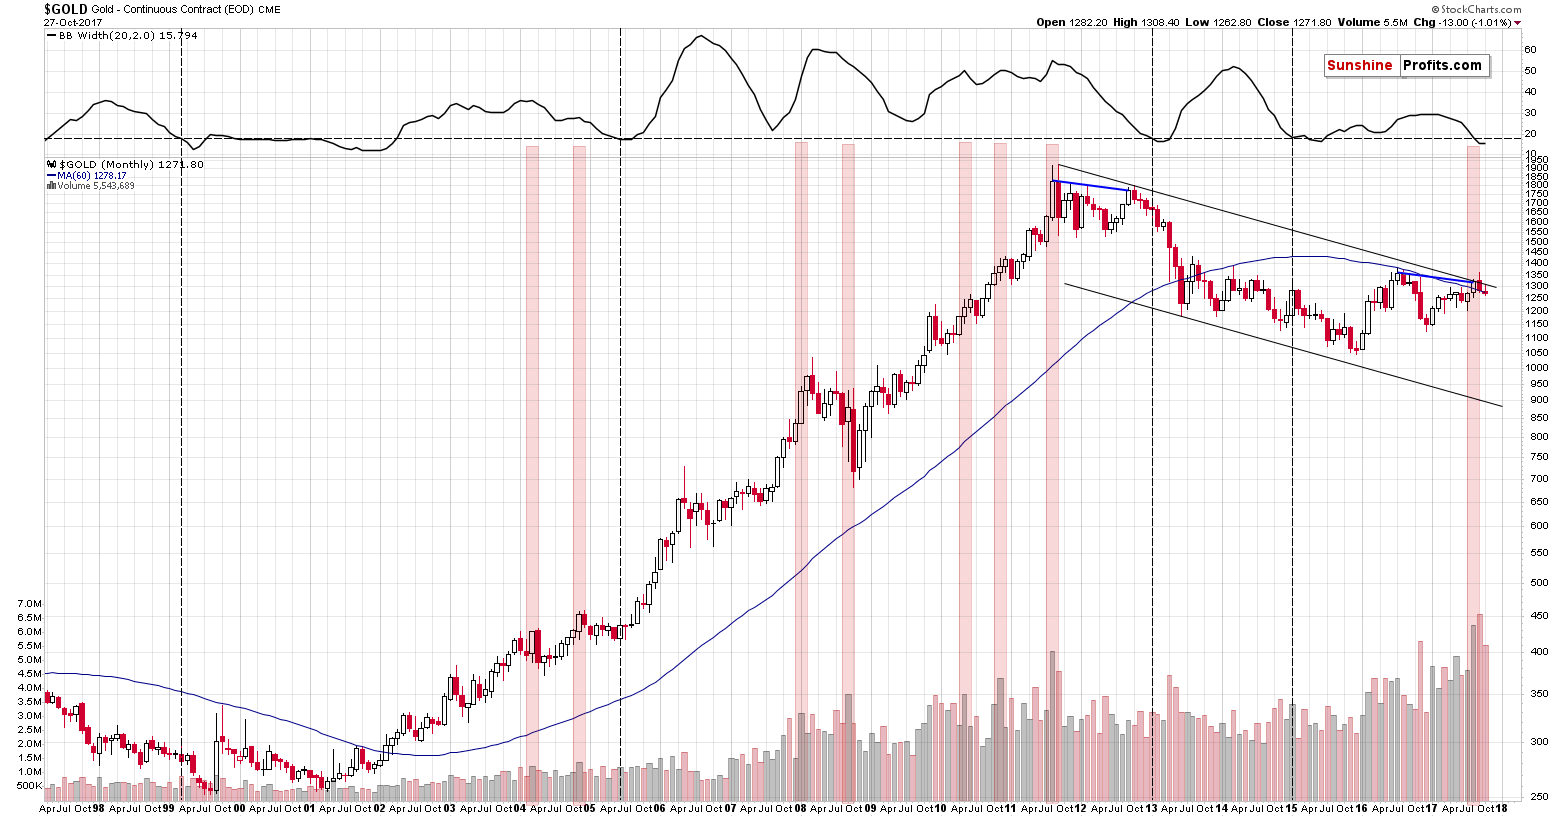
Namely, the analogy to the to the situation just before the biggest slide of the recent past remains in place. We don’t want to quote the entire article here, but since it remains up-to-date, please read it if you haven’t done so already.
Today, we would not only like to add that the analogy to what happened after the last 2012 top remains in perfect tune – we would also like to say that the sharpest part of the 2013 decline started when the Bollinger Band’s width stopped narrowing. The above is easier to observe when it’s in the form of an indicator, so we put it in the upper part of the above chart as such.
October is not over yet, but since there are only five more sessions remaining, it doesn’t seem that a lot will change from the long-term point of view. Consequently, it seems that we are about to see a halt in the narrowing of the Bollinger Band’s width. In light of what followed back in 2013, the implications are profoundly bearish.
You know what else happened in 2013 right before the sharpest part of the slide? Mining stocks were underperforming to a great extent – they were even declining on their own. Well, that was what we’ve been writing about for most of today’s alert. The implications are clearly bearish for the following months.
Now there are only two more sessions and the Bollinger Band’s width didn’t widen, so the implications are more bullish as the above signal is clearer.
While we are discussing gold’s long-term picture, we would like to remind you about the analogy that we discussed over a year ago – the analogy to what happened in early 80s.
You can read the entire analysis using the link above – we’ll quote just the key part below along with gold’s chart and gold’s price in early 80s:
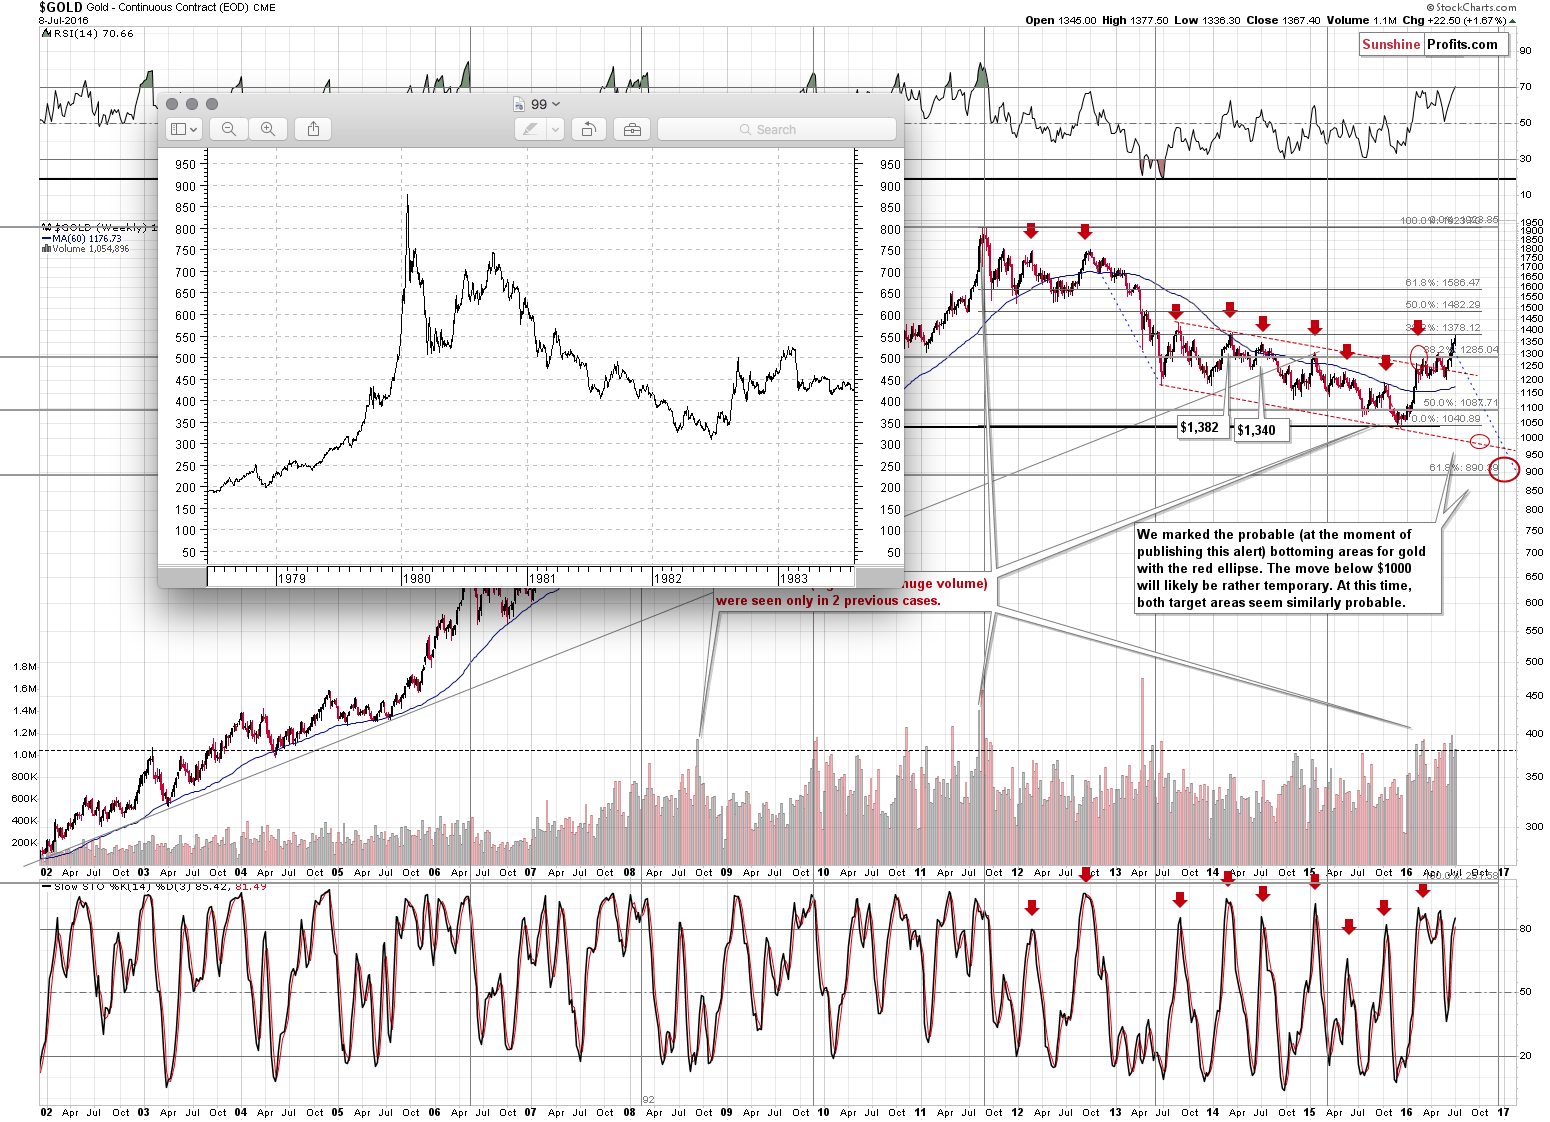
(…) let us re-emphasize that gold tends to repeat its price moves. At times it does it to the letter, but in most cases it is the shape of the move that matters the most. This self-similarity pattern phenomenon can provide a roadmap of the following events – if we detect that we have one that is (Fractalyzer does that automatically, but some things can be also detected manually). There are multiple similarities in the pattern: the parabolic upswing, the 2 tops that followed it, the initial big decline after a breakdown below the initial low, followed by a less steep decline. In both cases after the “final” bottom, the initial rally was very sharp, then we saw some sideways movement and then an additional rally a bit above the previous high.
The above makes the 2 cases very similar already, but that’s not all there is to it. Both post-bottom rallies took a little more than 6 months before the decline resumed. How high did gold rally initially in both cases? More or less to the first visible local high.
The pattern is from the end of the previous bull market (1980 top) and what followed it and while we don’t think the bull market is completely over this time, the emotions that accompanied investors in 1980 are similar to those at the 2011 top. Consequently, there are good reasons to think that the price patterns after these tops can be similar.
What does the similarity mean? That the price pattern is likely to continue, so the follow-up action in the price pattern from the past can tell us a lot about what’s likely to follow.
What is likely to happen next? The same thing – or something very similar to it – that happened in the past after this pattern. In the past, gold rallied only a little above the previous high (the one that formed after the initial sharp rally) and then it topped. After that gold moved to new lows.
(…)
How far did gold decline in 1983 after the top? "It finally moved to new lows, but initially it declined more or less to the previous local bottom and applying this to the current situation provides us with $1,200 as the initial target (over $150 lower than the current gold price).
With the benefit of hindsight, we know that gold indeed declined to $1,200 – and even some more. However, let’s keep in mind that if the analogy is to continue at least on an approximate basis, we should be prepared for gold moving to new lows (that is below the 2015 low).
Summing up, it seems that another wave higher in the USD has just started and higher USD values are to be expected even though a quick pullback to the previously broken 94 level is possible. Mining stocks moved higher on Friday, but they didn’t manage to invalidate the recent breakdown despite help from the soaring stock market. All in all, the implications for the following days are bearish even though we could see corrective action in first days of the week. As far as the medium-term outlook is concerned, the outlook remains bearish and multiple bearish signs continue to confirm it: gold’s huge monthly volume, the analogy in the HUI Index, the analogy between the two most recent series of interest rate hikes, the breakout in Nikkei and the RSI signal from gold priced in the Japanese yen.
As far as the following weeks are concerned, it seems that we could see another rebound during the decline, but not likely until gold moves to the $1,200 - $1,220 range, which is likely to take place in the first half of November. The analogous range for the USD Index is 95.5 – 96.5 with the 96 level being the most likely target.
As always, we will keep you – our subscribers – informed.
To summarize:
Trading capital (supplementary part of the portfolio; our opinion): Short positions (150% of the full position) in gold, silver and mining stocks are justified from the risk/reward perspective with the following stop-loss orders and exit price levels / profit-take orders:
- Gold: exit price: $1,218; stop-loss: $1,366; exit price for the DGLD ETN: $51.98; stop-loss for the DGLD ETN $38.74
- Silver: exit price: $15.82; stop-loss: $19.22; exit price for the DSLV ETN: $28.88; stop-loss for the DSLV ETN $17.93
- Mining stocks (price levels for the GDX ETF): exit price: $21.23; stop-loss: $26.34; exit price for the DUST ETF: $29.97; stop-loss for the DUST ETF $21.37
In case one wants to bet on junior mining stocks' prices (we do not suggest doing so – we think senior mining stocks are more predictable in the case of short-term trades – if one wants to do it anyway, we provide the details), here are the stop-loss details and exit prices:
- GDXJ ETF: exit price: $30.28; stop-loss: $45.31
- JDST ETF: exit price: $66.27; stop-loss: $43.12
Long-term capital (core part of the portfolio; our opinion): No positions (in other words: cash)
Insurance capital (core part of the portfolio; our opinion): Full position
Important Details for New Subscribers
Whether you already subscribed or not, we encourage you to find out how to make the most of our alerts and read our replies to the most common alert-and-gold-trading-related-questions.
Please note that the in the trading section we describe the situation for the day that the alert is posted. In other words, it we are writing about a speculative position, it means that it is up-to-date on the day it was posted. We are also featuring the initial target prices, so that you can decide whether keeping a position on a given day is something that is in tune with your approach (some moves are too small for medium-term traders and some might appear too big for day-traders).
Plus, you might want to read why our stop-loss orders are usually relatively far from the current price.
Please note that a full position doesn’t mean using all of the capital for a given trade. You will find details on our thoughts on gold portfolio structuring in the Key Insights section on our website.
As a reminder – “initial target price” means exactly that – an “initial” one, it’s not a price level at which we suggest closing positions. If this becomes the case (like it did in the previous trade) we will refer to these levels as levels of exit orders (exactly as we’ve done previously). Stop-loss levels, however, are naturally not “initial”, but something that, in our opinion, might be entered as an order.
Since it is impossible to synchronize target prices and stop-loss levels for all the ETFs and ETNs with the main markets that we provide these levels for (gold, silver and mining stocks – the GDX ETF), the stop-loss levels and target prices for other ETNs and ETF (among other: UGLD, DGLD, USLV, DSLV, NUGT, DUST, JNUG, JDST) are provided as supplementary, and not as “final”. This means that if a stop-loss or a target level is reached for any of the “additional instruments” (DGLD for instance), but not for the “main instrument” (gold in this case), we will view positions in both gold and DGLD as still open and the stop-loss for DGLD would have to be moved lower. On the other hand, if gold moves to a stop-loss level but DGLD doesn’t, then we will view both positions (in gold and DGLD) as closed. In other words, since it’s not possible to be 100% certain that each related instrument moves to a given level when the underlying instrument does, we can’t provide levels that would be binding. The levels that we do provide are our best estimate of the levels that will correspond to the levels in the underlying assets, but it will be the underlying assets that one will need to focus on regarding the signs pointing to closing a given position or keeping it open. We might adjust the levels in the “additional instruments” without adjusting the levels in the “main instruments”, which will simply mean that we have improved our estimation of these levels, not that we changed our outlook on the markets. We are already working on a tool that would update these levels on a daily basis for the most popular ETFs, ETNs and individual mining stocks.
Our preferred ways to invest in and to trade gold along with the reasoning can be found in the how to buy gold section. Additionally, our preferred ETFs and ETNs can be found in our Gold & Silver ETF Ranking.
As a reminder, Gold & Silver Trading Alerts are posted before or on each trading day (we usually post them before the opening bell, but we don't promise doing that each day). If there's anything urgent, we will send you an additional small alert before posting the main one.
=====
Latest Free Trading Alerts:
On Friday, Catalonia declared independence from Spain. What does it mean for the gold market?
Will Catalan Independence Make Gold Rally?
S&P 500 index gained 0.8% on Friday, as investors reacted to the main tech stocks quarterly earnings releases. Will uptrend continue even further?
S&P 500 Reaches New Record High As Tech Stocks Rally
=====
Hand-picked precious-metals-related links:
PRECIOUS-Gold edges down on caution ahead of key central bank meetings
Gold Speculators Cut Back On Their Bullish Net Positions This Week
=====
In other news:
Dollar consolidates gains as economic outlook brightens
U.S. consumer spending posts largest gain since 2009
Trump Fires Off Tweets a Day Before Russia Probe Charges May Drop
Trump’s Ex-Campaign Chairman Manafort Told to Surrender to U.S.
World stocks hit new high as Spanish relief, tech rally boost European trading
Work resumes normally in Catalonia as Spain enforces direct rule
Asian Stocks Mixed as Chinese Shares, Bonds Tumble: Markets Wrap
China to publish unified GDP data in fraud crackdown: statistics bureau
=====
Thank you.
Sincerely,
Przemyslaw Radomski, CFA
Founder, Editor-in-chief, Gold & Silver Fund Manager
Gold & Silver Trading Alerts
Forex Trading Alerts
Oil Investment Updates
Oil Trading Alerts


